HOOD Breakout Watch – Eyeing $103+
🧠 Chart Breakdown:
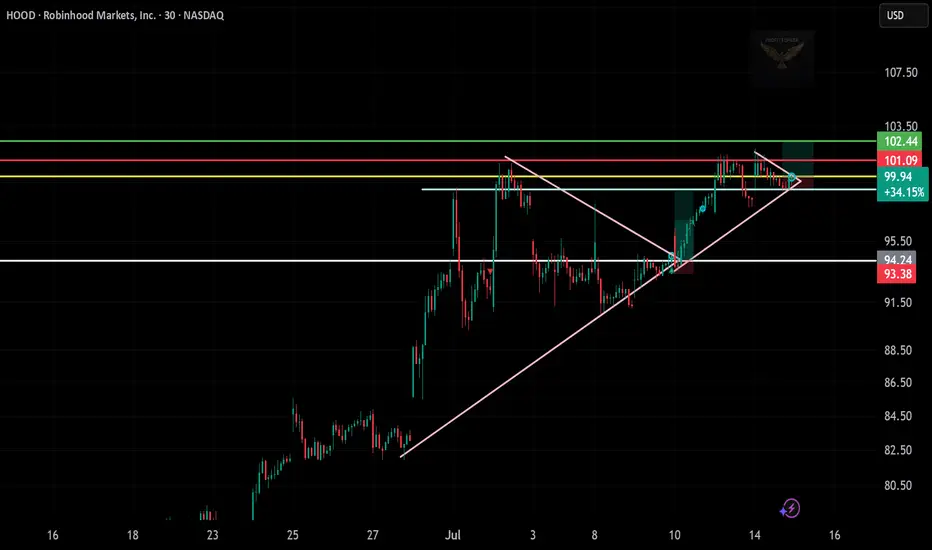
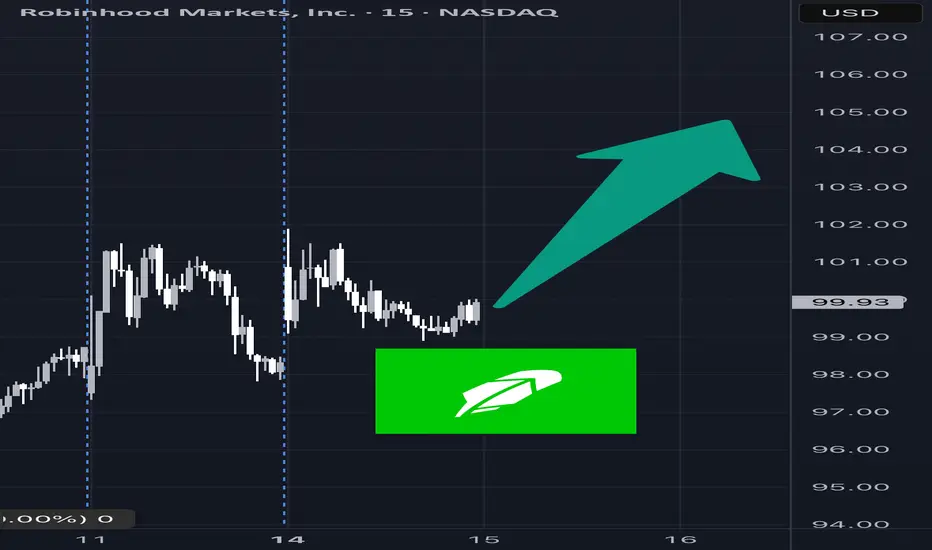
Setup: Price broke out of a large ascending triangle and is now forming a mini symmetrical triangle — a consolidation before a possible continuation.
Current Price: $99.94
Breakout Zone: Near $100, close to decision point.
📊 Key Levels:
Immediate Resistance:
$101.09 (yellow)
$102.44 (first green target)
$103.50 (final target zone)
Support Levels:
$94.74 (white line)
$93.38 (stop-loss zone)
🎯 Trade Idea (Bullish Bias):
Entry: $100.00
Target 1: $102.44
Target 2: $103.50
Stop-Loss: Below $94.74
VRTX Tight Triangle Breakout – Watch Closely
🧠 Chart Analysis Summary:
Pattern: A symmetrical triangle is visible, tightening toward the apex with a breakout just forming.
Current Price: $472.47 (breakout near)
Key Levels:
Support Zone: Around $468–470 (white/yellow zone)
Resistance Zone:
First Target: $477.01 (red line)
Major Target: $482.20 (green line)
Volume Confirmation: Suggested to confirm breakout with volume increase.
📊 Trade Idea (Long Setup):
Entry: $472.50–473.00
Target 1: $477.00
Target 2: $482.00
Stop-Loss: Below $468.00

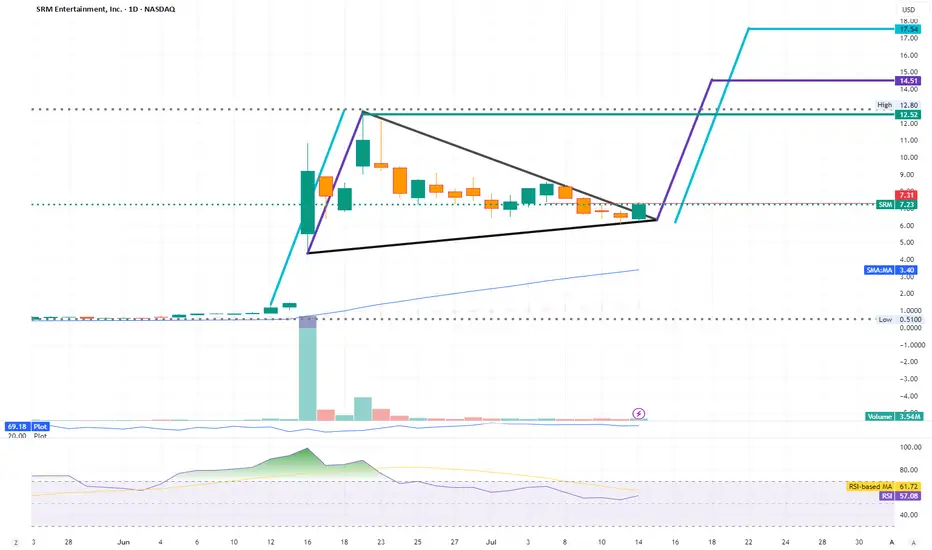
SRM - SRM Entertainment Inc (Soon to be TRON INC.)SRM Entertainment (SRM) used to design, development, and delivery of toys and themed merchandise for the global amusement and entertainment industry. They work with popular brands like Harry Potter, Frozen, Marvel, and Star Wars to create exclusive products found in various venues. However, through a reverse takeover they're are planning to change their name to Tron Inc.
The main reason for this shift is a $100 million equity investment dedicated to a new TRON Token Treasury Strategy. Justin Sun, the founder of the TRON blockchain, is also coming on board as an advisor. This move means they're completely shifting away from their prior business to focus on revenue generation within the blockchain space, with plans to implement a dividend policy through TRX staking.
Financially, SRM's past performance showed some weaknesses, with negative net income. However, what they did in the past is meaningless and has nothing to do with what they are doing now. The new $100 million investment significantly changes their financial outlook, providing substantial capital for their new direction. Currently, they report around $1.09 million in cash and short term investments, with total assets at about $5.81 million and liabilities around $828K.
The move into blockchain with a significant investment and Justin Sun's involvement could position them in a growing technology sector. If the TRON Token Treasury Strategy is successful and the blockchain market expands, there's potential for upside and a dividend policy from TRX staking could attract investors.
Their new model focuses on the TRON Token Treasury Strategy. They plan to generate revenue by acquiring and holding TRON (TRX) tokens, benefiting if the TRX value increases. They'll also earn staking rewards by locking up their TRX holdings to support the TRON network, and, once stable, they intend to distribute a portion of these staking rewards as dividends to shareholders. This strategy ties their financial performance directly to the TRON blockchain ecosystem.
Overall, this is a high risk, high reward situation. It will requires careful monitoring given volatility of the crypto market. It's not a typical long term, low maintenance investment at this stage.
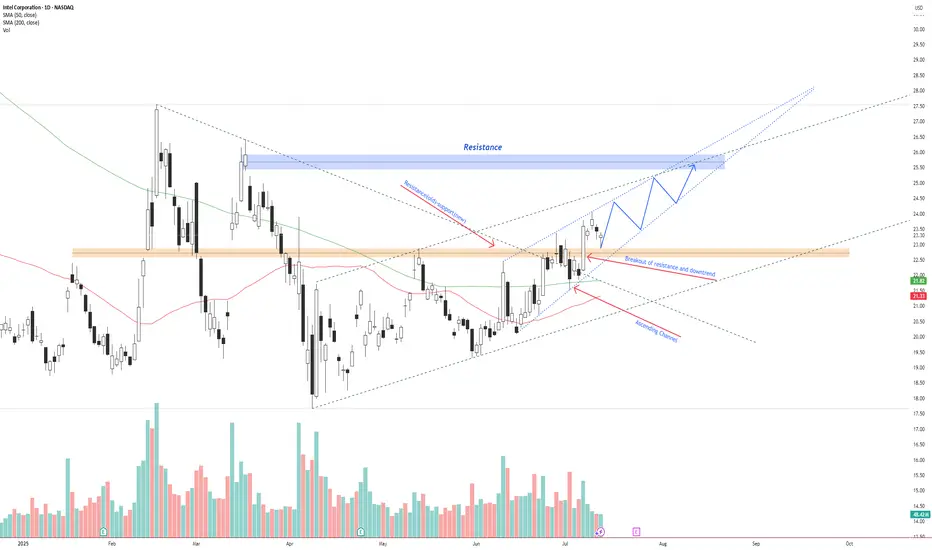
INTC – Breakout Confirmed, Bullish Continuation Inside AscendingIntel NASDAQ:INTC has broken above previous resistance and a descending trendline, confirming a bullish reversal.
Price is currently respecting an ascending channel and forming higher highs and higher lows. The breakout retest around $22.50 has held as new support.
If the current structure remains intact, price could continue toward the $26.00–$26.50 resistance zone. A breakout above this zone opens the door for a move toward $28+.
Key levels:
Support: $22.50 (previous resistance)
Resistance: $26.00–$26.50
Trend structure: Bullish channel
Volume supports the trend, and price is trading above both the 50 SMA and 200 SMA.
📌 Watching for a pullback and continuation move inside the channel.
This is not financial advice. Always do your own research.
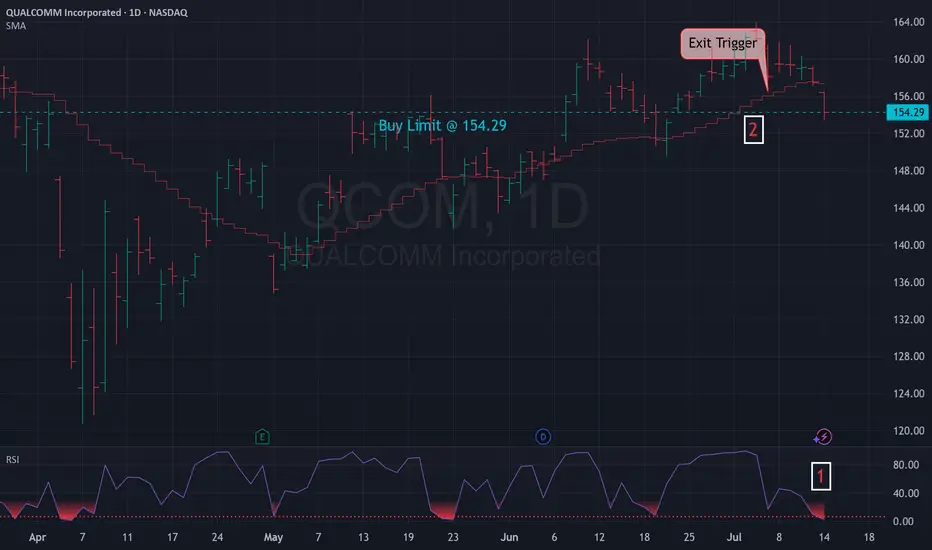
Mean Reversion Trade: QCOM1. RSI in oversold region
2. Price likely to rebound back the the mean
Trade Rules:
Entry Trigger - RSI has cross below oversold region, enter limit buy at close price
Exit Trigger - Close at market when close price cross above exit trigger (Red step line)
HOOD Weekly Call Option Setup – 07/14/2025 $106C | Exp. July 18
📈 HOOD Weekly Call Option Setup – 07/14/2025
$106C | Exp. July 18 | Breakout Watch Above $100 👀
⸻
🔥 BULLISH MOMENTUM BUILDING
🟢 HOOD is pushing hard into $100 resistance — price riding above 10/50/200 EMAs on all timeframes.
📊 RSI hot (65.6 on 5m / 71.6 daily), but not maxed out — short-term pullback possible, but trend still bullish.
💰 Volume + call flow favor more upside.
⸻
📰 Catalyst:
Positive crypto market sentiment = increased trading activity = good for HOOD’s core business.
VIX at 16.40 = risk-on environment = perfect for high-beta names like this one.
⸻
🎯 Trade Plan – High R/R Call Setup
Clean structure, riding sentiment — but be quick around $100.
{
"ticker": "HOOD",
"type": "CALL",
"strike": 106,
"exp": "2025-07-18",
"entry": 0.92,
"target": 1.38,
"stop": 0.46,
"size": 1,
"confidence": "70%",
"entry_timing": "market open"
}
🔹 Entry: $0.92
🎯 Target: $1.38 (+50%)
🛑 Stop: $0.46 (-50%)
📅 Expiry: 07/18/25
📈 Confidence: 70%
💼 Strategy: Naked Call
⸻
💬 Model Consensus:
“Moderately Bullish” — clean momentum + bullish call flow = good entry.
⚠️ Watch RSI + $100 resistance — quick rejection is possible.
⸻
📌 Why $106C?
🔸 OI building there → potential magnet
🔸 Cheaper than ATM but within reach
🔸 High gamma setup if we break $100 early
⸻
💡 Trade Smart:
🏃 Get in early → fade into strength
🧠 Position size accordingly → don’t get greedy
📢 Tag your trading buddy who’s still ignoring HOOD 😏
#HOOD #OptionsTrading #BreakoutSetup #CryptoMomentum #AITrading #CallOptions #FlowPlay #TradingView #0DTE #
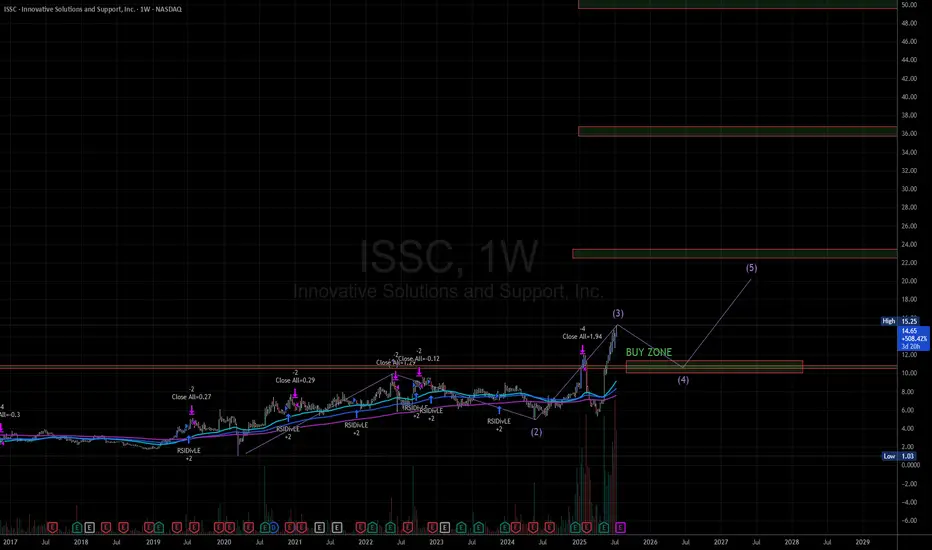
Waitimg for the 4th Wave at $10-11 RangeWaiting for price to pull back and stabilize at the 4th Wave $10-11 Range. Looking to jump in at that price range. Looking to sell at the 23, 35, 50 price ranges.
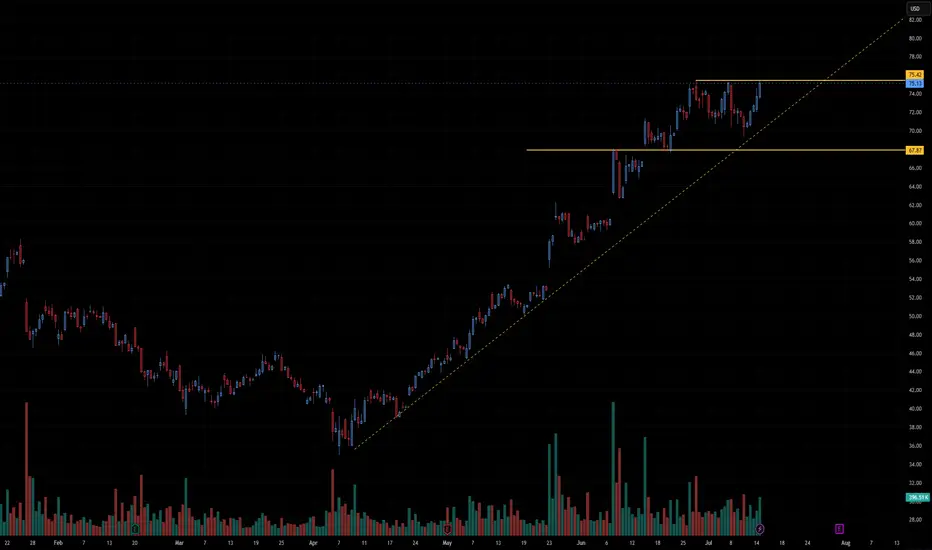
CVNA will falling rates save this darling?VNA (Carvana Co.) shows a strong bullish trend with a breakout setup forming. Here’s a detailed technical analysis:
📈 Trend Analysis: Strong Uptrend
CVNA has been in a clear uptrend, characterized by higher highs and higher lows since March.
The ascending yellow trendline confirms consistent buying interest with each pullback being bought.
This trendline is acting as dynamic support and continues to hold the structure of the uptrend intact.
📊 Consolidation Below Resistance
The stock is currently consolidating just below the horizontal resistance at $75.42.
Multiple candles are pressing against this level without significant rejection, which is a bullish sign of accumulation.
Consolidation under resistance, particularly in an uptrend, often leads to a bullish breakout.
🧱 Key Levels
Resistance: $75.42 – Price has tested this level multiple times, forming a potential bullish breakout level.
Support: $67.87 – A key horizontal level from a prior breakout area. Also roughly aligns with the ascending trendline, giving this support more significance.
🔊 Volume Analysis
Volume has been steady but slightly rising as price approaches the resistance.
Watch for a volume spike on the breakout above $75.42, which would add strong confirmation of buying interest and trigger potential upside follow-through.
📍 Potential Scenarios
✅ Bullish Breakout
A clean close above $75.42 could ignite a breakout move.
Potential target zones:
$80–82 short term, based on the height of the previous consolidation.
Higher if momentum builds, given the strength of the current trend.
⚠️ Bearish Pullback
If price fails to break out and drops below the trendline, it could trigger a short-term correction.
First support test would be $67.87; a break below this could shift sentiment bearish in the short term.
🧠 Summary
CVNA is showing classic bullish continuation signals: strong uptrend, consolidation below resistance, and rising support. This ascending triangle pattern often resolves to the upside. Traders should watch for a breakout above $75.42 with volume for a potential entry, while maintaining awareness of support at $67.87 for risk management.
CCJ stead as she goes but triple top failure ahead?Cameco Corp. (CCJ) shows a strong uptrend with a consolidation just below resistance, which is a bullish technical pattern. Let’s break it down:
🔍 Technical Analysis of CCJ
1. Trend Structure
Clear uptrend: The stock has been making a series of higher highs and higher lows since March.
Ascending trendline (yellow dashed line): Price continues to respect this trendline as dynamic support, indicating sustained buying momentum.
2. Resistance Zone
Horizontal resistance at ~$75.42: This level has been tested multiple times but not yet convincingly broken.
The recent candles are testing this level again, showing pressure building. This increases the probability of a breakout.
3. Support Zone
Horizontal support at ~$67.87: This was the breakout level from a prior consolidation in early June and has acted as support since then.
Also aligns with the ascending trendline, forming a rising base—a sign of strength.
4. Volume Analysis
Volume has been picking up slightly during the current approach to resistance, but a significant spike in volume on a breakout would add strong confirmation.
Notably, there was strong volume during previous rallies—momentum buyers may be waiting for a confirmed breakout before re-entering.
✅ Bullish Scenario
A daily close above $75.42, ideally on above-average volume, could trigger a breakout with a target toward $80–82 in the near term.
The steep angle of the ascending trendline supports a continued rally if broader market conditions are favorable.
⚠️ Bearish/Neutral Scenario
If price fails to break above $75.42 and drops below the ascending trendline, look for a retest of the $67.87 level.
A break below that support could open the door for a deeper pullback toward the mid $60s.
🧠 Summary
CCJ is in a bullish consolidation pattern with strong support from a rising trendline and a flat-top resistance at ~$75.42. The setup resembles a classic ascending triangle, a continuation pattern that often resolves with a breakout in the direction of the prevailing trend (up).
Watch closely for:
A breakout candle above $75.42 with strong volume
Potential pullbacks toward the trendline for entries if breakout fails temporarily
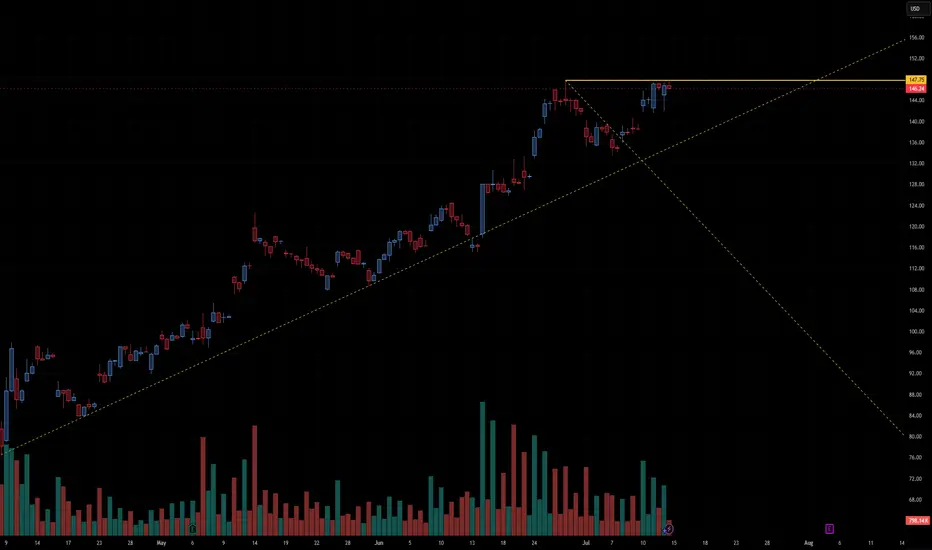
AMD preparing to break out or fail at resistance🔍 Chart Structure & Key Levels
Horizontal Resistance:
The stock is repeatedly testing the $147.75 level, which is acting as a horizontal resistance (shown in orange). Price has stalled here for several sessions, creating a tight range just below resistance—a common precursor to breakouts.
Ascending Trendline Support:
A long-term upward trendline (dashed yellow) supports the current move. Price has respected this line multiple times, showing a strong bullish structure over the past few months.
Volume Analysis:
Volume has decreased during the recent consolidation near the highs, which is typical before a breakout. However, we want to see a volume spike on a confirmed breakout above $147.75 to validate strength.
Symmetrical Triangle / Coil:
There's a tightening pattern forming between the rising trendline and the flat resistance, indicating price compression. This type of structure is often resolved with a large directional move.
✅ Bullish Scenario
A confirmed breakout above $147.75 with volume expansion could trigger a strong upward move.
Price could quickly target the psychological level near $150, and potentially beyond to $155+, based on the height of the prior impulse wave.
⚠️ Bearish Breakdown Scenario
If price fails to break above $147.75 and breaks the ascending trendline, a pullback to $140 or $135 becomes likely.
A breakdown would invalidate the current bullish structure and signal a potential short-term reversal.
🧠 Summary
This chart is in a bullish consolidation with a coiled setup just under major resistance. A breakout above $147.75 is the critical level to watch for upside continuation. Traders should monitor volume and candlestick confirmation before entering positions.
AAPL PREPARING FOR A LARGER MOVEAAPL clearly shows a descending channel pattern, marked by two parallel downward-sloping yellow trendlines. Within that broader structure, the price is currently consolidating in a narrow range between two horizontal yellow lines:
Resistance around $210.98
Support around $207.46
🔍 Current Technical Setup
Consolidation Range
AAPL is moving sideways in a tight range between $207.46 and $210.98. This narrow trading zone within a broader descending channel is typical of compression before a breakout.
Descending Channel Context
The channel suggests a longer-term downtrend bias, but the compression at these levels can lead to a breakout in either direction, especially when volume starts to increase.
Support Zone ($207.46)
This level has been tested and held, making it a key line to watch. A breakdown below this support would likely trigger a sharper selloff toward the lower channel boundary, near $203–$204.
Resistance Zone ($210.98)
This level lines up with the upper boundary of the current consolidation and the midline of the descending channel. A breakout above would invalidate the local downtrend and could send price to test the top of the channel (~$214+).
Volume Clues
Volume is relatively low during this sideways movement, which often precedes a high-volume breakout as indecision resolves.
📈 Scenarios to Watch
Bullish Breakout
Above $210.98 and the descending trendline.
Likely target: $214–$216
Confirmation: Volume spike + strong bullish candle
Bearish Breakdown
Below $207.46 support.
Target: $203 or lower, testing channel support.
Confirmation: Increasing red volume + bearish momentum
🧠 Summary
AAPL is in a compressed state, with a tight horizontal range forming inside a broader downward-sloping channel. This often sets the stage for a powerful directional move. Traders should closely monitor breaks of $210.98 or $207.46 to catch the next leg — either a reversal toward higher levels or continuation of the downtrend.

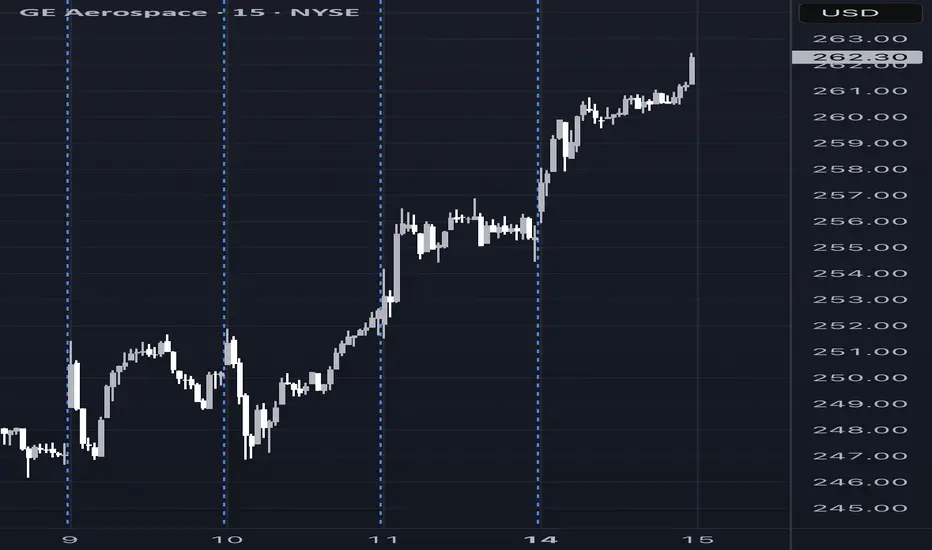
GE Weekly Options Trade Setup – 07/14/2025 $290C | Exp. July 18
📈 GE Weekly Options Trade Setup – 07/14/2025
$290C | Exp. July 18 | Bullish Catalyst In Play
⸻
🔥 BULLISH MOMENTUM CONFIRMED
✅ All 5 major AI models (Grok, Claude, Gemini, Llama, DeepSeek) agree:
GE just broke out — strong momentum, price above MAs, MACD bullish.
📰 Catalyst: Citigroup Upgrade 💥
Low implied volatility + analyst boost = ideal environment for calls.
⚠️ Caution: RSI is overbought, signaling possible short-term pullback. This is a fast trade, not a swing.
⸻
🎯 Trade Plan – High Conviction Setup
Entry at open, ride breakout continuation 🚀
{
"ticker": "GE",
"type": "CALL",
"strike": 290,
"exp": "2025-07-18",
"entry": 0.89,
"target": 1.78,
"stop": 0.45,
"size": 1,
"confidence": "70%",
"entry_timing": "market open"
}
🔹 Entry: $0.89
🎯 Target: $1.78 (+100%)
🛑 Stop: $0.45 (-50%)
📅 Expiry: 07/18/25
📈 Confidence: 70%
💼 Strategy: Naked Call
⸻
📌 Why $290C?
High strike = low cost, great R/R. High OI, and supported by breakout levels from DeepSeek & Grok models.
🧠 Model Sentiment:
“Moderately Bullish” – All point to upside, but suggest smart risk management due to hot RSI.
⸻
💡 Quick Notes
⚠️ Overbought ≠ reversal — just be quick.
📊 Citigroup news is driving flows — but don’t hold into chop.
💬 Tag someone who’s been sleeping on GE 👇
#GE #OptionsTrading #BreakoutPlay #CallOption #AITrading #WeeklySetup #FlowWatch #0DTE #tradingview
$HIVE / 4hAs depicted in the 4h-frame above, NASDAQ:HIVE may have developed a sequence of Minor degree waves upward >> 1, 2, and an impulse 3, which remains in progress, since April 9.
Wave Analysis >> After completion of the ongoing correction in wave iv(circled), an impulsive wave v(circled) of the Minor degree wave 3 might be to 80% extended towards the Fib-extension target >> 3.84.
#CryptoStocks #HIVE #BTCMining #Bitcoin #BTC
NASDAQ:HIVE CRYPTOCAP:BTC MARKETSCOM:BITCOIN

WULF / 3hNASDAQ:WULF
According to the bearish alternative in my weekly frame (not the chart below and not posted recently), the entire countertrend rally, which has developed in an ABC zigzag sequence as anticipated in the analysis which I posted on May 12, may have reached a very late stage where an adjusted expanding diagonal as the thorough Minor degree wave C remains at the start point of a final advance as its 5th subdivision. It will conclude the entire correction upward since April 9.
NASDAQ:WULF 's Bearish Alternative :
Wave Analysis >> As depicted on this 3h-frame above, the structure of the entire countertrend advance, which has developed since April 9, may be considered in a thorough ABC zigzag correction, in which Minor degree wave C should have diagonally reached its very late stage now. It would likely achieve its expansion target >> 5.55.
And it would be a 170% gain of a countertrend rally at the end!!
Now, 8.6% of the advance remains to complete a possible ending expanding diagonal upward as the Minor degree wave C.
Trend Analysis >> The countertrend upward as Intermediate degree wave (B) will probably change to decline in the same degree wave (C) very soon!! And it'll likely last until the end of the year.
#CryptoStocks #WULF #BTCMining #Bitcoin #BTC
NASDAQ:WULF CRYPTOCAP:BTC MARKETSCOM:BITCOIN

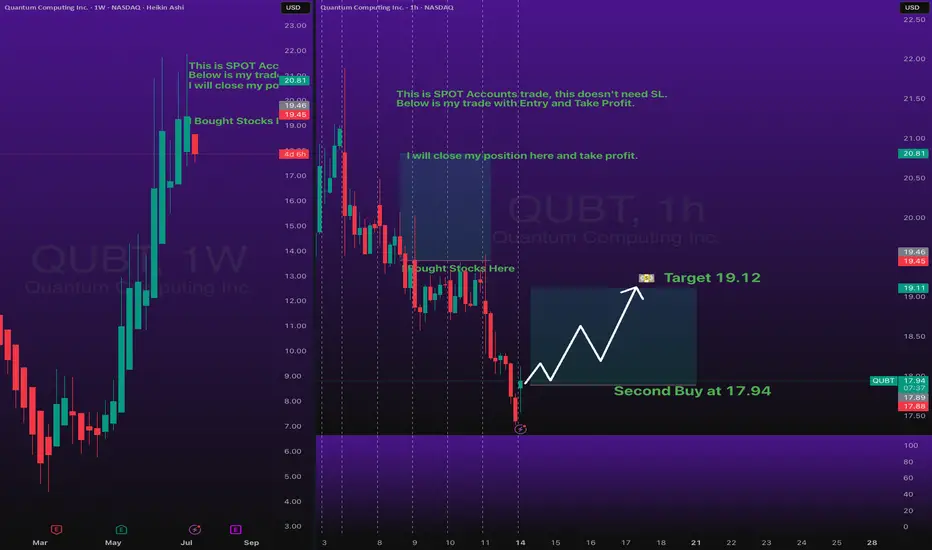
Stocks SPOT ACCOUNT: QUBT stocks buy trade with take profitStocks SPOT ACCOUNT: NASDAQ:QUBT stocks my buy trade with take profit.
This is my SPOT Accounts for Stocks Portfolio.
Trade shows my Buying and Take Profit Level.
Spot account doesn't need SL because its stocks buying account.
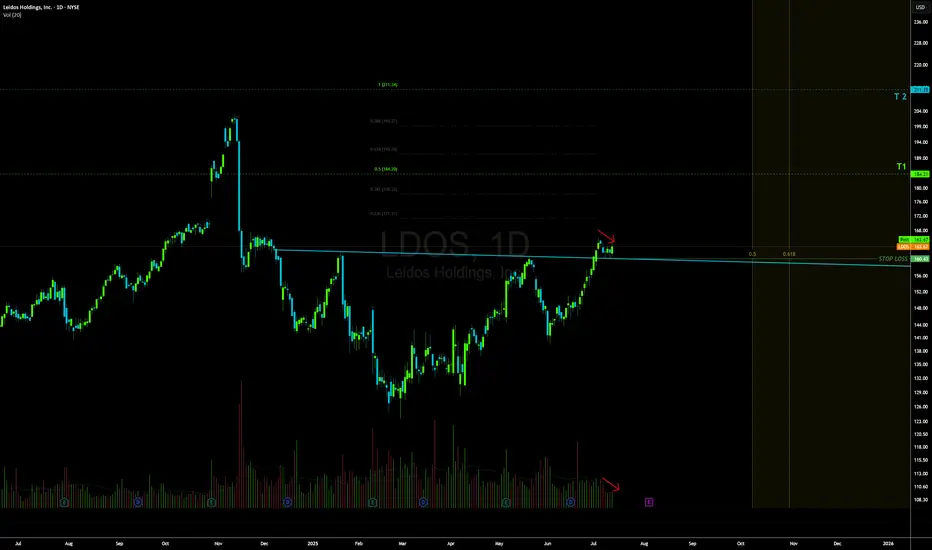
LDOS LONG🚀 NYSE:LDOS – Breakout Setup After Months of Accumulation
NYSE:LDOS is showing a high-conviction breakout setup after six months of tight accumulation. Here's what I'm seeing:
🔹 Flagging on the 8EMA with low volume – classic bullish continuation
🔹 Clean structure with higher lows and controlled pullbacks
🔹 Volume drying up during the recent consolidation = potential energy building
🔹 Breakout in progress with RSI staying strong but not overbought
🔹 Accumulation range forming a solid launchpad
📈 With earnings due Aug 5 (BMO) and strong fundamental backing, I expect volume to come in soon and fuel the next leg higher.
🟢 Targets:
$184 short-term
$211 by year-end
🔴 Stop:
$159 – below the accumulation base and prior support zone
Why I Like It:
✅ EPS growth +325% YoY
✅ Forward P/E only 14.1
✅ Strong ROE (31%) + institutional accumulation
✅ Momentum without overextension
✅ Positioned in a defensive-growth sector with macro tailwinds (defense, cybersecurity, AI)
📊 Looks like smart money has been accumulating – and it's almost time to move.
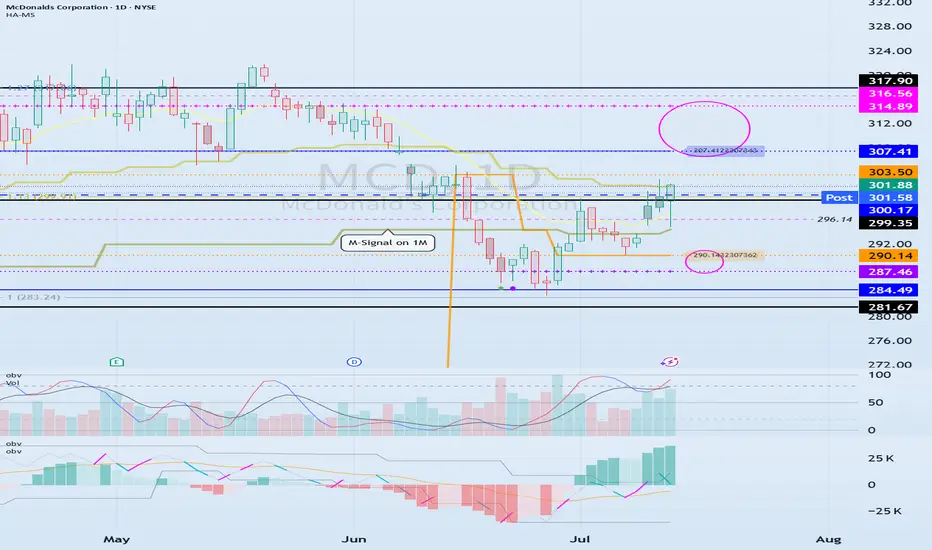
The key is whether it can be supported and rise near 300.17
Hello, traders.
If you "Follow", you can always get new information quickly.
Have a nice day today.
-------------------------------------
(MCD 1D chart)
Before following the basic trading strategy, the first thing to check is whether the current price is above or below the M-Signal indicator on the 1M chart.
If the price is below the M-Signal indicator on the 1M chart, there is a possibility that it will turn into a medium- to long-term downtrend.
Therefore, if possible, it is recommended to trade stocks whose prices are above the M-Signal indicator on the 1M chart.
If the price is below the M-Signal indicator on the 1M chart, you should respond quickly and briefly using the short-term trading (day trading) method.
-
The support and resistance zones can be seen as the 287.46-290.14 zone and the 307.41-314.89 zone.
The 287.46-290.14 zone is the DOM(-60) ~ HA-Low zone, and the 307.41-314.89 zone is the HA-High ~ DOM(60) zone.
These two zones are likely to form a trend depending on how they break through, so they can be seen as support and resistance zones.
-
The 300.17-316.56 zone is the HA-High ~ DOM(60) zone on the 1W chart.
Therefore, we need to check whether it can receive support and rise in the 300.17-316.56 zone.
Therefore, if it falls near the 307.41-314.89 range, you should check for support near 300.17.
-
If it rises above the HA-High ~ DOM(60) range, it is likely to show a step-up trend, and if it falls in the DOM(-60) ~ HA-Low range, it is likely to show a step-down trend.
-
Thank you for reading to the end.
I hope you have a successful transaction.
--------------------------------------------------
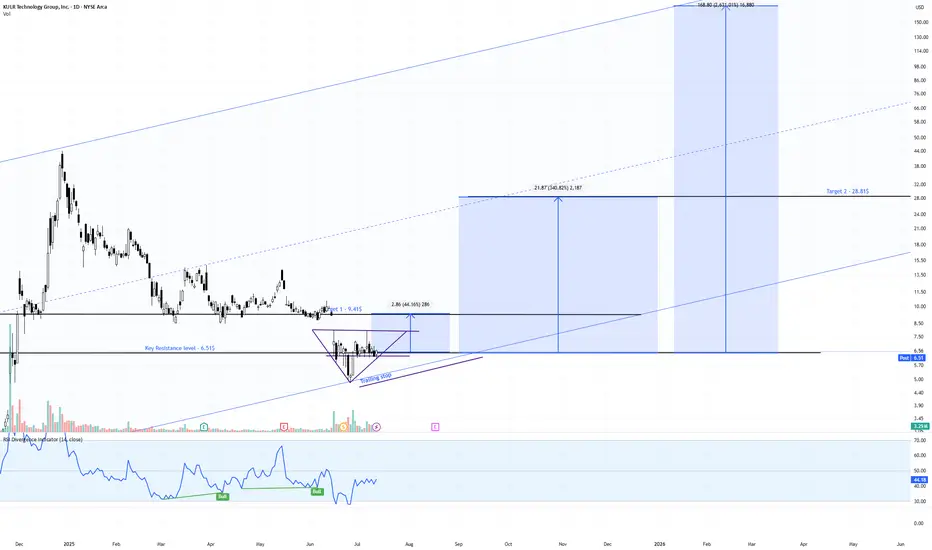
KULR Daily Watch – Triangle Squeeze Loading📍 Price Action:
Sitting tight at $6.50, coiling inside a clean symmetrical triangle. Last fake-out under support didn’t confirm → bulls still holding the line.
📊 Pattern Probabilities (Bulkowski):
Symmetrical triangles break ~54–60% in trend direction. Post-breakout moves hit ~60–75% of measured height → decent odds for upside here.
✅ Volume contracting = typical pre-breakout behavior
✅ RSI divergence still bullish
✅ Channel since 2023 intact, macro structure supports trend-following
🎯 Targets & RR Setup:
Trigger zone: $7.20–$7.50
Target 1: $9.45 (+31% | RR ~2.5:1)
Target 2: $28.81 (+298% | RR ~12:1)
Target 3 (channel top): $168.12 (+2,368% | moonshot 🌙)
⏳ Next Step:
Break over $7.50 = green light for Target 1. We’re trailing stops below the rising trendline to lock in gains without killing the move early.
#KULR #TrianglePattern #BreakoutWatch #TargetTraders #StockMarket
MRK Wave Analysis – 14 July 2025- MRK reversed from the support zone
- Likely to rise to resistance level 85.00
MRK recently reversed up from the support zone surrounding the long-term support level 73.45 (which has been reversing the price from the start of 2020, as can be seen from the weekly MRK chart below).
The upward reversal from the support level 73.45 started the active long-term impulse wave III.
MRK can be expected to rise to the next resistance level 85.00 (former top of wave (4) from May) – from where the price is likely to correct down.

PALANTIR REMAINS YOUR TRADING GOAL, DOUBLING IN PRICE IN 2025In the Faraway Kingdom... In the Thirtieth Realm....
Somewhere in another Galaxy.. in late December, 2024 (yet before The Second Coming of Trump), @TradingView asked at it awesome Giveaway: Happy Holidays & Merry Christmas .
1️⃣ What was your best trade this year?
2️⃣ What is your trading goal for 2025?
Here's what we answered:
1️⃣ What was your best trade this year?
- Surely Palantir NASDAQ:PLTR 💖
I followed Palantir all the year since January, 2024, from $16 per share, watch here .
Current result is 5X, to $80 per share.
Also I added more Palantir after SP500 Index inclusion in September 2024 watch here .
Current result is 2.6X, from $30 to $80 per share.
2️⃣ What is your trading goal for 2025?
- Once again, surely Palantir NASDAQ:PLTR 💖
It's gone 7 months or so... (Wow... 7 months really? 😸😸😸)
Let see what's happened next at the main graph of Palantir stock, to LEARN WHY PALANTIR REMAINS THE TRADING GOAL, DOUBLING IN PRICE IN 2025...
Palantir stock remains an attractive trading goal for several compelling reasons rooted in its strong market performance, innovative technology, and robust growth prospects, particularly in the artificial intelligence (AI) sector.
1. Exceptional Stock Performance and Momentum.
Palantir Technologies has been one of the best-performing stocks in 2025, surging over 80% in the first half of the year alone, vastly outperforming the S&P 500’s modest 5.5% gain. The stock recently hit all-time highs around $149, reflecting a nearly 400% increase year-over-year, underscoring its strong momentum and investor enthusiasm. This surge positions Palantir as a top AI stock to watch, attracting both retail and institutional investors, including conservative entities like the Czech National Bank.
2. Leadership in AI and Data Analytics.
Palantir is not just a data analytics company; it has transformed into a major AI software provider with its Artificial Intelligence Platform (AIP). This platform extends beyond government contracts into commercial sectors such as healthcare, energy, and automotive, fueling significant revenue growth. The company reported a 39% revenue increase to $883.9 million in Q1 2025, driven largely by AI adoption. Its AI platform is gaining traction globally, with many companies rapidly adopting Palantir’s software through short training bootcamps, demonstrating scalable and fast integration.
3. Strong Government and Commercial Contracts.
Palantir’s roots in government intelligence and defense continue to be a significant revenue driver. The U.S. government division alone generated $373 million in Q1 2025, with overall government revenue up 45% year-over-year. Strategic partnerships, such as with Accenture to streamline federal operations and projects like the U.S. Navy’s ‘Warp Speed for Warships,’ highlight Palantir’s expanding footprint in critical government sectors. Simultaneously, the commercial segment is booming, with revenue soaring 71% to $255 million in Q1 and projected to reach $1.178 billion in 2025.
4. Financial Health and Growth Outlook.
Palantir’s financials are strengthening, with no debt and adjusted free cash flow more than doubling to $370.4 million in the recent quarter. Analysts forecast the company’s revenue to exceed $3.5 billion in 2025, up from $2.23 billion the previous year, and project potential revenue of $7 billion by 2028. Operating margins are improving, with a recent quarter reporting a 26% margin, the highest in company history. This solid financial foundation supports further investment in AI innovation and market expansion.
5. Market Position and Competitive Edge.
While Palantir competes with tech giants like Microsoft, Amazon, and Google in the AI and data analytics space, it has carved out a unique niche with its specialized government contracts and AI-driven software solutions. Its ability to integrate complex datasets for real-world operational use distinguishes it from competitors, fostering a loyal investor base and a "cult-like" following among retail investors.
6. High Valuation Reflects Growth Expectations.
Despite a high price-to-earnings ratio (PE around 621), reflecting elevated expectations, many analysts remain optimistic about Palantir’s long-term potential due to its rapid growth and expanding AI capabilities. The company’s market capitalization has soared above $330 billion, surpassing many established corporations, signaling strong market confidence.
7. Palantir stock is a compelling trading goal because it combines robust growth, cutting-edge AI technology, strong government and commercial contracts, and solid financial health.
8. In conclusion, Palantir remarkable stock performance and strategic positioning in the booming AI sector make it a promising investment for traders seeking exposure to transformative technology with significant upside potential.
9. ...and yet, Palantir performance since inception (It ultimately went public on the New York Stock Exchange through a direct public offering on September 30, 2020) is better, rather then Bitcoin.
--
Best wishes,
@PandorraResearch Team 😎

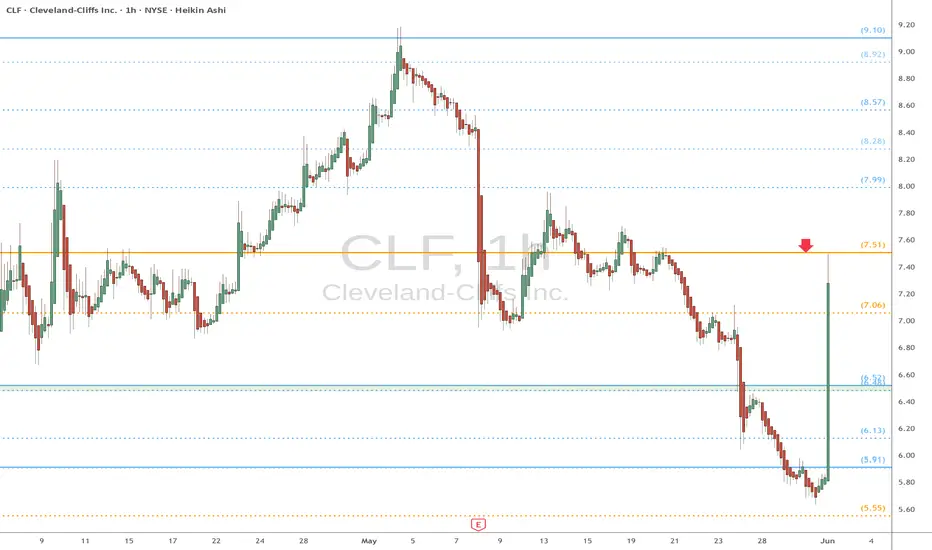
CLF heads up at $7.51: Golden Genesis fib may give a Dip buyCLF shot up strong after Trump increased tariffs on Steel.
It has just hit a Golden Genesis fib that may give us a dip.
Looking for a dip to $7.06 fib or a Break-n-Retest of 7.51
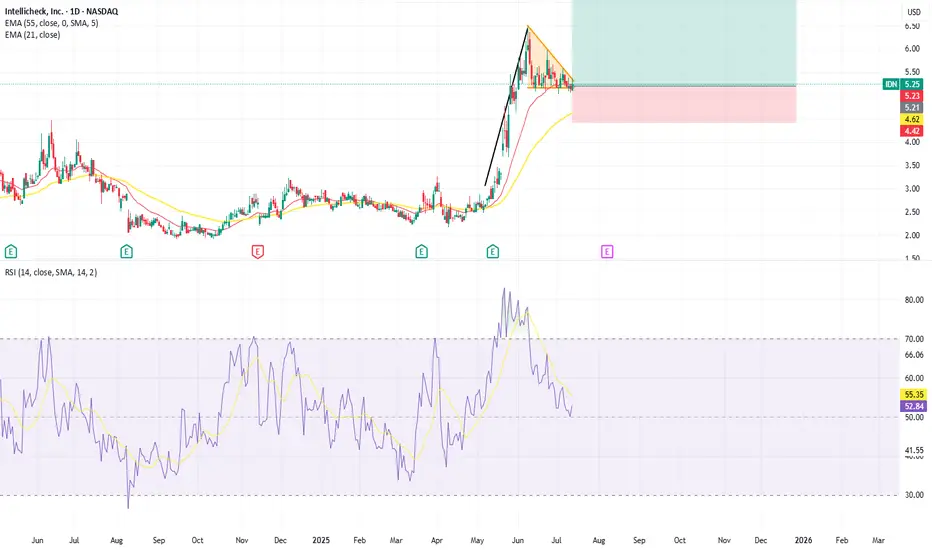
IDN Bullish Pennant FlagNASDAQ:IDN has had a huge run up in the last two month and a Bullish Pennant flag is starting to form with support at 5.16. Below this we saw some support at 4.80. Using a Stop Loss just below this level and a target set at the next resistance level established in 2022 yields a R:R of 1:3.5.
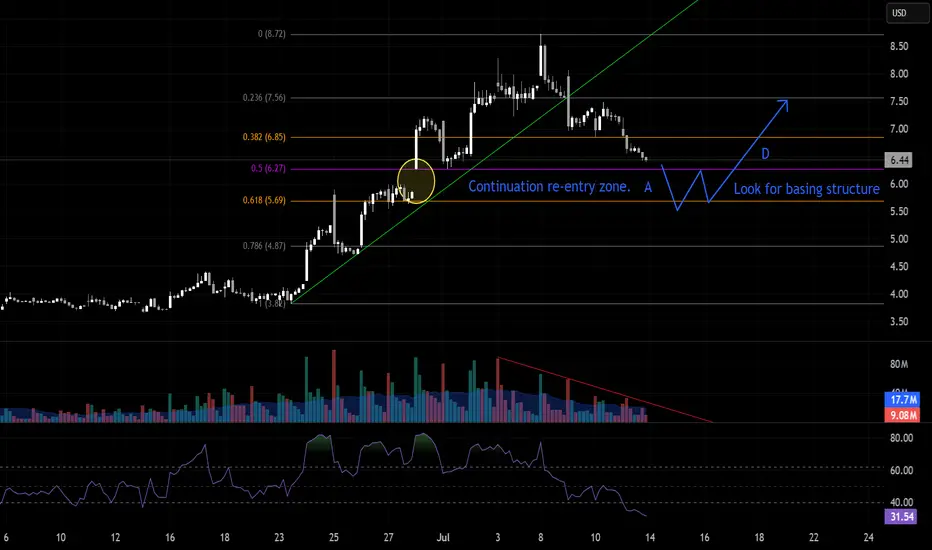
Mapping Out a Probable Basing Structure for ContinuationI’m tracking price as it retraces into the 0.5–0.618 Fibonacci zone, where I expect a potential base to form. With declining volume confirming the pullback is losing momentum, I’ll look for a clear basing pattern or double-bottom on lower timeframes before entering long. If confirmed, the plan is to position for a continuation move back toward previous highs.