Gilead tie-up ,Big Pharma confidence,massive upside if trials OK
🧪 Pipeline Progress (as of latest update):
NX-2127 & NX-5948 in Phase 1 🔬
NX-1607: Promising early clinical data in solid tumors
Multiple preclinical programs in immuno-oncology and autoimmune space
Down ~80% from highs (2021 biotech bubble burst 😬)
Consolidating near lows — potential bottom fishing zone 🐟
High short interest = possible squeeze setup 🔥
Speculative high-reward biotech. Great long-term potential if pipeline delivers. Suitable for risk-tolerant investors only. Not for the faint-hearted 🧠⚡

DKS watch $170-172: Major Support that could mark a BottomDKS earnings report apparently disappointed.
Fell into a major support zone $170.01-172.12
Looking for a bounce to long or break to short.
.
Last Plot with a Perfect Road Map
=================================================

Trade Setup: LONG on TSM !📈 (Taiwan Semiconductor)
🕰️ Timeframe: 30-minute chart
🔍 Pattern: Ascending triangle breakout
📉 Previous Trend: Recovery after drop
🔁 Setup: Bullish continuation with breakout confirmation
🧩 Technical Breakdown:
Support Zone:
~$242.50 (yellow horizontal support)
Uptrend line holding as dynamic support (pink diagonal)
Entry Zone:
Around $242.75, just above triangle breakout and support retest
Resistance / Target Levels:
TP1: $244.07 (red zone — minor supply)
TP2: $245.43 (green zone — prior high, resistance zone)
Stop Loss:
Below $241.80 or just under triangle trendline (~$241.25)
Risk-Reward Estimate:
Approximately 1:1.5 to 1:2 based on $1.5 risk and $3 reward potential
⚠️ What to Watch:
Volume confirmation during breakout or retest
Holding above yellow support zone and triangle trendline
Potential fake-out risk near $244 zone if volume fades
✅ Summary:
TSM is setting up a bullish continuation after reclaiming key levels and forming a tight ascending triangle. A clean breakout above $243 may trigger a move toward $245+ if buyers step in.

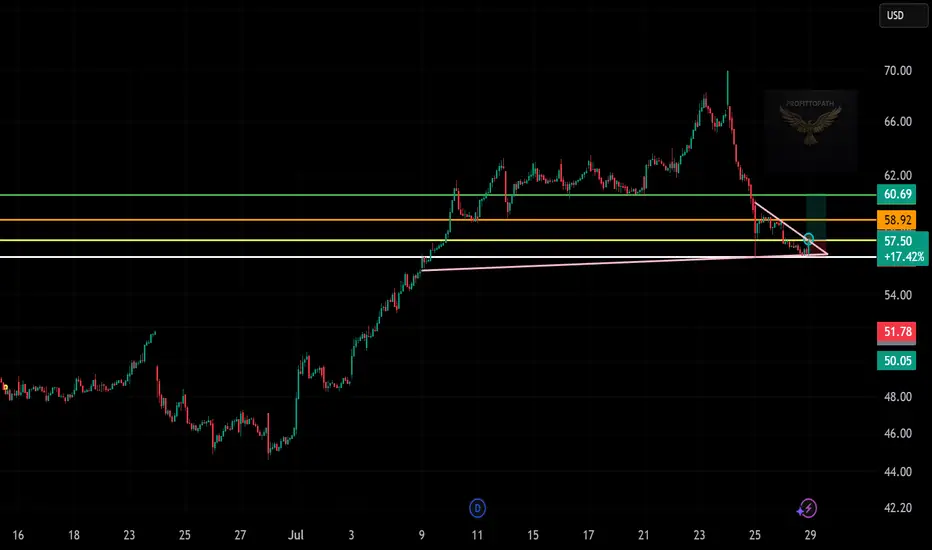
Trade Setup: LONG on AAP!📊
🕰️ Timeframe: 30-minute chart
🔍 Pattern: Falling wedge breakout
📉 Previous Trend: Sharp sell-off
🔁 Setup: Reversal from demand zone with breakout confirmation
🧩 Technical Breakdown:
Support Zone:
Around $57.00 (highlighted with pink & white lines)
Retesting prior breakout + holding demand zone
Resistance / Target Zones:
TP1: $58.92 (orange line – minor resistance)
TP2: $60.69 (green line – major resistance)
Entry:
Ideal near $57.00–$57.50, post-breakout candle (as seen on chart with blue circle)
Stop Loss:
Below recent low: around $56.00 (under pink trendline and horizontal support)
Risk-Reward Ratio:
~1:2+ depending on stop placement and exit at TP2
⚠️ What to Watch:
Volume confirmation on breakout (not shown in image but crucial)
Price retesting wedge breakout and holding above $57.00
Market sentiment and overall sector performance
✅ Summary:
This is a bullish reversal trade off a key support zone with a clean breakout from a falling wedge. Holding above $57 confirms buyers are stepping in. Room to run up to $60.69 if momentum builds.
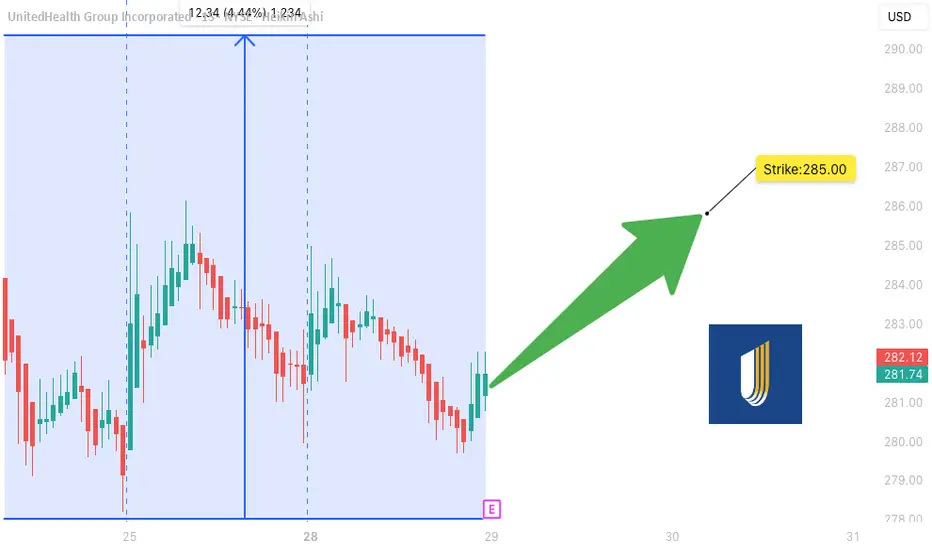
UNH Earnings Lotto Setup** (2025-07-28)
📊 **UNH Earnings Lotto Setup** (2025-07-28)
🎯 **Targeting a 2x return on post-earnings upside move**
---
### 💡 Trade Thesis:
**UnitedHealth (UNH)** is primed for a potential bounce on earnings:
* ✅ **Revenue Growth**: +9.8% YoY
* 🔥 **EPS Beat Rate**: 88% over last 8 quarters
* ⚠️ Margin compression risk from increased utilization
* 🧠 **Analyst Upgrades** trending positive
* 📉 RSI = **30.06** → Oversold territory
---
### 🔎 Options Flow & Technicals
* 🧲 Max Pain: **\$290**
* 🟢 Bullish call OI stacking at **\$285**
* ⚖️ IV Rank: **0.75** → Still has juice
* 🔻 Trading below 20D/50D MAs → Room for reversal
---
### 💰 Trade Setup
```json
{
"Instrument": "UNH",
"Direction": "Call (Long)",
"Strike": "$285",
"Entry Price": "$10.30",
"Profit Target": "$20.60 (2x)",
"Stop Loss": "$5.15 (50%)",
"Size": "1 contract",
"Expiry": "2025-08-01",
"Entry Timing": "Pre-Earnings Close (July 28)",
"Earnings Date": "2025-07-29 BMO",
"Expected Move": "±5%",
"Confidence": "70%"
}
```
---
### ⚖️ Risk/Reward
* Max Risk: 💸 \$1,030
* Max Gain: 🚀 \$1,030
* R/R Ratio: **1:2**
* Lotto-style with tight SL post-ER
---
### 🧭 Execution Plan
* 📅 Buy before close on **July 28**
* ⏰ Close same-day post ER **if target or SL hits**
* ❌ Exit manually if theta crush hits hard
---
### 🗣️ Final Note:
> “Oversold + Strong fundamentals + Positive consensus = Earnings bounce in the making.”
---
📌 Tag your UNH trades
💬 Drop your lotto setups
❤️ Like & repost if you're playing UNH this week!
\#UNH #EarningsPlay #OptionsTrading #TradingView #UNHEarnings #LottoTrade #CallOptions #HealthcareStocks #SwingTrade #RSI #IVRank #MaxPain
TLRY Earnings Play: Lotto-Style PUT Setup
📉 **TLRY Earnings Play: Lotto-Style PUT Setup**
*Tilray Brands (TLRY) - Earnings Due July 30 (AMC)*
🔻High risk. High reward. Possibly… nothing. But here's the setup:
---
### 🔬 Fundamental Breakdown:
* 💸 **TTM Revenue Growth**: -1.4% (🚩 declining)
* 📉 **Profit Margin**: -114.4%
* 🧾 **Operating Margin**: -16.8%
* 🧠 **EPS Surprise (avg 8Q)**: **-89.4%**, with only **12% beat rate**
* 🧯 **Sector Risk**: Cannabis = Over-regulated + Overcrowded
🧮 **Fundamental Score**: 2/10 → Broken business model.
---
### 📊 Technicals:
* 🔺 Above 20D MA (\$0.61) and 50D MA (\$0.49)
* 🔻 Well below 200D MA (\$0.91)
* 📉 Volume 0.72x = Weak institutional interest
* 📏 RSI: 57.69 (neutral drift)
**Technical Score**: 4/10 → Weak drift, low conviction.
---
### ⚠️ No Options Flow. No Big Bets Seen.
(But that’s exactly what makes this a clean lotto...)
---
## 🎯 Lotto Trade Idea:
```json
{
"Type": "PUT",
"Strike": "$0.70",
"Expiry": "Aug 1, 2025",
"Entry": "$0.10",
"Profit Target": "$0.50",
"Stop Loss": "$0.035",
"Confidence": "30%",
"Size": "2% portfolio max",
"Timing": "Pre-earnings close"
}
```
---
### 🧠 Strategy:
This is not a trade based on strength. It’s based on **TLRY’s consistent failure to deliver** — and if it disappoints again, we ride the downside. If not? Risk tightly capped.
---
⚖️ **Conviction**: 35%
💀 **Risk**: Total loss possible
🚀 **Reward**: 400%+ possible
---
📝 *Not financial advice — just one degenerate’s earnings notebook.*
💬 Drop your TLRY lotto plans below👇

CLS Earnings Play - Bullish Setup (07/28)
📈 **CLS Earnings Play - Bullish Setup (07/28)** 💥
💡 *Earnings Confidence: 75% | Sector: Tech/AI Hardware*
🚀 **THESIS**:
* 🔋 19.9% TTM revenue growth
* ✅ 8-quarter beat streak (avg. +11.5%)
* 📈 RSI > 50D/200D MA → Strong momentum
* 🧠 Sector tailwinds from AI/data infra
* 💬 Analysts lagging price → potential upgrades
📊 **OPTIONS FLOW**:
* 🟢 Calls piling at \$175 (institutions leaning bullish)
* 🛑 Some downside puts at \$170 (hedging only)
* 🧮 IV Rank: 0.65 | Expected Move: ±\$11
🔥 **TRADE PLAN**
> 🎯 **Buy CLS \$175 Call (08/01 Exp)**
> 💵 **Entry**: \$8.80
> 📈 **Profit Target**: \$26.40 (+200%)
> 🛑 **Stop Loss**: \$4.40
> ⏰ **Entry Timing**: *Just before earnings close* (07/30 AMC)
> 💼 **Size**: 2% of portfolio
📉 **Risk**: Moderate IV, downside if earnings miss.
📊 **Reward**: Strong beat history + AI trend = possible upside surprise.
🔔 **Watchlist it now. Execute near close 07/30.**

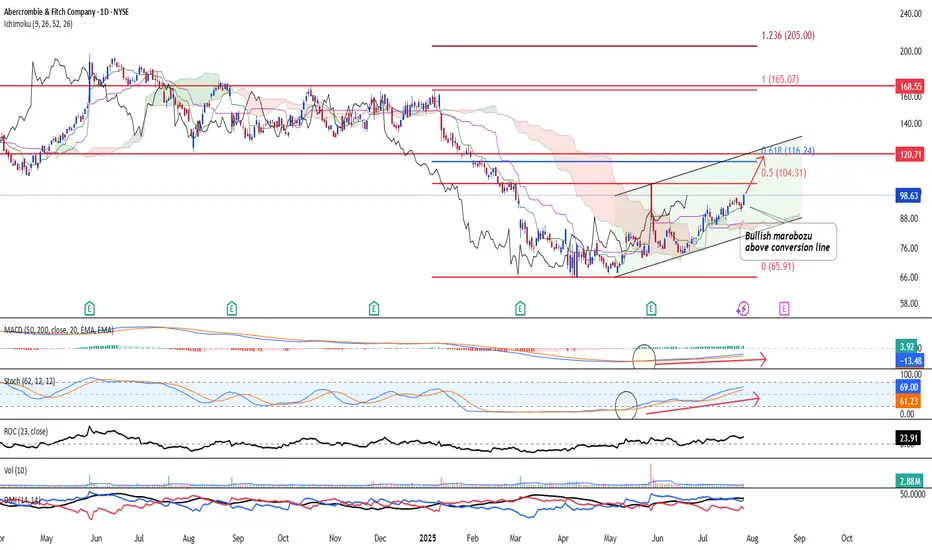
ANF - Short term upside NYSE:ANF is looking at a short term upside after the large bearish candle seen rejecting at 50% Fib retracement level fails to create a new low below 76 psychological level.
Currently, ANF is on the early uptrend and ichimoku shows a relative bullish signal after a bullish marobozu was seen closing above the 9 period conversion line.
Short term target could see 121.01, which is the 61.8% retracement level.
Long-term MACD histogram is positive and signal line is seen rising steadily after bottoming out
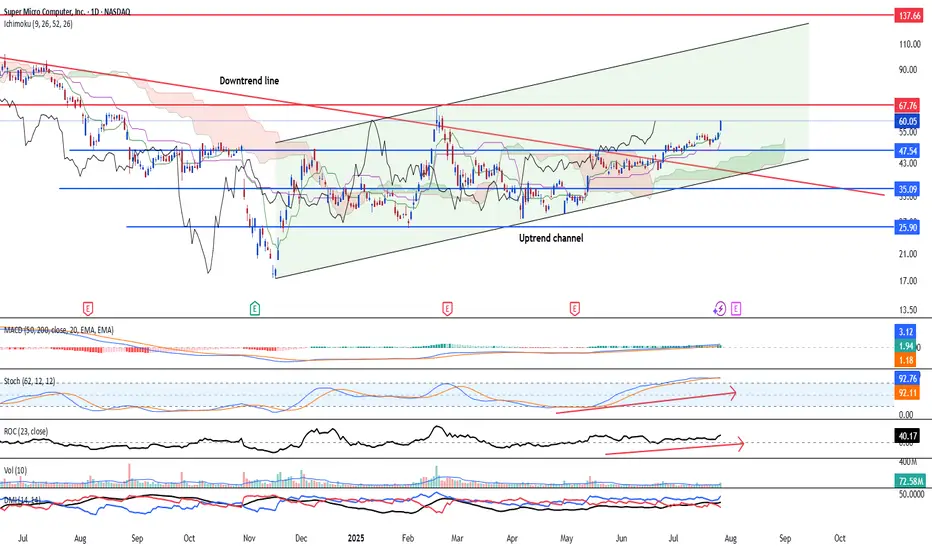
SMCI - Uptrend resumingNASDAQ:SMCI is looking at a return of the uptrend after breaking above its corrective downtrend line and buying pressure is seen resuming. Overall major trend is on the upside and strong.
Momentum:
Long-term MACD: histogram is positive and signal line is rising steadily
Stochastic Oscillator: Nearing overbought zone, but momentum remain healthy. As long as correction (if any) is not strong (drop cannot be more than 7% within a week).
Volume is healthy
Buy spot at 60.05 or buy upon correction at 43.27.
35.09 is the major support.
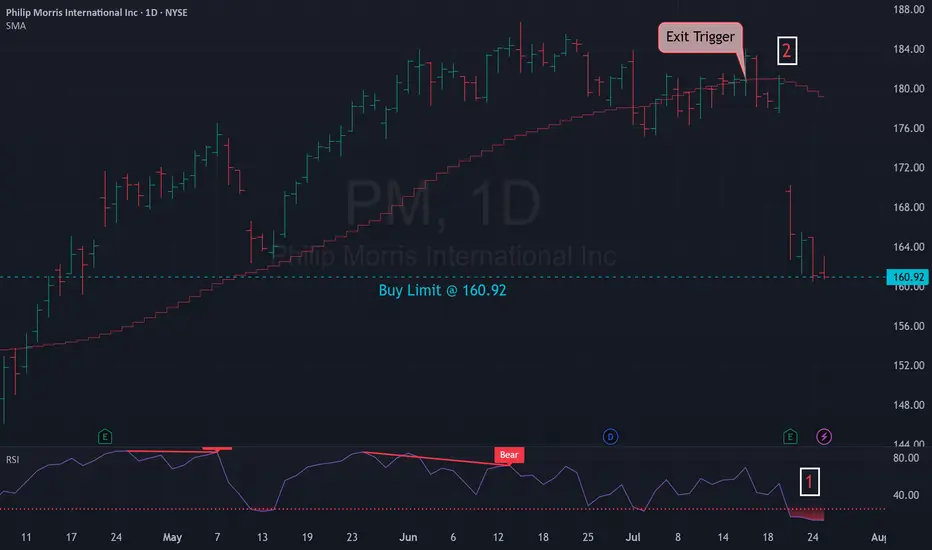
Mean Reversion Trade: PM1. RSI in oversold region
2. Price likely to rebound back the the mean
Trade Rules:
Entry Trigger - RSI has cross below oversold region, enter limit buy at close price
Exit Trigger - Close at market when close price cross above exit trigger (Red step line)
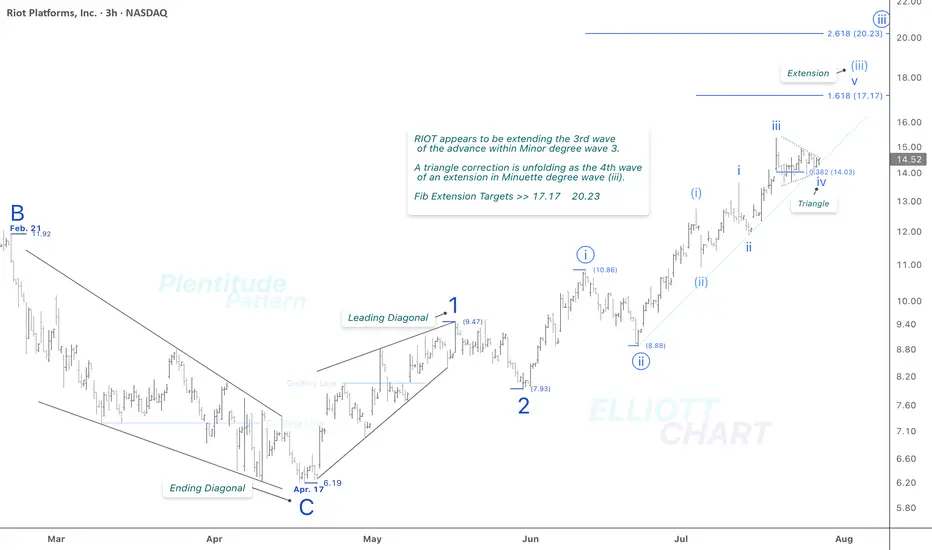
RIOT / 3hThere is no specific change in NASDAQ:RIOT 's previous analysis. As depicted on the 3h frame above, it appears to be extending the third wave of an impulsive advance within Minor degree wave 3. As anticipated, a triangle correction has emerged as the fourth wave within the ongoing extension of the Minuette wave (iii).
The Fibonacci extension levels of 17.17 and 20.23 remain valid and continue to align with the current wave structure.
>>> In this timeframe, I'm analyzing the initial rising tide within the ongoing Intermediate degree wave (1), where a nested series of waves have quite well revealed: 1, 2 → i (circled), ii (circled) → (i), (ii) → i, ii. The extreme high of this impulsive sequence lies beyond the visible range of the current chart.
NASDAQ:RIOT CRYPTOCAP:BTC BITSTAMP:BTCUSD MARKETSCOM:BITCOIN
#CryptoStocks #RIOT #BTCMining #Bitcoin #BTC
ETOR: Buying entry zoneETOR: Buying entry zone
.
Less supply volume at the bottom, successful shakeout and backtest.
Wait for a next move up ahead!
.
US STOCKS- WALL STREET DREAM- LET'S THE MARKET SPEAK!

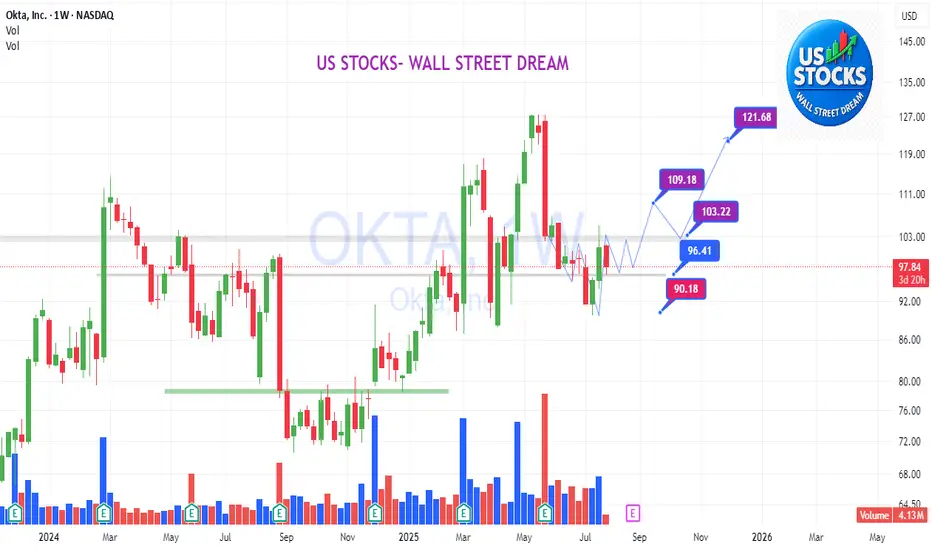
OKTA: swinging on accumulation range, shakeout confirmationOKTA:
.
Swinging on accumulation range, shakeout confirmation.
Inversed HnS pattern is being formed and confirmed.
Wait for next swing movements on right shoulder, before a jump.
.
US STOCKS- WALL STREET DREAM- LET'S THE MARKET SPEAK!
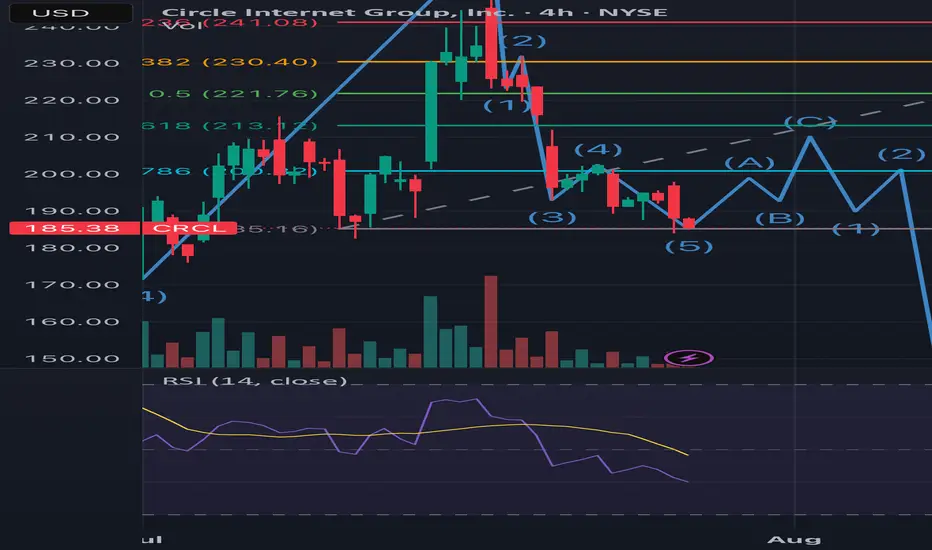
What goes around comes full CRCLFor the record, I bought in at ~$220 and looking to exit to ethical reasons. I believe that this stock will reach over $400USD for the end of the year but with every l opportunity left off for a greater cause, there will always be a greater reward.
1. Notice the end of the first 5 wave Elliot Impulse coincides with the passing of the GENIUS bill. Wave 3 peak was the ATH and wave 5 was the Friday peak of around $262.
2. We’ve entered the correction where sellers are looking to close from the hype
Wave 1 of the correction was the sell off from the wave 5 peak.
From the chart you can see the 3 wave correction is beginning with wave 1 of the 3 coming to an end.
Good news if you want to swing it to 213, this would be a good entry. Bad news if you want ito t hold it for ATH as it means you’d have to bear the third wave of the correction phase (gap fill ~$216), from there I’m expecting the huge sell off post earnings and FED expectations.
However, after retracing a new cycle will emerge led by major catalysts like the CLARITY Bill, CIRCLE’s bank charter application, USDT diminishing presence in the US and the adoption of USDC even possibly making it the standard stablecoin for all US crypto activity, DE-Fi growth and tradfi participation and growth in their MMF and remittance segments. This will kick start a new run where the highs of $400 will be achieved.
So target next high (earnings time) is $213. I assume price will not go below this region. But a recommended sell until q4
CYBN clearly the sector laggardCYBN is trading very differently from the rest of the sector which as significant bullish momentum which CYBN is the same price it was 7 weeks ago
I post regular analysis of the psychedelics sector, please like and follow to make sure you don't miss my next update!
Support: 7.74, 7.67, 7.55
Resistance: 7.99, 8.07, 8.18

CMPS potential daily bullflag setting upCMPS very healthy sideways consolidation after 100% bounce from the lows. 4hr downtrend is our guide and lower lows aren't seeing much followthrough, giving clues there may be a daily bullflag pattern shaping up. EARNINGS THIS WEEK!
I post regular analysis of the psychedelics sector, please like and follow to make sure you don't miss my next update!
Support: 4.25, 4.09, 3.83
Resistance: 4.41, 4.53, 4.68

MNMD healthy sideways consolidationNASDAQ:MNMD very healthy sideways consolidation after a 54% surge over the last 4 weeks. 4hr downtrend is our guide and lower lows aren't seeing much followthrough, giving clues there may be a daily bullflag pattern shaping up. EARNINGS THIS WEEK!
Support: 9.53, 9.37
Resistance: 9.79, 9.82, 10.09
I post regular analysis of the psychedelics sector, please like and follow to make sure you don't miss my next update!

ATAI bulls buy the dip on increasing bull volumeClose above daily EMA12, bulls aggressively bought the top above $3, the same price the sellers were stepping in over the last two weeks, speaking to demand outweighing supply at the present time. Bounce continuation is key into tomorrow as bulls want to create enough space to form a higher low above today's low 3.08 which is our most important short term support.
Support: 3.25, 3.20, 3.10, 3.08, 3.06
Resistance: 3.37, 3.48, 3.72, 4.00

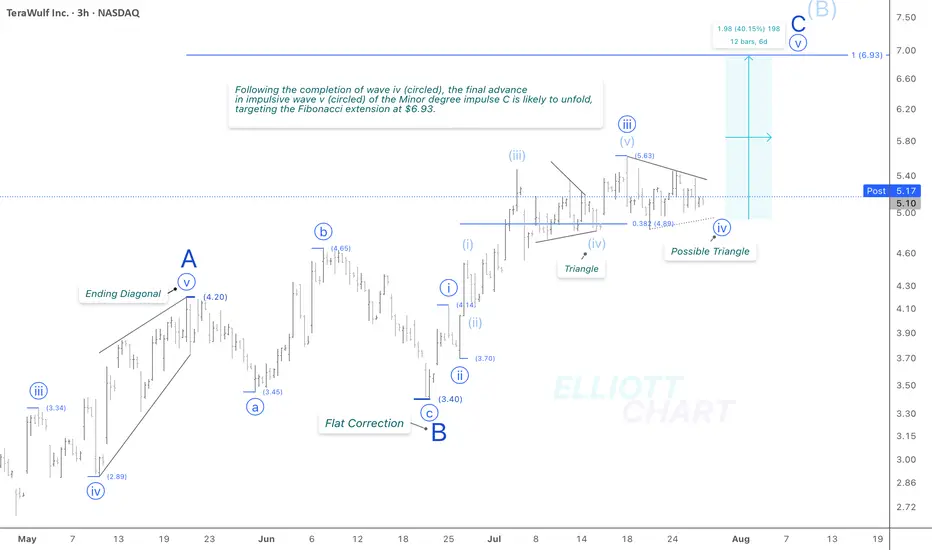
WULF / 3hNASDAQ:WULF traded sideways today, as expected, with no significant change to the broader outlook. The ongoing consolidation continues to support the current wave structure—specifically, a developing triangle in wave iv (circled), which may be forming ahead of the anticipated final advance in wave v (circled).
The Fibonacci extension target >> 6.93 remains valid.
Trend Analysis >> Upon completion of Minor degree wave C, the countertrend advance of Intermediate degree wave (B), which has been unfolding since April 9, is likely to give way to a decline in wave (C) of the same degree. This downtrend might begin in the coming days and potentially extend through the end of the year!!
NASDAQ:WULF CRYPTOCAP:BTC BITSTAMP:BTCUSD MARKETSCOM:BITCOIN
#CryptoStocks #WULF #BTCMining #Bitcoin #BTC
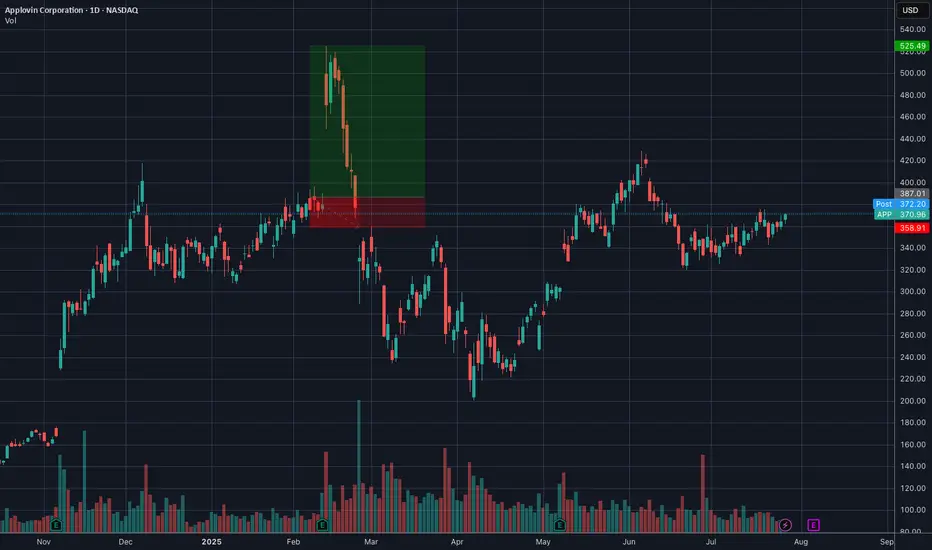
Buy Idea APP (Applovin Corp)Entry: $371 - 372
Stop: $342.50
Risk per share: $28.80
Earnings Catalyst Setup
• Flat base breakout above $370 zone, strong price structure
• Volume expanding into earnings — ideal for pre-earnings momentum pop
• Holding all major MAs: 21EMA, 50MA, 200MA clustered below
• MACD & Oscillators turning up, showing early momentum shift
• Institutional positioning appears supportive
• Earnings Date: ~9 days (6 Aug 2025 after mkt)
⚠️ Key Notes
• Pre-earnings breakout pattern, keep size light
• Possible re-rating if earnings surprise positively — watch for revenue growth in AI/game ads
• Sell partial above 1R to de-risk, trail rest
DISCLAIMER : The content and materials featured are for your information and education only and are not attended to address your particular personal requirements. The information does not constitute financial advice or recommendation and should not be considered as such. Risk Management is Your Shield! Always prioritise risk management. It’s your best defence against losses.
Google HTF Swing Short Wyoff Distribution PatternBased off HTF Wykoff Distribution Pattern. Overall target top 250ish Based off fibtrend/extensions. Followed by a ABC corrective pattern to play out over several months.

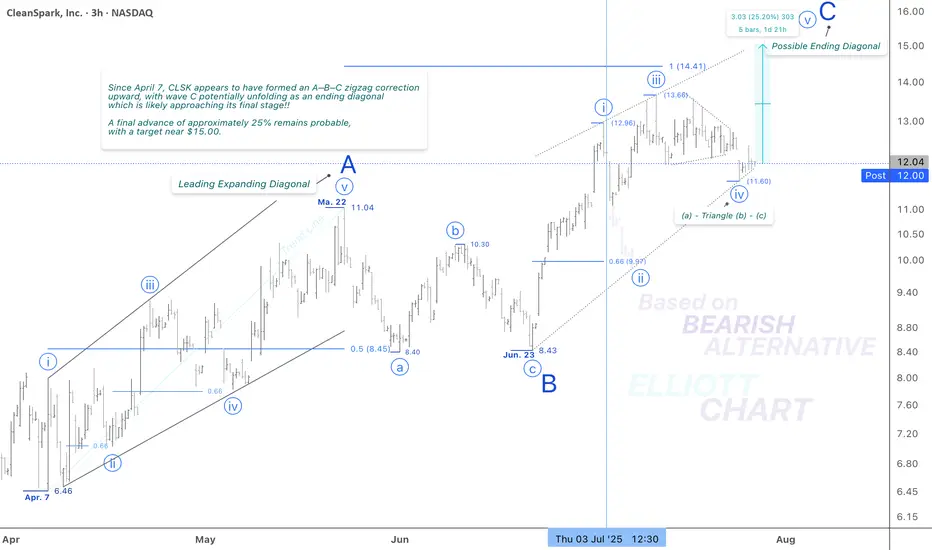
CLSK / 3hNASDAQ:CLSK has been trading with a slight upward bias ahead of a potentially final advance, projected to gain approximately 25% with a target near $15.00.
Wave Analysis >> As illustrated in the 3h-frame above, Minor wave C—completing the corrective upward move of wave (B)—appears to be unfolding as an ending diagonal, now likely in its final stages. Within this structure, the Minute wave iv (circled) has formed a correction. A final push higher in Minute wave v (circled) is now expected, which would complete the ending diagonal pattern of wave C, and in turn, conclude the countertrend advance of wave (B).
Trend Analysis >> Upon completion of the potential ending diagonal in Minor wave C, the broader trend is anticipated to reverse to the downside, initiating the final decline in Intermediate wave (C). This bearish phase may extend through the remainder of the year.
#CryptoStocks #CLSK #BTCMining #Bitcoin #BTC
NASDAQ:CLSK CRYPTOCAP:BTC BITSTAMP:BTCUSD MARKETSCOM:BITCOIN
Dollar General | DG | Long at $90.00Dollar General NYSE:DG took a massive hit this morning after revising their future earnings guidance. The economy is showing many signs of a recession, and this is a clear warning. From a technical analysis perspective, it has retouched my "crash" simple moving average and may dip further into the $80's in the near-term. But, like many overall strong companies that suddenly plummet, I view this as a future opportunity given the strength of NYSE:DG as a business (holistically). Dollar General is the only grocery and home goods store around in many rural locations. So, while there is doom and gloom in the near-term, Dollar General is in a personal buy zone at $90.00. I view this as a starter position, though, with the potential for future declines/opportunities for additional share accumulation in the near-term.
Target #1 = $100.00
Target #2 = $122.00
Target #3 = $200.00+ (very-long term outlook...)
