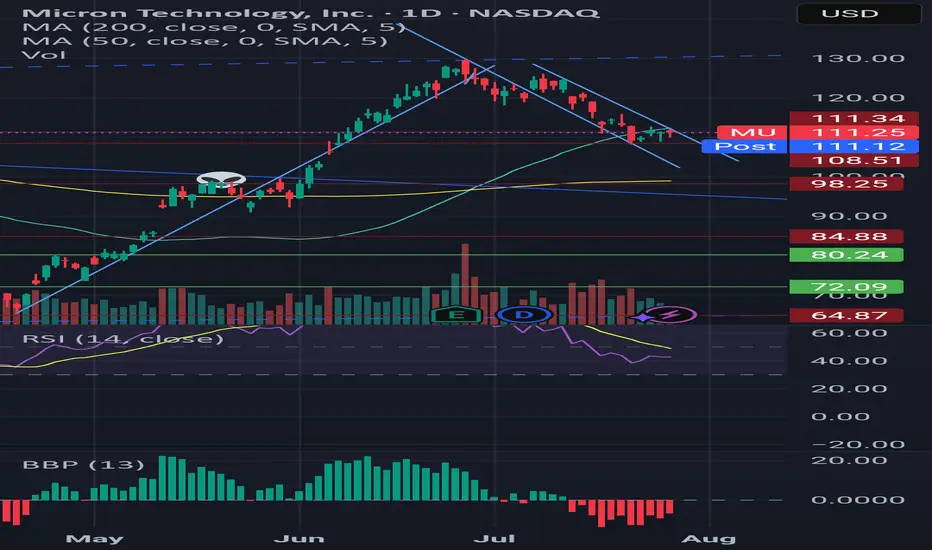
BearishI have a feeling that Micron's gonna retest $109 or blow through it and run for the 200 moving average. Waiting to see a bullish divergence in the RSI, or for it to get out of this little downtrend it's forming
7/28/25 - $bmnr - mNav more reasonable now (1.3x at ~$30/shr)7/28/25 :: VROCKSTAR :: AMEX:BMNR
mNav more reasonable now (1.3x at ~$30/shr)
- i'd link the docs but tradingview wants you to do the digging and doesn't want me to "promote" doing your own DD. ironic.
- so here's how you get there
- go the sec dot gov website search edgar in google
- type in the ticker
- check out the latest 8K
- click presentation
- slide 30 shows "BMNR NAV Detail"
- about 23 bucks per share NAV on fully diluted shares
- AH this thing trading at $30 ish... so 1.3x mnav
- considering view that ETH becoming a captured/ "knighted" winner by the tradfi gremlins, $10k/eth or higher not unlikely this cycle
- this type of "ROE" on a Kc of probably 10-15% means a 3..4...5x mNAV at cycle top not unreasonabl
- so if ETH declines here 50% (also reasonable to expect the worst, you're at $10-15/shr assuming mnav toward 1)... and then a say 2x mnav on $10k/eth would mean shares (considering no additional moves/ accretion from here - also unlikely and conservative) would mean a 4x on the current share px so conservatively that's $100 again.
- does it get to ATH?
- honestly the way that euphoria trades if we make a run for $100... probably yeah moar ATH, but that's unlikely to happen ST unless ETH has a monster run (and it already has)
- nevertheless... i'm finally (VERY) slowly adding this to my exposure, which for me means 50 bps at the AH px of $30.
V

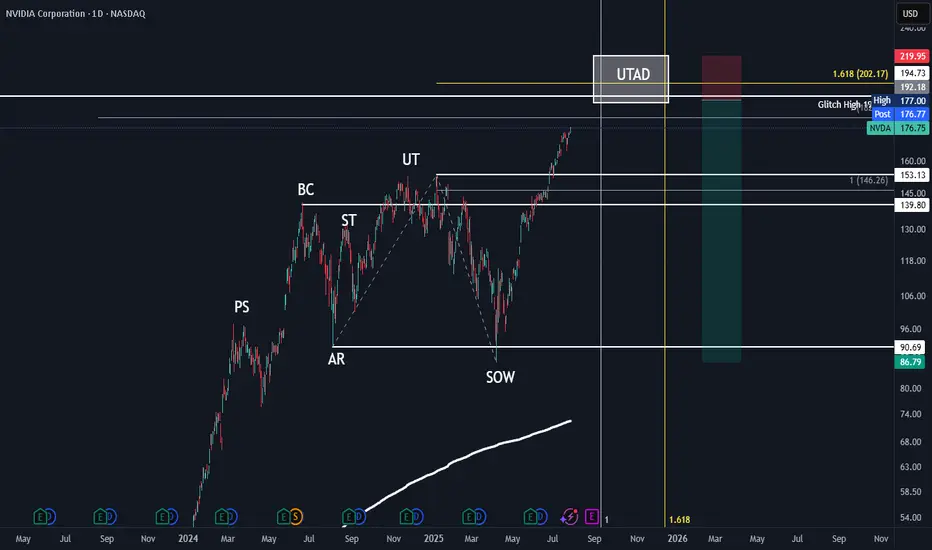
Nvidia HTF Wykoff Distribution PatternHTF Wykoff Distribution pattern in confluence with HTF fib trend/extension and fibonnacci time.
AAPL - A potential earnings rallyDoes not mean it has to straight up jump after earnings it also can shortly go into the opposite direction but the main direction is up for the moment

HIMS - 3rd times a charm!A really nice company with lots of growth potential, stock is used as playball for scalpers at this moment that turns down many big investors, but the less volatile it gets the more it will pump because it gets more attractive for bigger investors.

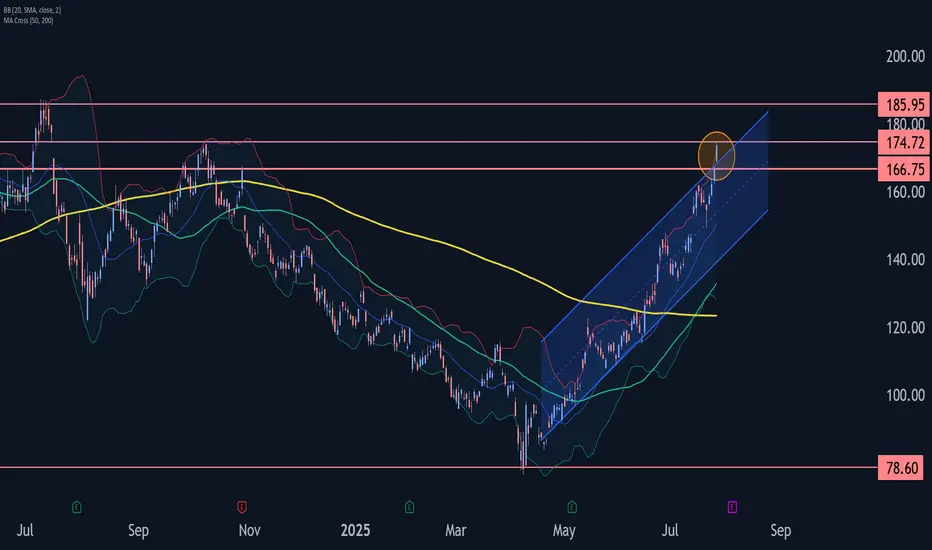
AMD Wave Analysis – 28 July 2025
- AMD broke resistance zone
- Likely to rise to resistance level 185.95
AMD recently broke the resistance zone between the resistance level 166.75 and the upper resistance trendline of the daily up channel from April.
The breakout of this resistance zone accelerated the active impulse waves 3 and (3).
Given the overriding daily uptrend, AMD can be expected to rise to the next resistance level 185.95 (former multi-month high from July of 2024).
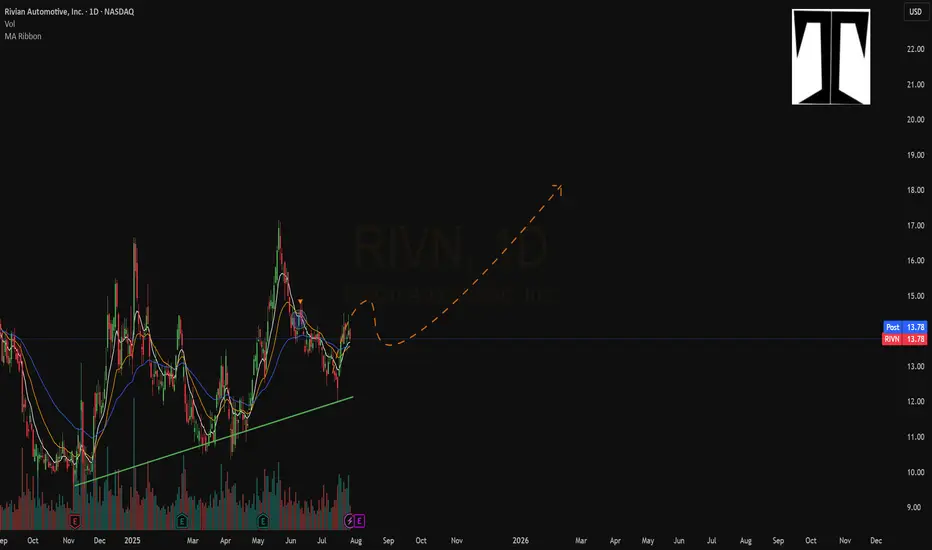
Quick View : RIVNDespite the bearish alert, I see some strenght here with the help of Earnings.
Bullish Crossover and box ready to be broken, and we are ready to catch it !
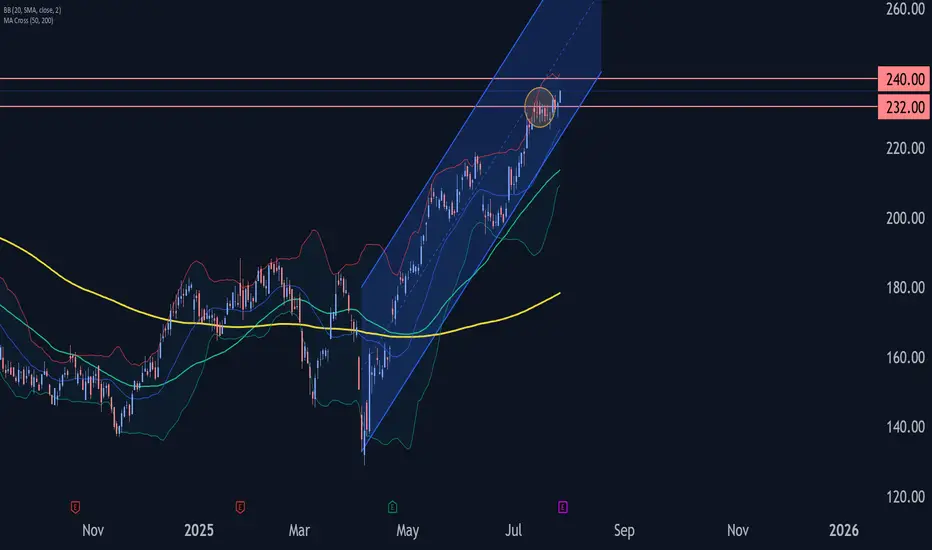
Boeing Wave Analysis – 28 July 2025- Boeing broke the resistance level 232.50
- Likely to rise to resistance level 240.00
Boeing recently broke the resistance level 232.50 (which stopped the previous minor impulse wave 3 in the middle of July, as can be seen below).
The breakout of the resistance level 232.50 continues the active short-term impulse wave 5 of the intermediate impulse wave (C) from June.
Given the clear daily uptrend, Boeing can be expected to rise further toward the next resistance level 240.00.
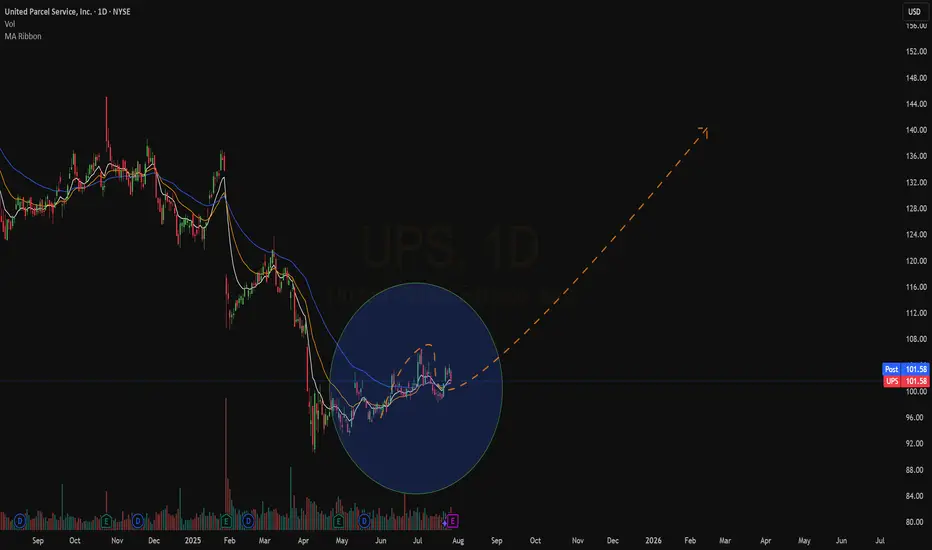
Quick View : $UPSThe daily chart is ready again to try to recover new highs.
Bullish ATR Alert, Bullish Crossover are just waiting for a new relative high.
Ready To catch it
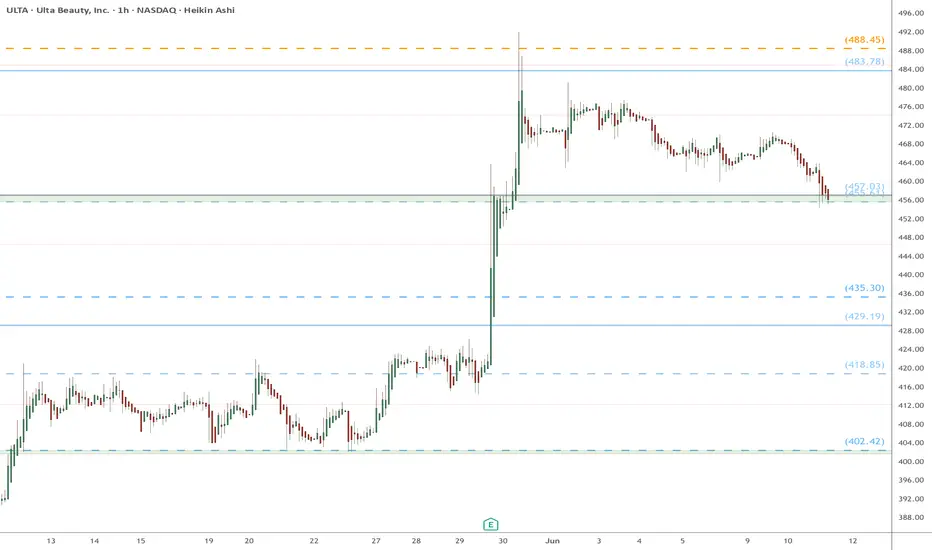
ULTA eyes on $455/457: Key support after Earnings spike and DipULTA had a good earnings report and spiked into resistance.
Now pulling back to first good support at $455.61-457.03
Look for this to hold, or dip below and then Break-n-Retest
Amd - New all time highs will follow!🪠Amd ( NASDAQ:AMD ) rallies even much further:
🔎Analysis summary:
After Amd perfectly retested a major confluence of support a couple of months ago, we saw a textbook reversal. This retest was followed by a rally of more than +100% in a short period of time. But considering all the bullish momentum, Amd is far from creating a top formation.
📝Levels to watch:
$200
SwingTraderPhil
SwingTrading.Simplified. | Investing.Simplified. | #LONGTERMVISION

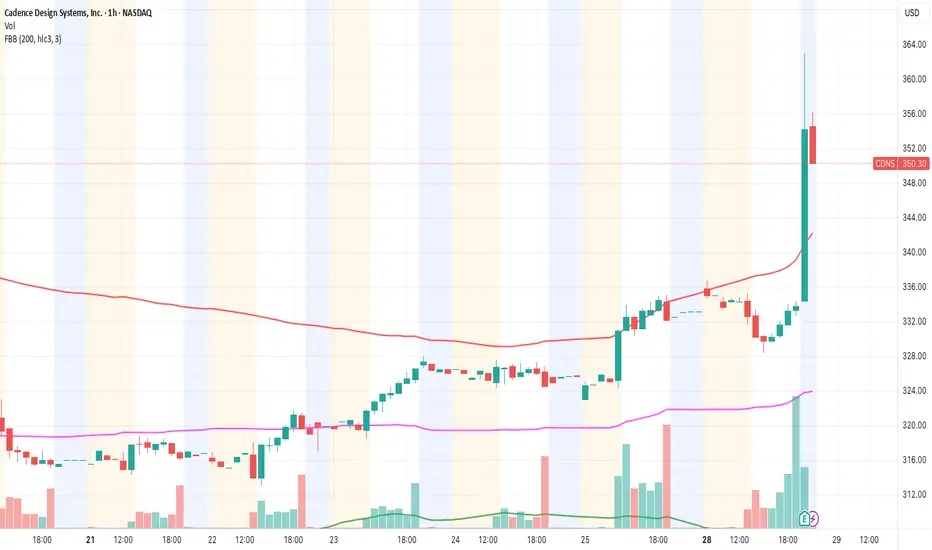
Cadence Design Systems (CDNS) – Keep an eye on tomorrow’s earninCadence ( NASDAQ:CDNS ) is reporting earnings tomorrow before the market opens, and honestly… this one might surprise.
Last quarter they not only beat expectations but also raised guidance — that’s no small thing. Since then, the stock has been consolidating nicely around the $160 zone. The chart looks solid: low volume pullbacks, RSI cooling off, and MACD looks ready to flip bullish.
If they deliver again (or just hold strong forward guidance), we could see a clean breakout toward $170+.
🟢 My game plan:
— Entry if it breaks $162 with volume
— Stop at $158
— Target $170–$175
Not financial advice — just what I’m seeing. The setup looks good and the risk is well-controlled.
What’s your take?
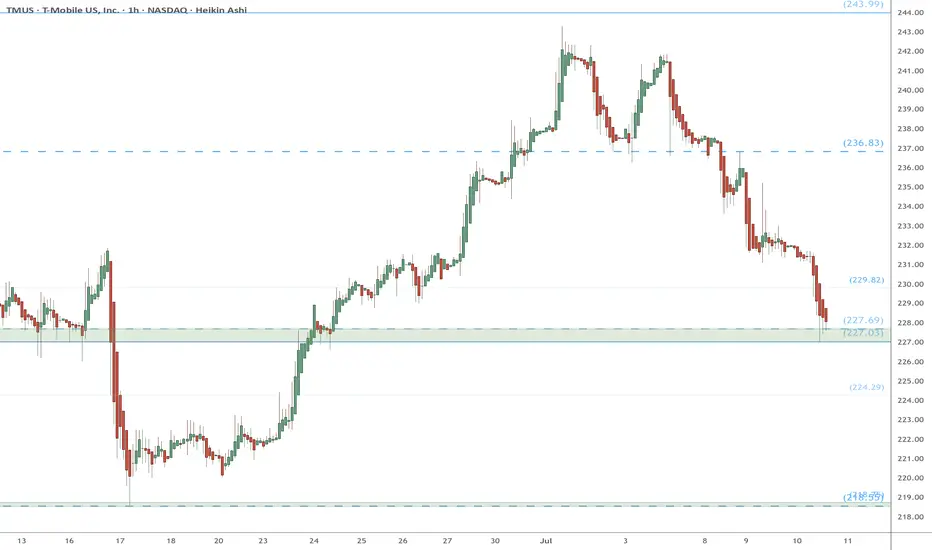
TMUS watch $227.03-227.69: Key support zone to end downtrend? TMUS has dropped a lot from its ATH a few months ago.
Currently testing a key support zone at $227.03-227.69
Look for a clean bounce to signal end of the downtrend.
Meta - The breakout in question?🪓Meta ( NASDAQ:META ) is retesting major structure:
🔎Analysis summary:
After Meta perfectly retested a major previous support trendline in 2022, the trend shifted bullish. We have been witnessing an incredible rally of about +700% with a current retest of the previous all time highs. Time will tell but a bullish breakout remains quite likely.
📝Levels to watch:
$750
🙏🏻#LONGTERMVISION
Philip - Swing Trader

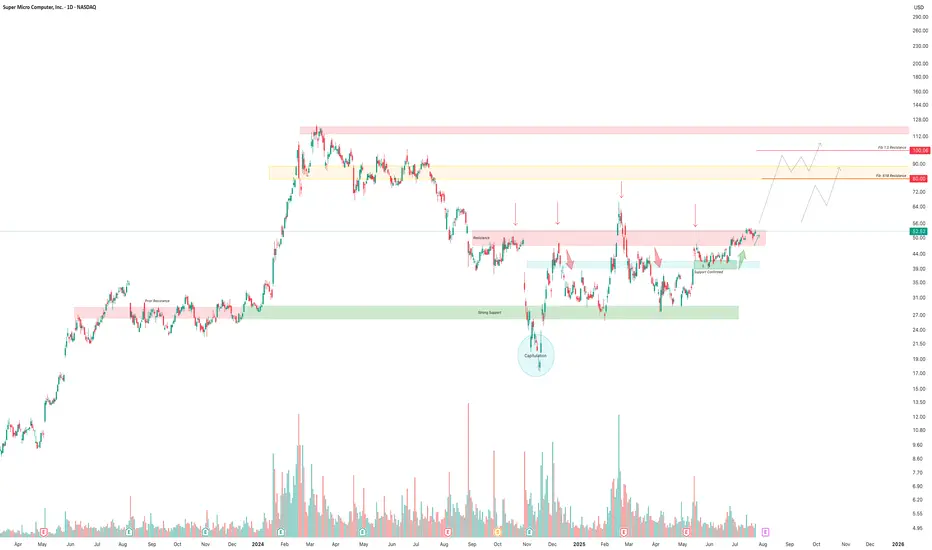
SMCI to Previous Highs!Super Micro Computer Inc. (SMCI) has formed a well-defined accumulation base between $26 and $46 after a major downtrend and capitulation event in late 2024. Price action has since transitioned from panic selling to structured accumulation, confirmed by:
Strong support at $26–28, tested multiple times, creating a clear bottom.
Capitulation low (circled) in November 2024 followed by a swift recovery, indicating institutional absorption.
Break above prior resistance at $47, now acting as confirmed support (light blue zone).
Price is currently pressing into multi-tap resistance near $52–54 — a breakout here would confirm the next leg higher.
Fibonacci extension targets of $80 (0.618) and $100 (1.0) are marked and align with key historical zones.
Volume shows increased interest on green bars during upward pushes, suggesting accumulation rather than distribution.
Summary
SMCI is transitioning from base to breakout with confirmed support and a maturing bullish structure.
A breakout above $54 with volume confirmation could initiate a trend toward the $80–100 zone, backed by technical alignment and renewed AI infrastructure demand.
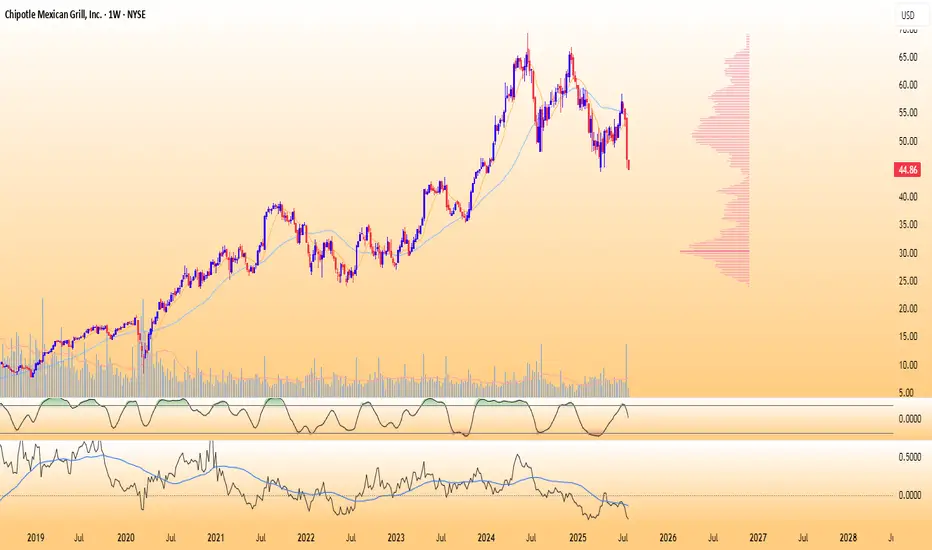
CMG entering a stage 4 downtrendCMG may have entered a stage 4 downtrend.The price has reflected sharply off the 200 daily moving average and busted rapidly on enormous volume to the low of the previous volume base formed from the week of March 10th to the week of June 9th. The 200 daily moving average has turned over and is sloping downward, alongside the 50 daily moving average. CMG has demonstrated poor relative strength (SPX). The consumer services sector remains in generally good condition, and there are large market caps that are showing strength and performing well in it. There are also many large market caps in the sector that have transitioned out of their respective stage 2 advances, and have started stage 3 distributions and stage 4 declines. Although MCD, the largest market cap in the restaurant industry, continues to perform very well- most of the stocks in the industry have begun to roll over into stage 3 distribution ranges and stage 4 declines. A short entry in CMG was made at ~$55, and more will be added to this position between $47.50 to $50 if the price corrects back to this level.
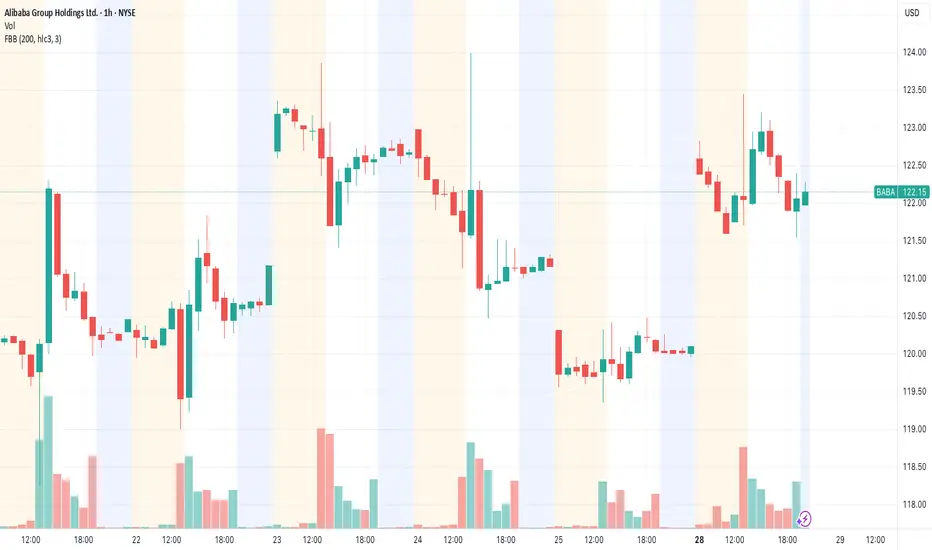
BABA looks ready to drop.It’s been hitting the $125 wall since May and just can’t break it. This last bounce? Weak volume. No real buyers stepping in. RSI is already stretched and there’s no accumulation from big players.
If it loses $120 with conviction, we might see $110 or lower.
And let’s be real — China’s still struggling and the narrative isn’t exciting anyone anymore.
I’m eyeing a PUT. If it breaks $125 clean, I’ll flip my view. Until then… watch out.
7/28/25 - $bynd - Fart coin without the cows7/28/25 :: VROCKSTAR :: NASDAQ:BYND
Fart coin without the cows
- over a $1 bn enterprise value
- no sales growth
- bill gates
- burns 100 mm a year
- nobody eats this product
- same valuation as fartcoin but fartcoin doesn't burn cash
- almost obviously going to zero
- but it's impossible to short
- if i owned it, i'd probably need an intervention, but beyond that... i'd dump it for anything *literally* treasuries, even XRP...
- just a PSA
- while not related... take NASDAQ:GAMB for instance.
- trades at less than 1/4 of the valuation. has 2/3 of the sales. 3x the gross profit. 15% fcf yield next year. but, this market is currently in the look here, over there, "it's only $3 and that one is $11" phase.
- this too... shall... pass.... and... "yes it's your fault you own this" at this stage, nobody else to blame.
V

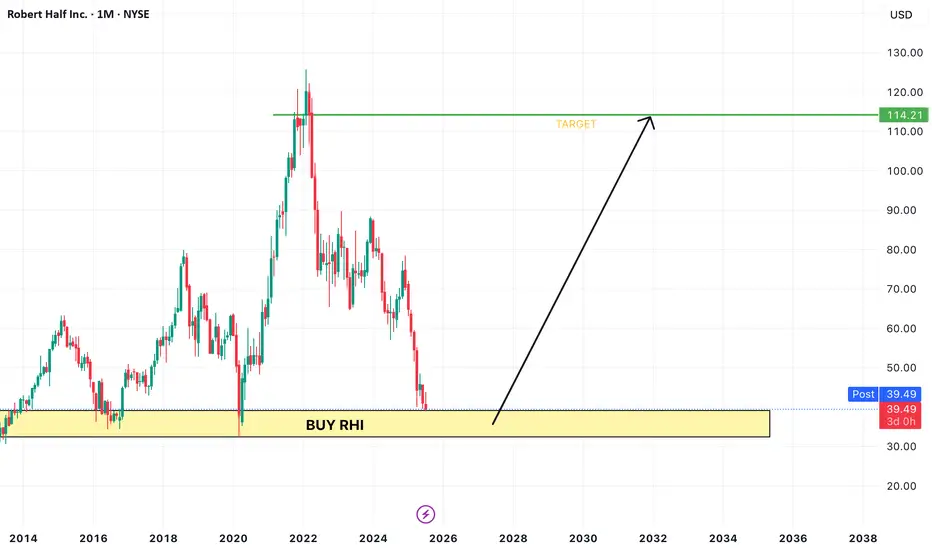
BUY RHILovely structure and setup albeit the numbers and fundamentals aren't looking the greatest but lets see if things change.
SAP - LONG Swing Entry PlanNYSE:SAP - LONG Swing Entry Plan
Entry Zone 1: $283.00 – $282.00
→ Open initial position targeting +8% from entry level.
Entry Zone 2: $274.00 – $273.00
→ If price dips further, average down with a second equal-sized entry.
→ New target becomes +8% from the average of Entry 1 and Entry 2.
Edit Zone : $260.00 – $258.00
→ If reached, enter with double the initial size to lower the overall cost basis.
→ Profit target remains +8% from the new average across all three entries.
Risk Management:
Stop Loss:
Risk is capped at 12% below the average entry price (calculated across all executed positions including the Edit Zone).
Position Sizing Approach:
Entry 1: 1x
Entry 2: 1x
Edit Zone: 2x
→ Total exposure: 4x
→ Weighted average determines final TP and SL calculations.
______________________________________
Legal Disclaimer
The information provided in this content is intended for educational and informational purposes only and does not constitute financial, investment, or legal advice or recommendations of any kind. The provider of this content assumes no legal or financial responsibility for any investment decisions made based on this information. Users are strongly advised to conduct their own due diligence and consult with licensed financial advisors before making any financial or investment decisions.
Sharia Compliance Disclaimer: The provider makes no guarantees that the stocks or financial instruments mentioned herein comply with Islamic (Sharia) principles. It is the user’s responsibility to verify Sharia compliance, and consultation with a qualified Sharia advisor is strongly recommended before making any investment decisions

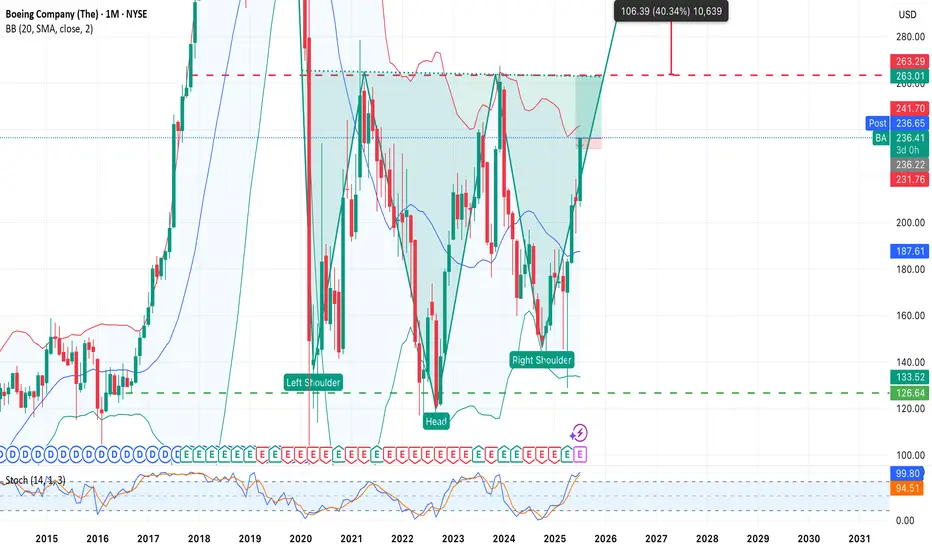
An adventure? Yes. But technically — beautiful. Boeing.Adventure Idea: The Return of Boeing NYSE:BA
An inverted “Head and Shoulders” pattern is forming on the BA (Boeing) chart — one of the most reliable bullish formations in technical analysis. The price is confidently approaching the neckline around $235–241, and a breakout above this level could mark the beginning of a new upward momentum.
Pattern Parameters:
• Left Shoulder: ~$126
• Head: ~$99
• Right Shoulder: ~$126
• Neckline: ~$235
• Breakout Target:
➤ $235 + $136 = $371 (long-term)
➤ Nearest resistance: $263
Action Plan (if entering long):
• Entry: On breakout above $241 or on a retest of $235
• Stop: Below the right shoulder — $126–133 (depending on risk tolerance)
• Targets:
1. $263 — first technical target
2. $280+ — if the trend develops
3. $371 — full target based on the pattern (textbook scenario)😄
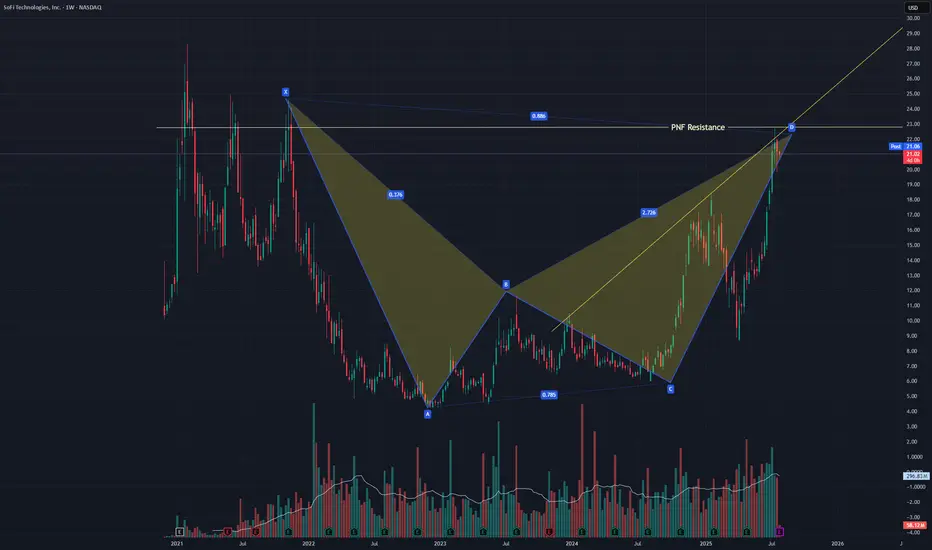
SOFI Pullback most likely comingNASDAQ:SOFI just finished a bearish bat harmonic and failed to break a resistance line I have from a PNF chart. It also failed a back test of a trendline of resistance in this uptrend. A pullback is likely but in this irrational market any thing could happen. I did a strangle +-5% just in case. I would not be surprised if I can close both with 20%+ profit.
EBAY watch $75.76-76.26: Key Support zone to launch next Leg UP EBAY trying to get back above its ATH from 2021.
Now testing a key support zone at $75.76-76.26.
Good but late long entry with StopLoss just below.
.
See "Related Pubications" for previous charts such as THE BOTTOM call:
Hit the BOOST and FOLLOW for more PRECISE and TIMELY charts.
=========================================================
