EBAY watch $75.76-76.26: Key Support zone to launch next Leg UP EBAY trying to get back above its ATH from 2021.
Now testing a key support zone at $75.76-76.26.
Good but late long entry with StopLoss just below.
.
See "Related Pubications" for previous charts such as THE BOTTOM call:
Hit the BOOST and FOLLOW for more PRECISE and TIMELY charts.
=========================================================

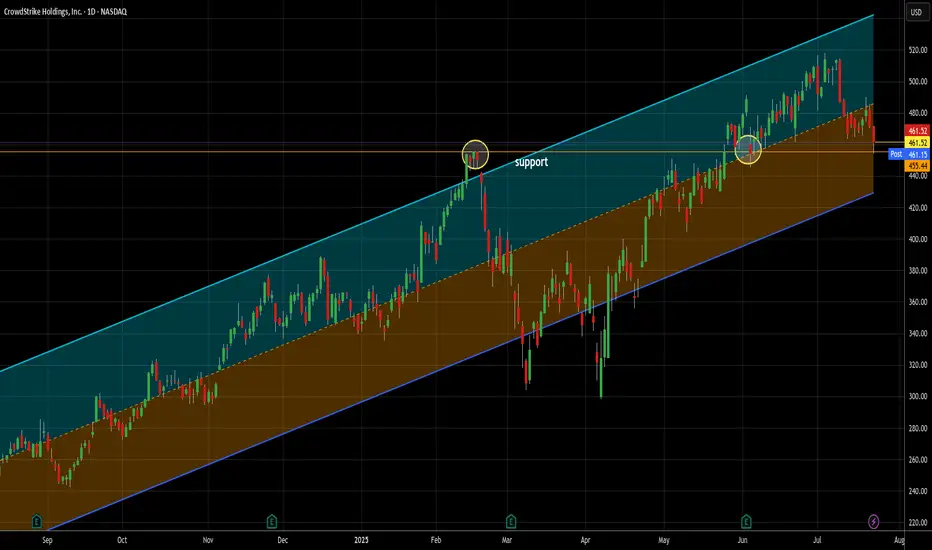
The only way to fight AI is with AI -- long at 461.52I love cybersecurity stocks generally. As our lives become ever more embedded in the electronic world, their necessity increases. As AI driven threats are sure to rise (Sam Altman, founder of OpenAI, spoke to a financial conference this week about the rising threat of AI driven banking fraud), the only way to combat it effectively is with AI. Crowdstrike, along with Palo Alto, are leading the charge in this area and I think will be another great example of AI ultimately being better than humans at the job they need to do here.
Yes, it's a story stock, but you know me - the story is the trading data. So here it is. In the last 12 months, 21 signals. 21 wins, 0 losses. Average trade length = 6.7 days (though that's misleading since all but 4 trades closed in less than that and 20 of 21 were 10 days or less). Average gain was 4.46% - that's an average of .67% per day held. That's almost 16x the long term daily rate of return of SPX and almost 10x the daily return of the Nasdaq 100 in the last year.
Additionally, it bounced off support near today's low and finished stronger. That's always good to see. I will happily add more if my signals suggest it, but of the 21 signals, only once did it produce 2 open lots at once. Nornally, it was one lot paying quickly. 2/3 of the trades closed in less than one week.
As always - this is intended as "edutainment" and my perspective on what I am or would be doing, not a recommendation for you to buy or sell. Act accordingly and invest at your own risk. DYOR and only make investments that make good financial sense for you in your current situation.

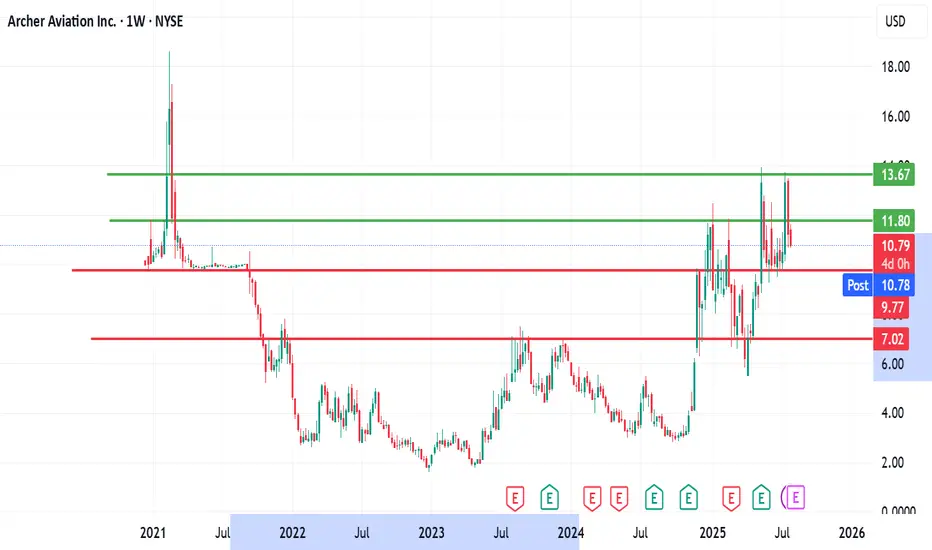
Archer Aviation (ACHR) Faces Continued Pressure – Key SupportArcher Aviation (ACHR) Faces Continued Pressure – Key Support Levels.
Archer Aviation (NYSE: ACHR) continues to face downward pressure, extending its decline after closing last week with a loss of over 18%.
As of the time of writing, the stock is down an additional 4.6%, trading around the $10.78 mark.
From a technical perspective, the $9.70 zone appears to be the next significant support level.
Should the stock reach this point, I intend to begin accumulating shares using a dollar-cost averaging (DCA) strategy.
It’s important to note that a break below this level remains possible, given that the eVTOL (electric Vertical Takeoff and Landing) industry is still in its early stages of adoption and remains highly speculative.
Caution and a long-term perspective are essential when approaching investments in emerging sectors like this.
I look forward to connecting with you.
Please, like, share, comment and follow me here
TSLA - LONG Swing Entry Plan NASDAQ:META - LONG Swing Entry Plan
Entry Zone 1: $307.00 – $302.00
→ Open initial position targeting +8% from entry level.
Entry Zone 2: $294.00 – $288.00
→ If price dips further, average down with a second equal-sized entry.
→ New target becomes +8% from the average of Entry 1 and Entry 2.
Edit Zone (Aggressive Demand): $247.00 – $243.00
→ If reached, enter with double the initial size to lower the overall cost basis.
→ Profit target remains +8% from the new average across all three entries.
Risk Management:
Stop Loss:
Risk is capped at 12% below the average entry price (calculated across all executed positions including the Edit Zone).
Position Sizing Approach:
Entry 1: 1x
Entry 2: 1x
Edit Zone: 2x
→ Total exposure: 4x
→ Weighted average determines final TP and SL calculations.
______________________________________
Legal Disclaimer
The information provided in this content is intended for educational and informational purposes only and does not constitute financial, investment, or legal advice or recommendations of any kind. The provider of this content assumes no legal or financial responsibility for any investment decisions made based on this information. Users are strongly advised to conduct their own due diligence and consult with licensed financial advisors before making any financial or investment decisions.
Sharia Compliance Disclaimer: The provider makes no guarantees that the stocks or financial instruments mentioned herein comply with Islamic (Sharia) principles. It is the user’s responsibility to verify Sharia compliance, and consultation with a qualified Sharia advisor is strongly recommended before making any investment decisions

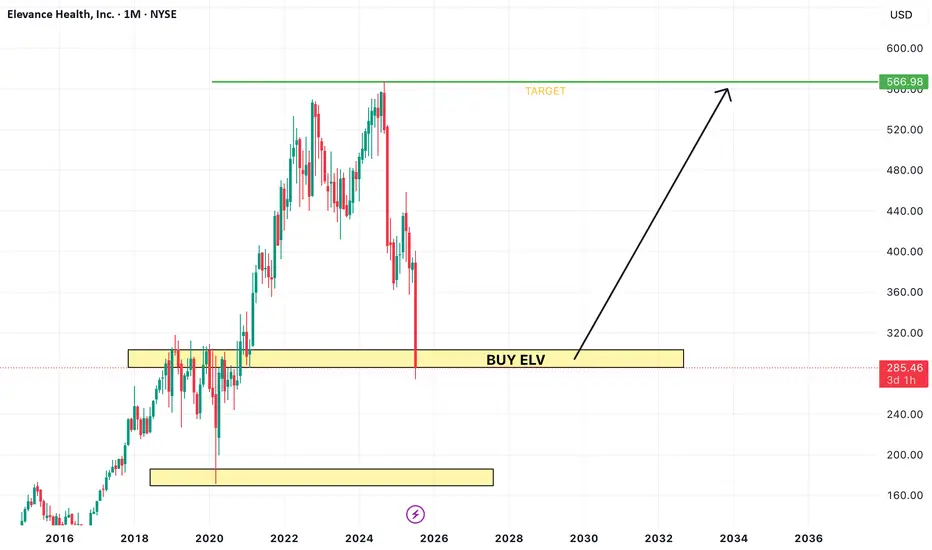
BUY ELVHealth Industry stocks have fallen a lot, ELV being one of many. Buying this stock at this current level anticipating price to respect this demand level.
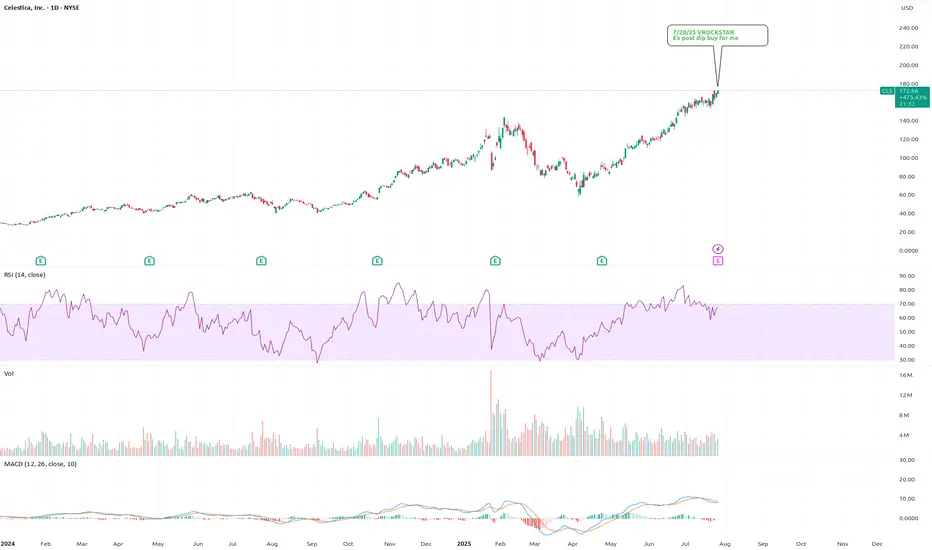
7/28/25 - $cls - Ex post dip buy for me7/28/25 :: VROCKSTAR :: NYSE:CLS
Ex post dip buy for me
- reminds of NYSE:GEV , great product, backlog, growth etc. etc.
- valuation at 2.5% fcf yield, low leverage and mid teens EBITDA for teens EBITDA growth++ is v reasonable
- don't really have an edge here, except to say.. i think any "miss" will quickly get bot and that's where i'd participate
- otherwise i think it's probably a beat/ should head higher all else equal
V
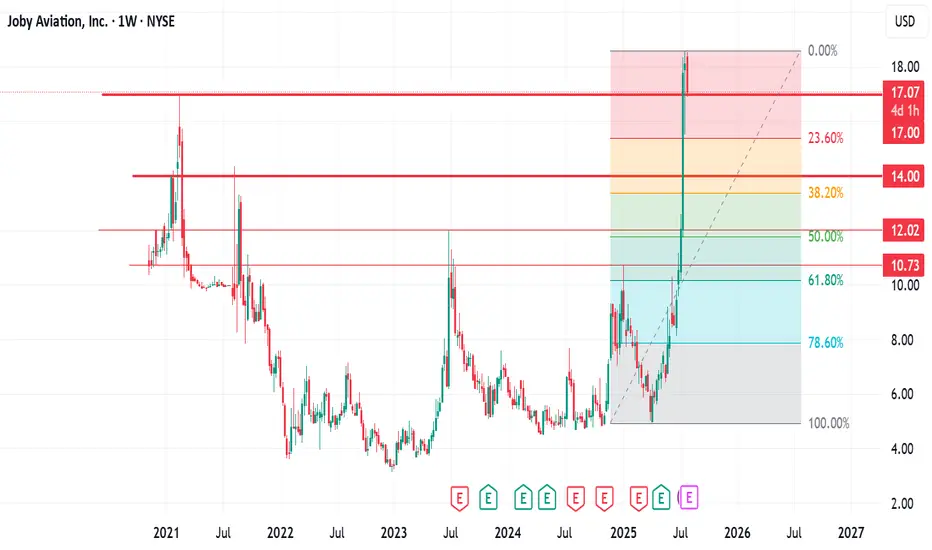
JOBy Aviation (JOBY) Price Action and Accumulation OutlookJOBy Aviation (JOBY) Price Action and Accumulation Outlook.
JOBy Aviation (NASDAQ: JOBY) has experienced a notable upward trend since its reversal on April 7, 2025, when it was trading around $4.96. The stock reached an all-time high of approximately $18.60 on July 25, 2025.
However, in today’s trading session, the stock declined by over 8%, testing a key support level at $17.00. From a technical standpoint, if this support level fails to hold, the next potential downside target could be around $14.00.
At this level, I plan to begin accumulating shares using a dollar-cost averaging (DCA) strategy. Should Fibonacci retracement levels become relevant in the correction, we may see the price retrace to the 50% level, which lies around $12.00 per share — a zone that could offer an attractive long-term entry point.
Given JOBY’s position as a frontrunner in the eVTOL (electric Vertical Takeoff and Landing) sector, this may represent a long-term investment opportunity worth considering.
I look forward to connecting with you.
Let's keep winning together
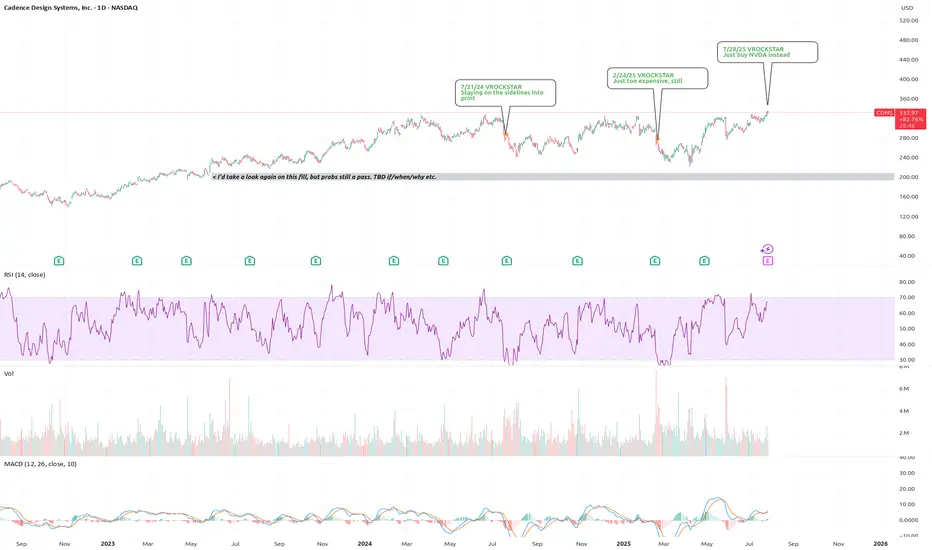
7/28/25 - $cdns - Just buy NVDA instead7/28/25 :: VROCKSTAR :: NASDAQ:CDNS
Just buy NVDA instead
- higher multiples
- less growth and less fcf generation
- technically an industry-float-higher-beneficiary
- but if you look at my last notes... stock has really not gained much ground vs. say SPY or QQQ
- you're one bad print away from this thing going -15 or -20%. does it happen this Q? no idea. but you will struggle to buy that dip aggressively. and if it rips? can you keep it? tough call.
- sidelines.
- gl to longs.
V
CCJ eyes on $45.37: semi-major Fib may dip to $42 for long entryCCJ trying to recover from the nuclear bubble burst.
Currently testing a semi-major Covid fib at $43.37
If it dips then watch the support zone $42.31-42.91

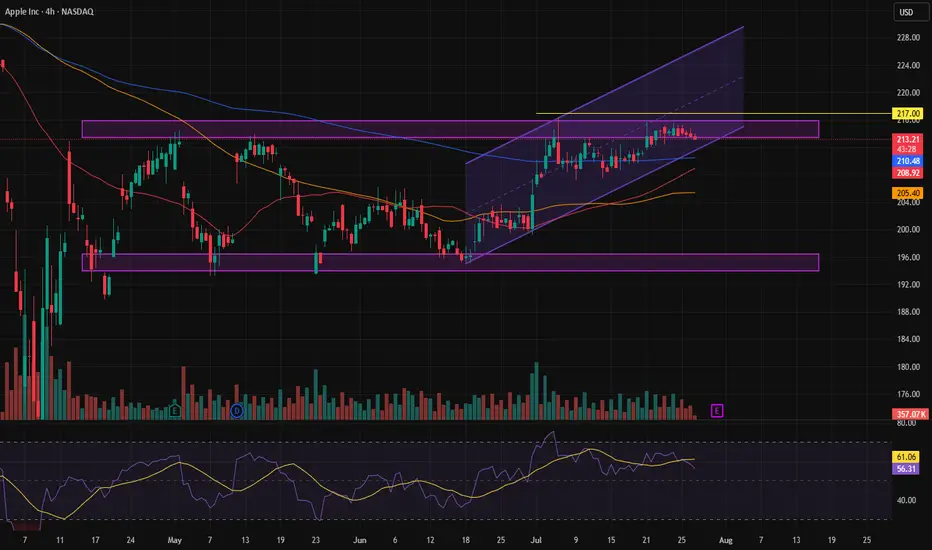
End of correction or a drop?In the long-term trend of Apple stock, we all know it's clearly bullish. However, it has been going through a correction for a while now, and signs are starting to suggest that the correction may be ending. Once a trigger is confirmed, we can consider trading this stock and going for a buy.
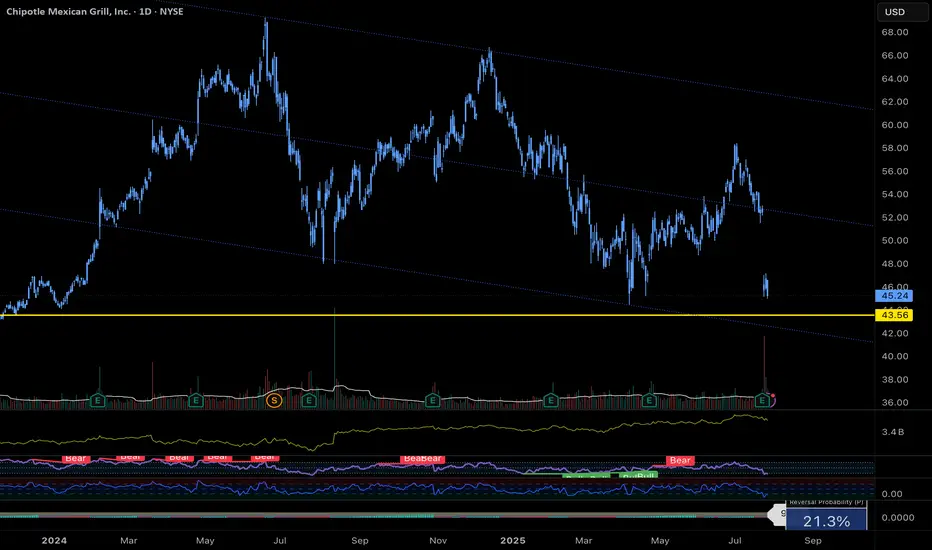
$CMG Approaching Major Support – Buy the Dip or Breakdown?Chipotle ( NYSE:CMG ) just reported earnings and missed on both revenue and same-store sales. Transactions fell 4.9%, and the company lowered its full-year outlook — triggering a sharp decline on elevated volume.
Technically, we’re approaching a major confluence of support near the $43 area (both diagonal trendline support and historical horizontal level).
🔻 Indicators currently suggest continued selling pressure, so traders looking to buy the dip should remain cautious.
Trade Setup Idea:
- Watch for bullish reversal patterns (engulfing, double bottom, trend shift) on 15min–1hr charts
- Avoid premature entries; trend reversals often take time
- NYSE:CMG Confirmation > prediction
📌 Keep alerts set. This one’s worth watching closely.
#CMG #Chipotle #TradingView #TechnicalAnalysis #SupportAndResistance #DipBuy #StocksToWatch
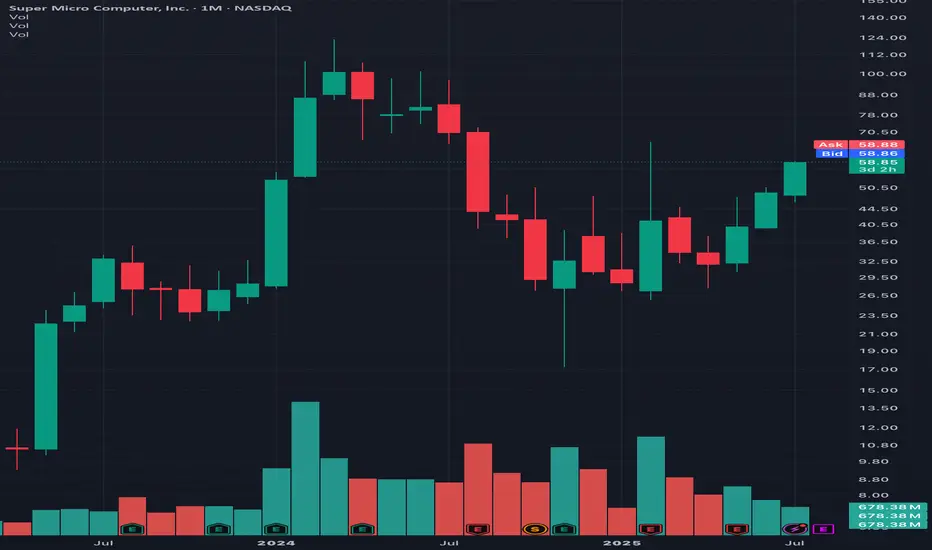
Looking at monthly chart on SCMI I see 3 white soldiers to $100Not that much to describe as the three white soldiers on the monthly candle chart are pretty self explanatory. One of the more basic readings for good times ahead. That’s aside from the fundamentals of having most of the ai data centers using its liquid cooled state of the art chassis’ designed for latest Nvidia chips.
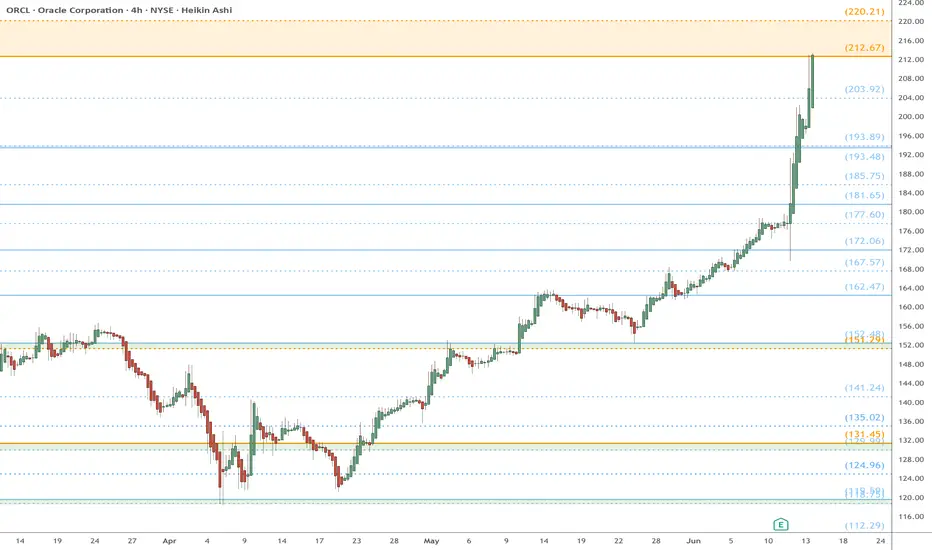
ORCL heads up at $212 then 220: Double Golden Fibs may STOP runORCL has been flying off the last Earnings report.
About to hit DUAL Golden fibs at $212.67-220.21
Ultra-High Gravity objects in its price-continuum.
It is PROBABLE to consolidate within the zone.
It is POSSIBLE to reject and dip to a fib below.
It is PLAUSIBLE but unlikely to blow thru them.
.
My last Plot that caught the BreakOut EXACTLY:
=================================================
.
DUOLINGO BUYSI'm bullish on Duolingo stock overall, and right now it's at a great buying level. The price has pulled back to the same area where it was consolidating in April 2025, which gives a solid support zone. This retracement offers a good discount, so I see it as a strong opportunity to buy in.

Good buying area for DuolThis is a good area to buy Duol, Monthly and Quarterly supports are at 327, could it go lower? Sure it could always go lower, i wouldn't be that shocked if it got into the 200s. This is a very efficient company with no debt, it's rule of 40 score is close to another huge winner of mine, PLTR. I will always buy monthly/quarterly levels on companies like this. I think this could trade in the 600s by the first half of next year.

DCA ZoneFinally a new Starbucks competitor has arrived! Here's my possible DCA zone. I may have to settle for around $30, watching the RSI to see how it looks along the way
SMCI WEEKLY CALL SETUP (07/28/25)
### 🔹 SMCI WEEKLY CALL SETUP (07/28/25)
**Bullish Flow + Strong RSI = 🚀 Call Opportunity at \$62**
---
### 📊 TECHNICAL SNAPSHOT
* **RSI (Daily + Weekly):** ✅ Above 55 — clear bullish strength
* **Weekly Close:** 🔼 Broke prior highs — momentum continuation likely
* **Volume Ratio:** Slightly weak (0.9x) 📉 — watch early-week participation
* **VIX:** 14.93 💤 — low vol = smoother price action (great for weekly calls)
---
### 💥 OPTIONS FLOW HIGHLIGHTS
* **Call/Put Ratio:** 4.30 🔥 (heavy bullish skew)
* **Hot Strikes:** \$62.00 & \$63.00 = aggressive positioning
* **OI Surge:** Confirmed institutional interest → upside bets stacking up
---
### ✅ TRADE SETUP
* 🎯 **Strategy:** Long Weekly Call
* 📈 **Strike:** \$62.00
* 📅 **Expiration:** Aug 1, 2025
* 💸 **Entry Price:** \$0.86 (ask)
* 🛑 **Stop Loss:** \$0.43 (50% risk)
* 🎯 **Target:** \$1.20 (40% upside)
* 📈 **Confidence:** 80%
* ⏰ **Entry Timing:** Market open
---
### 🚨 KEY RISKS
* ⚠️ Weak volume = lower conviction from institutions
* 📉 Watch early-week flow → exit if buyers fade
* 🎯 Above \$63 = breakout fuel
* 🧨 Below \$61 = trend in question
---
### 🧠 MODEL CONSENSUS
> All quant models bullish except **one cautioning on volume**
> Options flow + RSI = overwhelming bullish case
---
### 📦 TRADE\_DETAILS (Algo-Friendly JSON)
```json
{
"instrument": "SMCI",
"direction": "call",
"strike": 62.0,
"expiry": "2025-08-01",
"confidence": 0.80,
"profit_target": 1.20,
"stop_loss": 0.43,
"size": 1,
"entry_price": 0.86,
"entry_timing": "open",
"signal_publish_time": "2025-08-01 09:30:00 UTC-04:00"
}
```
---
📈 **Watch zones:**
* 🚀 Above \$63 = breakout
* 🛑 Below \$61 = cut risk
---
**#SMCI #OptionsFlow #CallOptions #WeeklyTrade #RSI #BullishMomentum #MarketOpenSetup #QuantSignals #OptionsAlert**

CRWVExpecting Bullish price action at 100$ level. If break of structure is noted and maintained I see upside targets remaining 189$. Second Scenario is Price falls to the 60$ level then shows bullish price action.

MSTR WEEKLY OPTIONS SETUP (2025-07-28)
### 🔻 MSTR WEEKLY OPTIONS SETUP (2025-07-28)
**Bearish Divergence with High Confidence — Time to Strike with a PUT?**
---
📊 **Momentum Recap:**
* **RSI:** Bearish 📉
* **Volume:** Weak (institutional exit risk)
* **Options Flow:** Mixed (calls > puts, but no alignment with price)
* **Sentiment Models:** Split 4:1 → **Only Claude/Anthropic** goes bearish with conviction
🧠 **Model Consensus:**
> “Momentum is weak, volume fading, and no upside confirmation = bearish edge.”
---
### ✅ SETUP OVERVIEW
* 🔍 **Trend:** Bearish (declining RSI)
* 📉 **Volume:** Weak = reduced institutional conviction
* 💬 **Options Flow:** Bullish bias, but **contradicts price trend**
* ⚙️ **Volatility:** Elevated, potential reward for directional plays
**Overall Bias:** 🔴 *Moderately Bearish*
---
### 💥 TRADE IDEA: MSTR \$400P
* 🎯 **Strategy:** Long Weekly Put
* 🔻 **Strike:** 400.00
* 📆 **Expiry:** Aug 1, 2025
* 💸 **Entry Price:** \$8.65
* ✅ **Profit Target:** \$12.50
* 🛑 **Stop Loss:** \$4.00
* 📈 **Confidence Level:** 72% (backed by Claude model)
* 📉 **Breakdown Trigger:** Below \$405 confirms bearish flow
* ⚠️ **Invalidation:** Break above \$415 → exit early
---
### 📦 TRADE\_DETAILS (Backtest/Algo Ready JSON)
```json
{
"instrument": "MSTR",
"direction": "put",
"strike": 400.0,
"expiry": "2025-08-01",
"confidence": 0.72,
"profit_target": 12.50,
"stop_loss": 4.00,
"size": 1,
"entry_price": 8.65,
"entry_timing": "open",
"signal_publish_time": "2025-07-31 09:30:00 UTC-04:00"
}
```
---
### 🧠 TRADE INSIGHTS
* 🟥 4/5 models say **no trade** due to signal divergence
* 🧠 **Claude’s bearish thesis = cleanest directional setup**
* 🚨 Volume + RSI combo = downside confirmation
* 🧭 Watch key price reaction zones: **\$400–\$405 (support)** / **\$415 (resistance cap)**
---
**#MSTR #PutOptions #WeeklyTrade #BearishSetup #OptionsFlow #QuantTrading #ClaudeModel #MarketMomentum**


GE WEEKLY OPTIONS SETUP (2025-07-28)
### ⚙️ GE WEEKLY OPTIONS SETUP (2025-07-28)
**Mixed Signals, Bullish Flow – Can Calls Win This Tug-of-War?**
---
📊 **Momentum Breakdown:**
* **RSI:** Falling across models → ⚠️ *Momentum Weak*
* **Volume:** Weak 📉 = Low conviction from big players
* **Options Flow:** Call/Put ratio favors bulls 📈
* **Volatility (VIX):** Favorable for directional plays
🧠 Model Consensus:
> “Momentum weak, but bullish flow + low VIX = cautiously bullish.”
> Some models recommend **no trade**, others suggest **tight-risk long call**.
---
### ✅ WEEKLY SETUP AT A GLANCE
* 🔍 **Volume:** Weak (distribution risk)
* 📉 **Momentum:** RSI fading
* 💬 **Options Sentiment:** Bullish bias (calls > puts)
* ⚙️ **Volatility:** Favorable
**Overall Bias:** 🟡 *Moderate Bullish*
---
### 💥 TRADE IDEA: GE \$275C
* 🎯 **Strategy:** Long Weekly Call
* 🔵 **Strike:** 275.00
* 📆 **Expiry:** Aug 1, 2025
* 💸 **Entry:** \$1.10
* ✅ **Profit Target:** \$1.80
* 🛑 **Stop Loss:** \$0.55
* 📈 **Confidence Level:** 65%
* 🧮 **Risk Level:** Medium (momentum divergence = tread carefully)
* ⚠️ **Support Watch:** Monitor for drop below \$268–270 for potential exit.
---
### 📦 TRADE\_DETAILS (Algo/Backtest Ready JSON)
```json
{
"instrument": "GE",
"direction": "call",
"strike": 275.0,
"expiry": "2025-08-01",
"confidence": 0.65,
"profit_target": 1.80,
"stop_loss": 0.55,
"size": 1,
"entry_price": 1.10,
"entry_timing": "open",
"signal_publish_time": "2025-07-28 12:08:59 UTC-04:00"
}
```
---
### 📌 NOTES FOR TRADERS
* 🤖 Models split between *no trade* vs *tight-risk long*
* 🚨 **Momentum divergence** is real – don’t oversize
* 🧭 **Watch Friday theta decay** — manage exits accordingly
* 🔍 Chart check: Watch price action near \$275 and \$268
---
**#GE #OptionsTrading #WeeklyPlay #CallFlow #UnusualOptionsActivity #GEcalls #AITrading #RiskManagement**

The 5 different types of Professional TradersLearn what each professional trader group trades, how they trade, when they trade and why they trade.
There are:
Sell Side Institution Floor Traders
Buy Side Institution Floor Traders
Proprietary Desk Traders (prop)
Specialist Professional Traders
Independent Professional traders.
Each type of professional trades differently. Each has a different agenda for trading a particular stock.
Sell Side Floor Traders trade short term to generate income for the big Money Center Banks.
Buy Side Floor Traders are long term investors for mutual funds and ETFs and other derivatives and manage the quantity of shares held for all of the 4000 -6000 stocks their Buy Side company is holding.
Specialists usually are trading one stock or an industry.
Independent Professional Traders trade at home for themselves. Most are former Sell Side floor traders. This group is growing in numbers as more floor traders opt to go rouge and trade for themselves.
You need to learn how to identify which professionals are in a stock with tells you the intent of the trade and the probable hold time.
Learn to trade with the professionals rather than against them.
