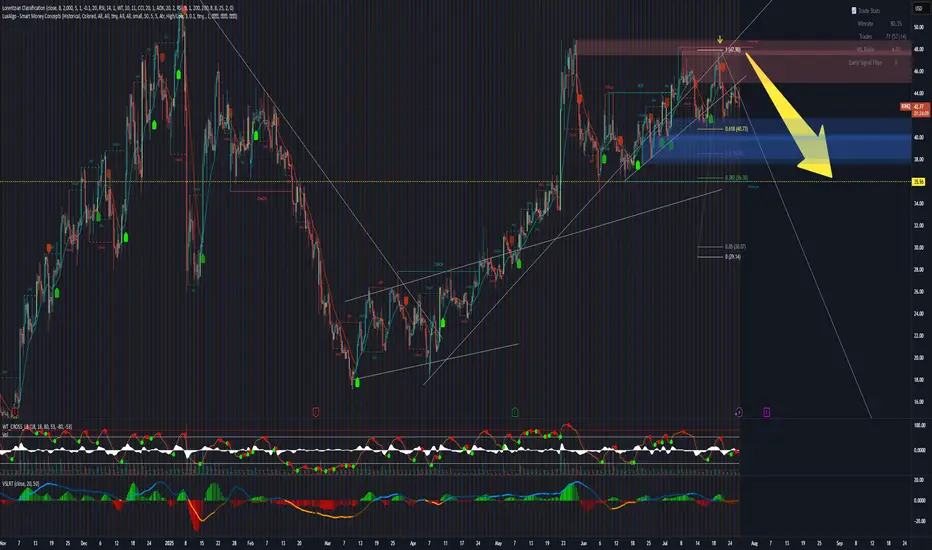
BABA | Long | Strong AI & Seasonality Tailwinds (July 2025)BABA | Long | Strong AI & Seasonality Tailwinds (Aug 2025)
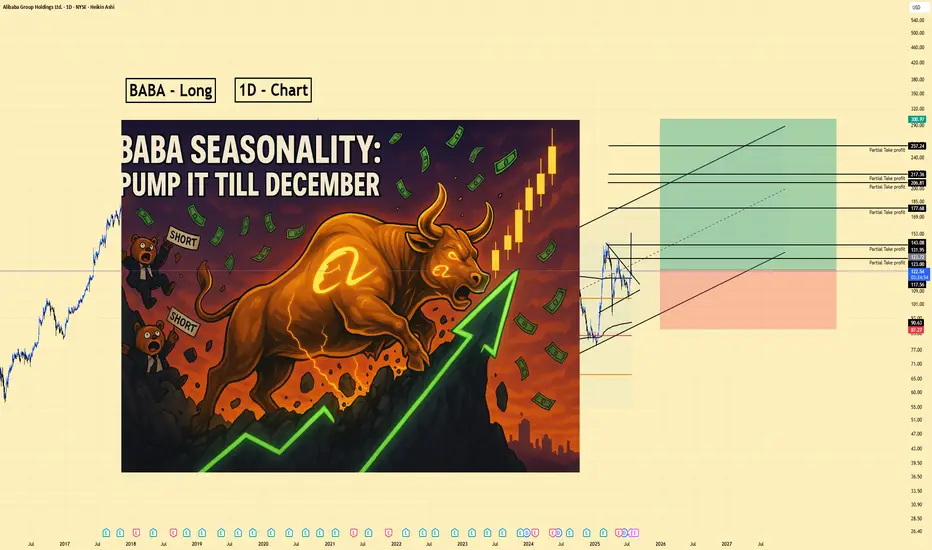
1️⃣ Quick Insight: Alibaba is showing strong AI-driven momentum, healthy fundamentals, and positive seasonality patterns. August–December tends to be bullish, and the stock is already holding up well despite recent dips.
2️⃣ Trade Parameters:
Bias: Long
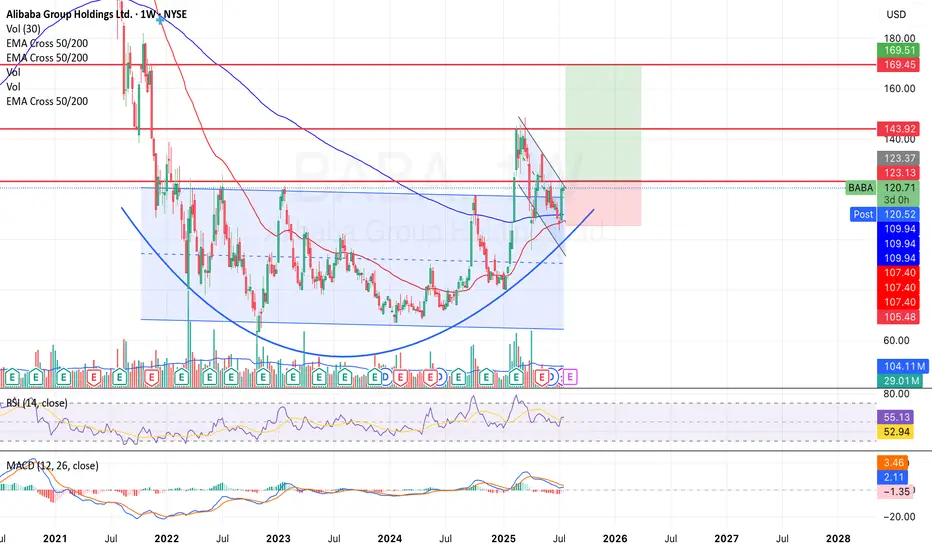
Entry: Current price zone (~$123)
Stop Loss: $87
Take Profits:
TP1: $131
TP2: $143
TP3: $177
TP4: $206
TP5: $217
TP6: $257
Extended Target: $300 (if momentum holds through the parallel channel)
3️⃣ Key Notes:
Alibaba’s fundamentals remain solid with revenue up on a yearly basis since 2021, even though some quarters have shown pressure. EPS is expected to grow annually, and institutional interest is strong (43% holding increase by Maridea Wealth Management). The AI pivot with Qwen LLM models and Quark AI glasses launch could be major catalysts. Seasonality supports upside through mid-December before potential reversals.
4️⃣ What to Watch:
AI & cloud revenue performance (Qwen adoption)
Cainiao and other potential spinoff IPOs
Regulatory updates and U.S.-China tensions
Seasonal strength: historically bullish until late November–early December
📊 Outlook: Analysts forecast $150–$160 in the next 12 months (~20–30% upside). Bull case targets range $200–$250 over 3–5 years, with potential extension if AI & international commerce expansions deliver.
Please LIKE 👍, FOLLOW ✅, SHARE 🙌 and COMMENT ✍ if you enjoy this idea! Also share your ideas and charts in the comments section below! This is best way to keep it relevant, support us, keep the content here free and allow the idea to reach as many people as possible.
Disclaimer: This is not financial advice. Always do your own research.
AMDthe weekly price action of Advanced Micro Devices Inc (AMD):The stock is trading near a critical resistance zone marked with a rectangular box just below $180.In the past, this area acted as a rejection point, evident from prior pullbacks when the stock neared these levels.
The chart reflects a larger declining channel. Current price action shows AMD approaching the upper boundary of this channel, which may act as dynamic resistance.
If AMD breaks above the $180 resistance convincingly, there’s potential for the stock to aim for higher targets, such as the next major zone ($240).
Failure to break above $180 may lead to a retest of lower levels, potentially near $140 or the breakout zone ($100-$120).

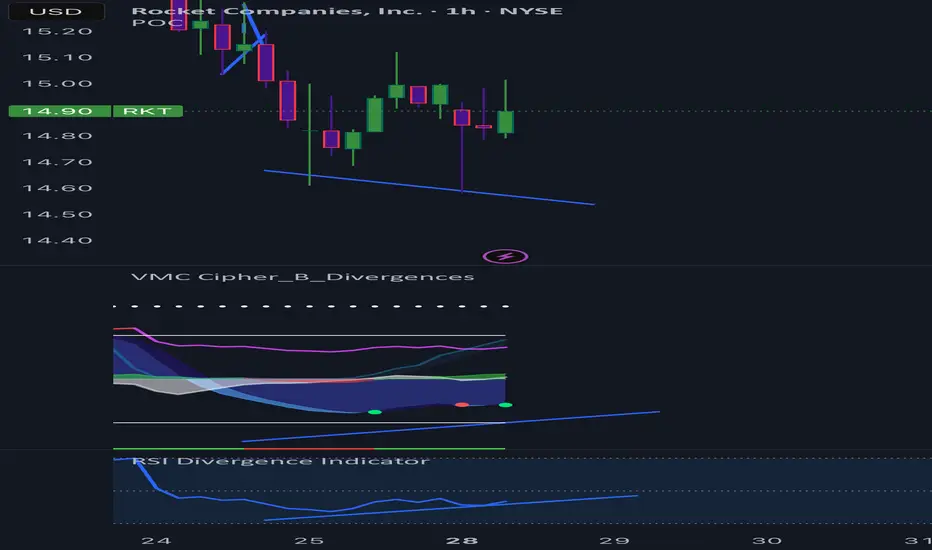
Tripe bull div with confrontation from the stochastic on RKT Rocket mortgage has a triple bullish divergence on the one hour chart, lol time frames as well, One indicator I’ve used to confirm this is my own and they would not let me publish it
USAR | We missed(ish) on MP, can we get some rare earth pamp?!Tradesters, Let's focus our blurred vision on USA Rare Earth Inc NASDAQ:USAR
WHy?!?!?! YOU WANT TO KNOW WHY!?!?!
Well, the US is tryna get serious aboot national security. We're gonna need a lot of magic rocks to do that. In order to secure more magic rocks, recently the US Gubment PAMPED MP Materials NYSE:MP and maybe we missed the initial PAMP.
That recently signed Big Frothy Bill has mo' money in it for such investments. NASDAQ:USAR could be another target of such pamping. Parallel channel might indicate a good starter position entry point.
This is not financial advice. THANK YOU FOR YOUR ATTENTION ON THIS MATTER

Shopify (SHOP) – Powering the Next Wave of Global E-CommerceCompany Snapshot:
Shopify NASDAQ:SHOP continues to dominate as a leading commerce infrastructure provider, backed by record merchant adoption, a recurring revenue engine, and cutting-edge AI integration that enhances merchant capabilities.
Key Catalysts:
AI-Powered Ecosystem 🤖
From automated content creation to smart marketing tools, Shopify’s AI advancements are boosting merchant efficiency and making the platform indispensable for sellers.
Global Expansion 🌍
Shopify is scaling aggressively in Europe, Latin America, and Asia-Pacific, with localized services improving merchant onboarding and consumer reach.
Fulfillment Firepower via Deliverr 🚚
The Deliverr acquisition supercharges Shopify’s logistics network, enabling fast, reliable delivery that improves merchant retention and directly competes with Amazon.
Sticky, Scalable Revenue 💸
Its subscription-based model ensures high predictability, while growth in merchants and services lifts average revenue per user (ARPU).
Investment Outlook:
Bullish Entry Zone: Above $105.00–$107.00
Upside Target: $170.00–$175.00, powered by AI leverage, global scale, and logistics innovation.
🚀 Shopify is emerging not just as a storefront builder, but as a global commerce operating system.
#Shopify #Ecommerce #AI #DigitalRetail #GlobalExpansion #Deliverr #Fulfillment #TechStocks #SHOP #AmazonRival #ARPU #SaaS #GrowthStock #MerchantEconomy

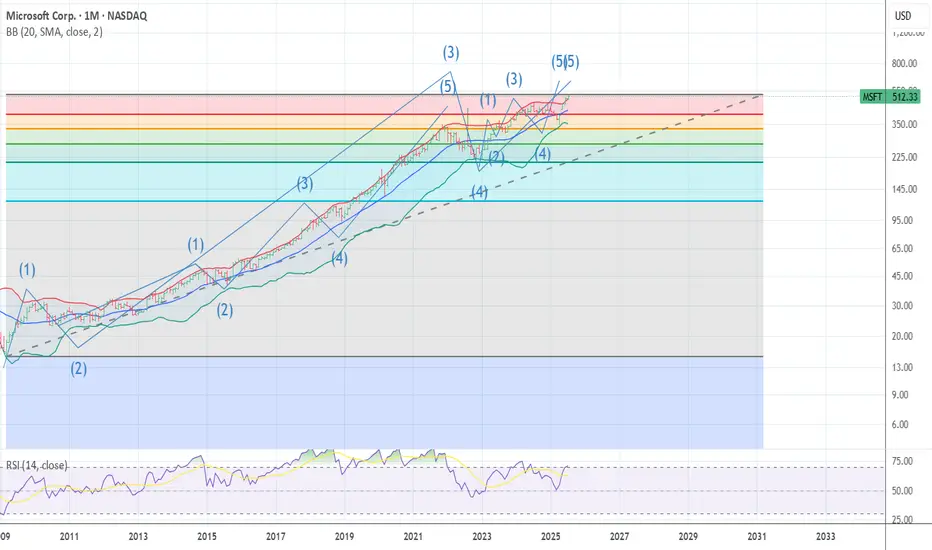
MSFT SUPER CYCLE WAVE 3 TOP MSFT The bell weather .Is now ending what looks to be the 5th wave for super cycle wave 3 top here from 518 to 525 from the 2009 low wave 2 . I am buying late 2027 525 puts Now the downside over the next 18 months is down near the previous wave 4 low 341 area I expect we will that at a min with odds as low as 222 . best of trades Wavetimer
TSLA WEEKLY OPTIONS SETUP
### 🚗 TSLA WEEKLY OPTIONS SETUP (2025-07-28)
**Big Call Flow. Low VIX. Can Bulls Hold \$325?**
---
📊 **Momentum Overview:**
* **Daily RSI:** 48.2 🔻 → *Neutral-to-Weak*
* **Weekly RSI:** 57.1 🔻 → *Still bullish zone, but falling*
⚠️ **Interpretation:** Momentum is softening, trend in question.
📉 **Volume Context:**
* **Volume Ratio:** 1.3x ⬆️ (vs. last week)
* **Price Change:** -0.77% despite that volume
🔍 *Distribution Alert:* Institutions may be selling into strength.
📈 **Options Flow:**
* **Call/Put Ratio:** **1.70** = 🚨 *Bullish flow confirmed*
* **Volatility (VIX):** 15.16 🟢 Favorable for directional plays
✅ Strong setup for options traders riding short-term momentum
---
### 🧠 **Weekly Sentiment Scorecard:**
* ✅ **Bullish Signals (2):** Options Flow, Volatility
* ⚠️ **Neutral Signals (2):** Daily & Weekly RSI
* ❌ **Bearish Signal (1):** Volume pattern = distribution risk
**Overall Bias:** 🟢 *Moderate Bullish*
---
### 🔥 **TRADE SETUP IDEA:**
🎯 **Strategy:** Long Call Option
* 📌 **Instrument:** TSLA
* 💵 **Strike:** \$355C
* 📅 **Expiry:** Aug 1, 2025
* 💸 **Entry:** \~\$0.75
* 🎯 **Profit Target:** \$1.50
* 🛑 **Stop Loss:** \$0.45
* 🔒 **Key Support to Watch:** \$327.50 — lose that = exit fast
📈 **Confidence Level:** 65%
⚠️ **Gamma Risk:** High → trade small, manage tight.
---
### 📦 TRADE\_DETAILS (JSON Format for Algo/Backtest):
```json
{
"instrument": "TSLA",
"direction": "call",
"strike": 355.0,
"expiry": "2025-08-01",
"confidence": 0.65,
"profit_target": 1.50,
"stop_loss": 0.45,
"size": 1,
"entry_price": 0.75,
"entry_timing": "open",
"signal_publish_time": "2025-08-01 09:30:00 UTC-04:00"
}
```
---
### 🧭 **Quick Notes for Traders:**
* ✅ Bulls have short-term edge — but **momentum is fading**
* ⚠️ If TSLA breaks below **\$325**, exit fast.
* 🔍 Watch for fakeouts: options flow is bullish, but volume says “not so fast.”
---
📊 TSLA \$355C → Risk \$0.75 to potentially double 📈
💬 Will this hold, or is it a bull trap before a dump? 👀
Comment below ⬇️ and follow for Monday updates!
---
**#TSLA #OptionsFlow #WeeklyTrade #TradingSetup #GammaRisk #AITrading #TeslaStock #UnusualOptionsActivity #SmartMoneyMoves**

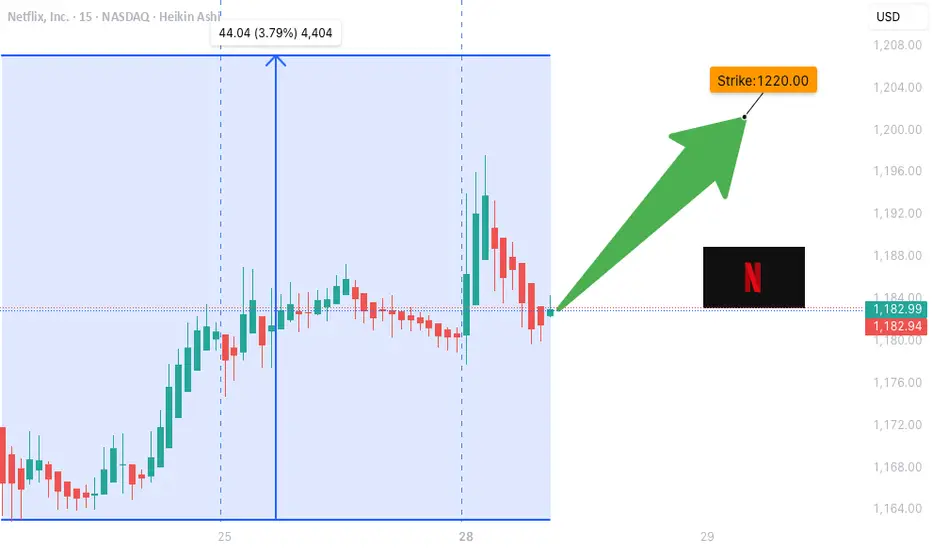
NFLX WEEKLY OPTIONS TRADE (07/28/2025)**🎬 NFLX WEEKLY OPTIONS TRADE (07/28/2025) 🎬**
**Institutions Are Buying Calls – Should You?**
---
📈 **Momentum Breakdown:**
* **Daily RSI:** Mixed ➡️ Possible short-term weakness
* **Weekly RSI:** Bullish bias intact ✅
🔥 Overall = **Moderate Bullish** trend confirmed on the **weekly timeframe**
📊 **Options Flow:**
* **Call/Put Ratio:** **2.23** 🚨
💼 Strong institutional call flow = **bullish bias** from big money
* **Strike Ideas from Models:**
* \$1260 (Grok/xAI)
* \$1230 (Gemini/Google)
* \$1220 (Meta)
* ✅ **\$1200** (Consensus Strike)
🧨 **Volume Warning:**
* 📉 Institutional participation is **lower than average**
* 🚫 Could signal weak follow-through or fading interest
---
🧠 **AI Model Consensus (Grok / Gemini / Claude / Meta / DeepSeek):**
✅ Call buying favored across the board
✅ Weekly bullish momentum confirmed
⚠️ Daily RSI & low volume = headwinds
📌 Play it smart: momentum’s real, but conviction isn’t maxed
---
💥 **RECOMMENDED TRADE (65% Confidence):**
🎯 **Play:** Buy CALL Option
* **Strike:** \$1200
* **Expiry:** 2025-08-01
* **Entry:** \~\$8.50
* **Profit Target:** \$16.00 → \$17.00
* **Stop Loss:** \$5.10
📆 Entry Timing: Monday market open
📏 Position Size: Risk-managed (2-4% portfolio)
---
⚠️ **RISK CHECKLIST:**
* 🟡 **Volume Fragility:** Institutions not fully loading
* 🟥 **Gamma Risk:** Expiry this week = possible sharp swings
* 🔴 **Daily RSI Divergence:** Short-term weakness still possible
---
📌 **TRADE DETAILS (JSON Format for Automation):**
```json
{
"instrument": "NFLX",
"direction": "call",
"strike": 1200.0,
"expiry": "2025-08-01",
"confidence": 0.65,
"profit_target": 16.00,
"stop_loss": 5.10,
"size": 1,
"entry_price": 8.50,
"entry_timing": "open",
"signal_publish_time": "2025-08-01 09:30:00 UTC-04:00"
}
```
---
**TL;DR:**
🟢 Weekly bullish setup with strong options flow
🟡 Daily weakness = proceed with discipline
🎯 \ NASDAQ:NFLX \$1200C for short-term momentum upside
💬 Are you following the institutions or fading the low volume?
\#NFLX #OptionsFlow #AITrading #WeeklySetup #InstitutionalMoney #TechStocks #UnusualOptionsActivity #TradingView #MomentumTrading
$AMD supercycle ; PT $300-350 by 2027- NASDAQ:AMD has likely entered a supercycle and we have entered Agentic AI world where inferencing is the main area of investment.
- Model Training is still important but we have entered a stage where lot of open source models and many proprietary vendors are close to each other when it comes to performance.
- Companies are trying to monetize their investments and one critical thing is model inference i.e making predictions.
- NASDAQ:AMD is poised for the agentic ai boom and therefore next 2 years are golden years for $AMD.
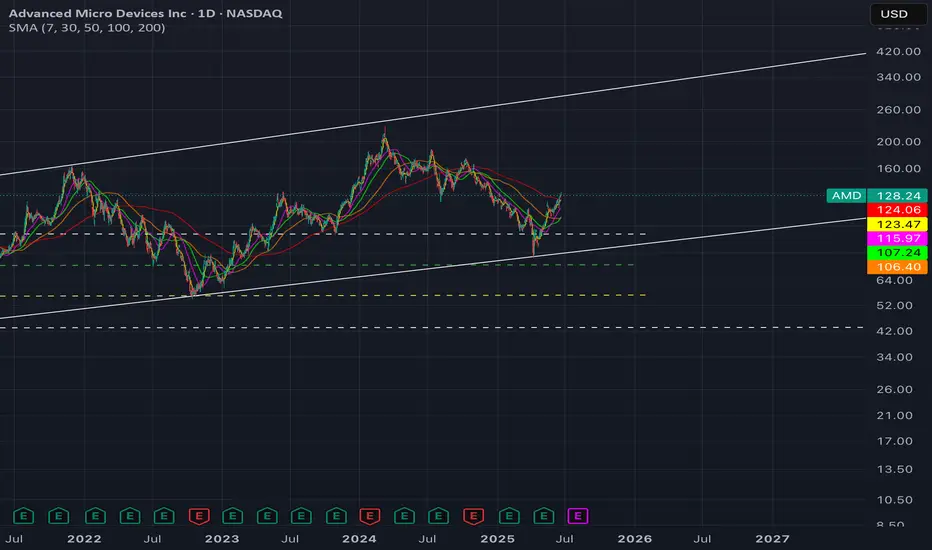
AMD coiling to $148-160 range by post-earnings- NASDAQ:AMD is one of the beaten down names. It's not too cheap at the current valuation but it's growth for upcoming 2-3 years are promising which deserves a higher multiple.
- 25%+ growth rate when revenue is in billions is a big deal unlike NASDAQ:PLTR which has high 20s % growth rate on a revenue of 250 mil a quarter.
- Technical supports strong rebound to 148-160 range to test 200 SMA. Good setup for Q1 2025.
- Downside risk is to 94-105 if it continues to meltdown.

PLTR WEEKLY TRADE IDEA (07/28/2025)
**🚀 PLTR WEEKLY TRADE IDEA (07/28/2025) 🚀**
**Momentum is 🔥 but Volume is the Missing Ingredient**
---
📈 **Momentum Snapshot:**
* **Daily RSI:** 71.9 ⬆️ (🚨 Overbought but still rising)
* **Weekly RSI:** 76.7 ⬆️ (📢 Clear Bullish Strength)
➡️ *Strong upside pressure, but entering the overbought zone*
📉 **Volume Insight:**
* Weekly Volume = **0.8x last week**
⚠️ *Weak institutional conviction during the breakout = yellow flag*
🔍 **Options Flow Check:**
* **Call/Put Ratio:** 1.09 = *Neutral*
➡️ Balanced flow = *no aggressive buying yet*
🌪️ **Volatility Environment:**
* **VIX = 15.4**
✅ Favorable for directional trades — low IV supports premium growth
---
📊 **Model Consensus Recap:**
✅ Bullish RSI momentum (unanimous)
✅ Volatility ideal for long calls
⚠️ Volume flagged as a concern by some models
📌 Final stance: **MODERATE BULLISH**
---
💥 **RECOMMENDED TRADE SETUP (Confidence: 65%)**
🎯 **Play:** Buy CALL Option
* **Strike:** \$167.50
* **Expiry:** Aug 1, 2025
* **Entry Price:** \~\$0.74
* **Profit Target:** \$1.48 (🟢 2x return)
* **Stop Loss:** \$0.37 (🔻-50%)
📆 **Entry Timing:** Market Open Monday
📦 **Size:** 1 Contract
---
⚠️ **Key Risks to Watch:**
* 📉 Weak volume = possible consolidation before next leg up
* ⏳ Premium decay risk into expiry
* 📊 No strong institutional footprint = stay nimble
---
📌 **JSON FORMAT TRADE DETAILS (Automation Ready):**
```json
{
"instrument": "PLTR",
"direction": "call",
"strike": 167.50,
"expiry": "2025-08-01",
"confidence": 0.65,
"profit_target": 1.48,
"stop_loss": 0.37,
"size": 1,
"entry_price": 0.74,
"entry_timing": "open",
"signal_publish_time": "2025-07-28 10:13:40 EDT"
}
```
---
🔥 TL;DR:
* Momentum is undeniable ✅
* Volume = suspect 🟡
* VIX = Green light for directional play ✅
💬 **\ NASDAQ:PLTR Bulls, are you ready or waiting for volume confirmation?**
\#PLTR #OptionsTrading #BullishSetup #UnusualOptions #MomentumPlay #TradingView #StockMarket

$F Iron Condor – Aug 1st Expiration | $7 Credit | I’m opening an Iron Condor on Ford ($F) with expiration on Friday, August 1st, 2025. The trade is based on the daily chart, using visible support/resistance levels to define the range. I selected strikes with approximately 0.15 delta on each side, giving the setup a high probability of success.
🔹 Total premium collected: $7 per contract
🔹 Stop loss: Defined at 50% of the premium collected (~$3.50)
🔹 Trade logic: We want $F to stay within the range throughout the week to let theta do its job.
🔹 Exit plan: If the price approaches either short strike, I will consider exiting at break-even or take a controlled loss.
This is a non-directional options strategy designed to benefit from time decay and low volatility. The setup is ideal for sideways price action, with no major catalysts expected during the week.
🎯 Target: Full profit if price stays within range until expiration.
❌ Stop: Exit if the price threatens any wing – max loss capped at 50% of the premium received.
This trade combines high probability with well-defined risk and is perfect for consistent weekly income when the market shows indecision or chop.

Much needed break for $BABA on the horizonI took a much needed break but not as long as NYSE:BABA has taken since 2021; swinging between ~$70 and ~$120 over the past six years.
I strongly suspect that this might have something to do with Jack Ma's speech in late 2024 that made him go 'missing' from public view
- www.wired.com .
The stock has formed a multi-year rounded bottom (cup) followed by a handle formation, a classic bullish reversal pattern. Price is currently consolidating just below the ~$123 resistance with a potential target of $143 - $170 if this breaks resistance.
I will hedge my bets on a bullish run and find support around $107 - $109 if the breakout is rejected.
NYSE:BABA is currently trading above the 50 and 200-week EMA and I see a potential golden cross forming in the coming days.
U.S - China relations still proves challenging but with earnings on the horizon I am optimistic that it will be the catalyst for this breakout.
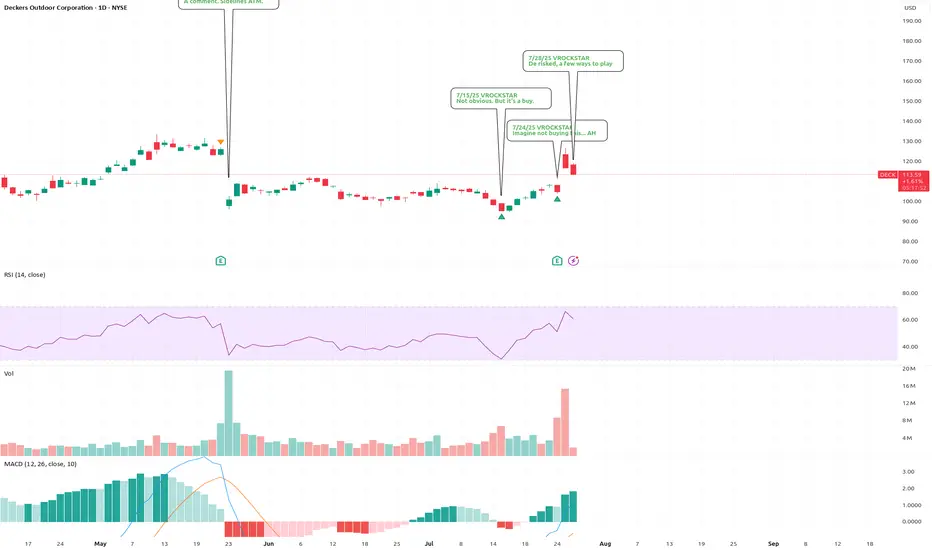
7/28/25 - $deck - De risked, a few ways to play7/28/25 :: VROCKSTAR :: NYSE:DECK
De risked, a few ways to play
- mid teens PE
- 2 brands hitting on all strides (pun intended)
- great result, everyone offsides
- the action you're seeing here is MM re-adjusting post pop
- can buy spot/ sell covered calls for healthy mid 40s IV and roll
- my sense is sub $110 you are getting almost a simple play into YE and anything lower is increasing value (mid singles FCF yield growing DD, "yes please")
- so yeah, i like NASDAQ:LULU b/c of the google trends and valuation etc. etc. (go check that one out before tradingview removes it a third time)
- but this one back in the sub $115 zone is comfy like an (h)ugg
V
IONQ Short, based off patternDouble top and a break of the downward neckline trendline looking to go further to 35ish and 29 ish.
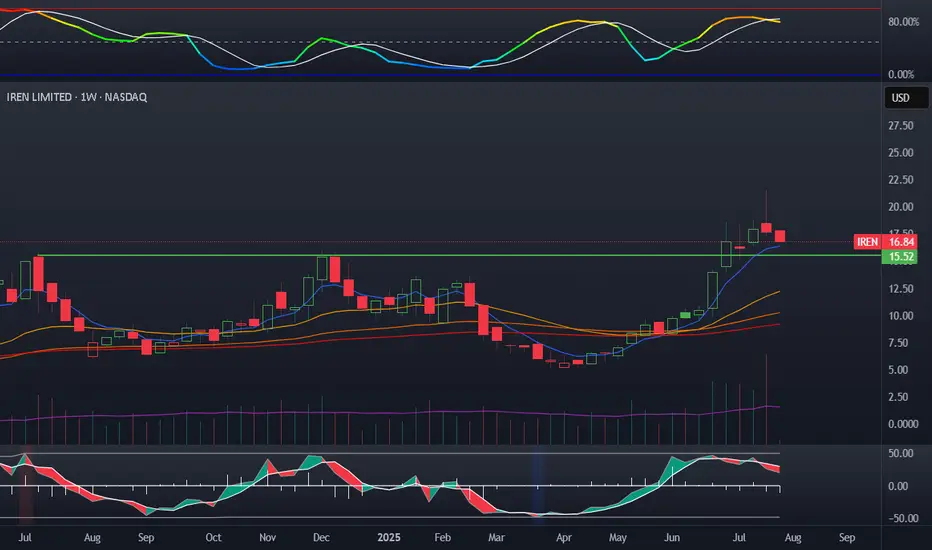
Iren approaches buy zoneIren has been a very hot stock the last few months. I have missed the entry so far, my plan is to enter on around the marked buy zone at the prior tops. This should flip to support at this point. Would love some more oscillators resets, need a few days.
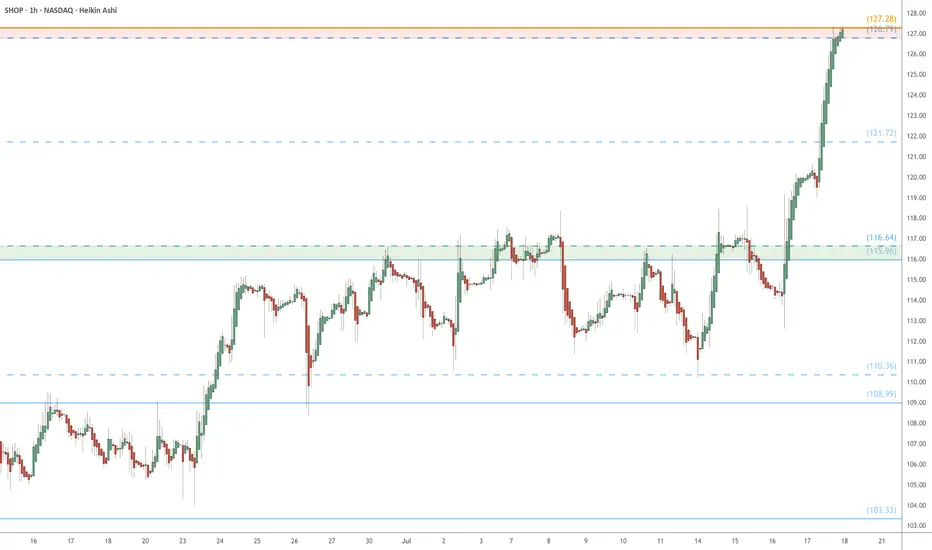
SHOP watch $126.79-127.28: Major Resistance may start a RetraceSHOP surged into a significant resistance at $126.79-127.28.
Zone of a Golden Genesis fib paired with a Covid Simulus fib.
Looking for a Break-n-Retest or Dip-to-Fib for long entries.
.
WBD double bottom ??? WBD is nicely breaking above resistance zone i think we will see more upside in the coming weeks i will updated later with some target but for now 16 to 19 is good

7/28/25 - $pltr - Profit taking into print7/28/25 :: VROCKSTAR :: NASDAQ:PLTR
Profit taking into print
- no idea what print brings
- but mgmt have been sell-only
- valuation is what it is... inexplicable by anyone
- i'd not be surprised to see anything happen on the result
- but into result, big holders (read: not you) are likely going to see some profit taking/ risk mgmt given tape, outperformance
- could be a good hedge against other risk-on
- and if tape does see risk off, -ve gamma/ reflexivity largest here
V

Incoming 40% correction for FacebookOn the above 10 day chart price action has rallied 500% since October 2022. It is somewhat unfortunate to see so many long ideas at the moment.
Motley Fool August 8th:
“Here's how Meta could achieve a $2 trillion valuation within three years, and if it does, investors who buy the stock today could earn a 67% return.”
Very misleading.
Why bearish?
Failed support. It is very clear to see, price action has broken through support and confirmed it as resistance. You can see this more clearly on the Log chart below.
Regular bearish divergence. Multiple oscillators now print negative divergence with price action across a 50 day period.
On the monthly chart below a hanging man candle print can be seen. Although the candle does not confirm until the end of the month there is a clear indication of buyer exhaustion. This is an important trend reversal indication.
Is it possible price action continues to rise? Sure.
Is it probable? No.
Ww
Log chart
Monthly hanging man candlestick

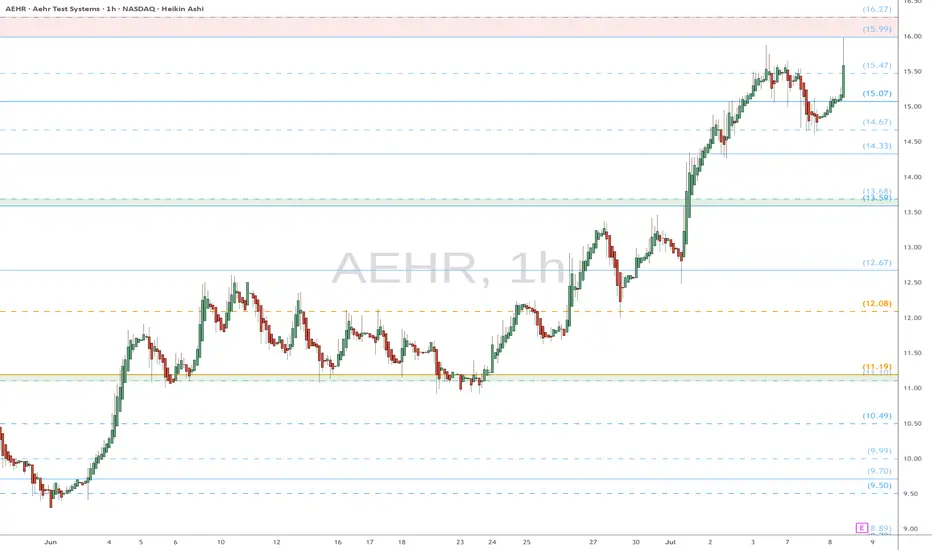
AEHR watch $15.99-16.27: Major Resistance may give a Dip BuyAEHR has been flying high with the general market.
Approaching a significant resistance into $16 round.
$15.99-16.27 is the exact zone of concern up here.
.
Previous analysis that caught the BreakOut:
===============================================
.
You know the rules: ride the pump, don’t marry it.Oh look, it's Nvni Group Limited, the stock that got drunk on volatility in May, passed out for two months, and now just woke up swinging again. 👀
Once the darling of degenerates back around Christmas Eve 2024 (yes, we remember), this little rascal dumped harder than your ex after New Year’s — but now it’s crawling back into relevance with a vengeance.
Current price: $0.5298
Volume’s heating up like it’s got something to prove — and guess what? It just might.
From the ashes of sub-20 cents, this ticker's been stair-stepping its way up in July, pretending it’s got real potential. Spoiler alert: The last time it pulled this move in May, it shot up like a meme on steroids… before crashing harder than FTX.

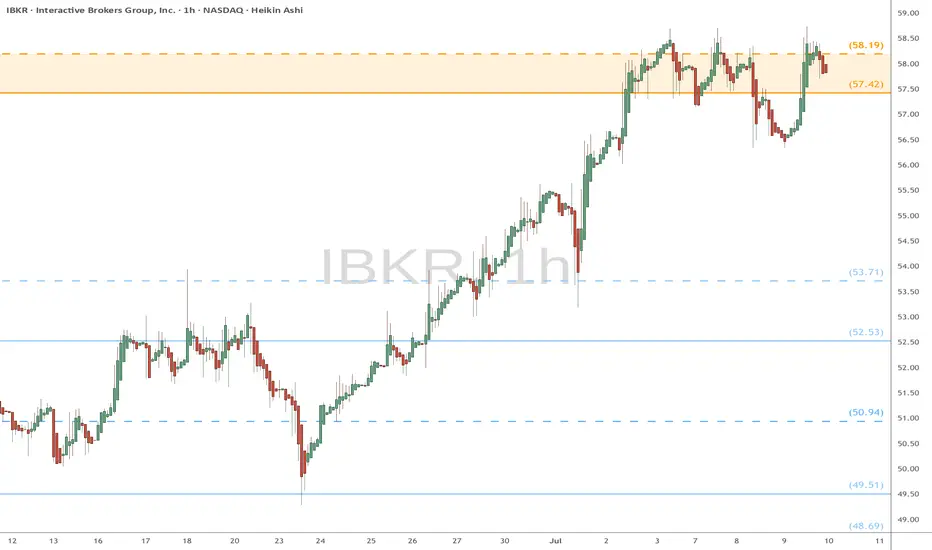
IBKR watch $57.42-58:19: Double Golden Fib zone holding in OrbitIBKR has been in a strong uptrend but now consolidating.
Currently orbiting a Double Golden zone $57.42-58.19
This could be a TOP or a ReCharge zone for next leg.