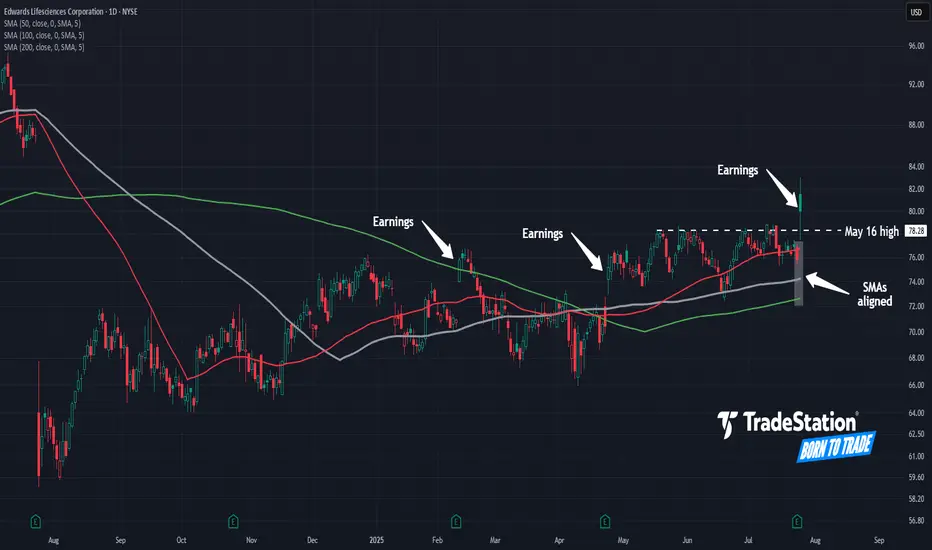
Edwards Lifesciences Enters the GapHealthcare has been the weakest sector in the past year, but some traders may expect a comeback in Edwards Lifesciences.
The first pattern on today’s chart is the breakout on Friday after earnings and revenue beat estimates. That rally brought EW into a bearish gap from one year ago.
Second is the May 16 high of $78.28. The heart-valve company spent more than two months mostly below that resistance, but now it’s been breached. Is there a confirmed breakout?
Third, the 50-day and 100-day simple moving averages (SMAs) crossed above the 200-day SMA in April. The 50-day SMA climbed above the 100-day SMA in May. Such an alignment, with the faster SMAs above the slower, may suggest a bullish trend is developing over the longer term.
Finally, the pair of bullish gaps after the previous earnings reports in February and April could reflect improving sentiment toward the company’s fundamentals.
TradeStation has, for decades, advanced the trading industry, providing access to stocks, options and futures. If you're born to trade, we could be for you. See our Overview for more.
Past performance, whether actual or indicated by historical tests of strategies, is no guarantee of future performance or success. There is a possibility that you may sustain a loss equal to or greater than your entire investment regardless of which asset class you trade (equities, options or futures); therefore, you should not invest or risk money that you cannot afford to lose. Online trading is not suitable for all investors. View the document titled Characteristics and Risks of Standardized Options at www.TradeStation.com . Before trading any asset class, customers must read the relevant risk disclosure statements on www.TradeStation.com . System access and trade placement and execution may be delayed or fail due to market volatility and volume, quote delays, system and software errors, Internet traffic, outages and other factors.
Securities and futures trading is offered to self-directed customers by TradeStation Securities, Inc., a broker-dealer registered with the Securities and Exchange Commission and a futures commission merchant licensed with the Commodity Futures Trading Commission). TradeStation Securities is a member of the Financial Industry Regulatory Authority, the National Futures Association, and a number of exchanges.
TradeStation Securities, Inc. and TradeStation Technologies, Inc. are each wholly owned subsidiaries of TradeStation Group, Inc., both operating, and providing products and services, under the TradeStation brand and trademark. When applying for, or purchasing, accounts, subscriptions, products and services, it is important that you know which company you will be dealing with. Visit www.TradeStation.com for further important information explaining what this means.
Apple Is Down YTD Ahead of Earnings. What Does Its Chart Say?Apple NASDAQ:AAPL will report earnings Thursday at a time when the tech giant has been struggling more than most other "Magnificent Seven" stocks or higher-end, AI-focused companies. What does fundamental and technical analysis say about AAPL heading into the report?
Let's see:
Apple's Fundamental Analysis
Apple was down 14.4% year to date as of Friday's close, while the S&P 500 was up 8.6%.
Meanwhile, fellow Mag-7 members Nvidia NASDAQ:NVDA and Microsoft NASDAQ:MSFT -- the only publicly traded U.S. companies other than Apple with more than a $3 trillion market cap -- are up 29.2% and 21.9%, respectively.
AAPL has lagged largely because the consumer-electronics giant has dragged its feet on innovation, as well as on the great chase into the world of generative artificial intelligence.
Readers might recall that back in early May, Apple's board increased the firm's dividend payout and authorized a whopping $100 billion share-repurchase program in an attempt to attract investment. But so far, that hasn't seemed to impress Wall Street much.
As for Apple's upcoming fiscal Q3 earnings, the Street is looking for the company to post $1.42 a GAAP EPS of $1.42 on some $89 billion of revenue.
That would represent 1.4% earnings growth and 3.7% better revenues from the $1.40 EPS on $85.8 billion of revenues that the iPhone maker reported in the same period last year.
If this sounds like weak growth, it is. Apple saw 6% year-over-year growth during fiscal Q2 2025, as well as 4.9% in fiscal Q3 2024.
In fact, 20 of the 29 sell-side analysts that I found that cover AAPL lowered their earnings estimates lower for the fiscal Q3 since the period began. (Five have boosted their numbers, while four have made no changes.)
Apple's Technical Analysis
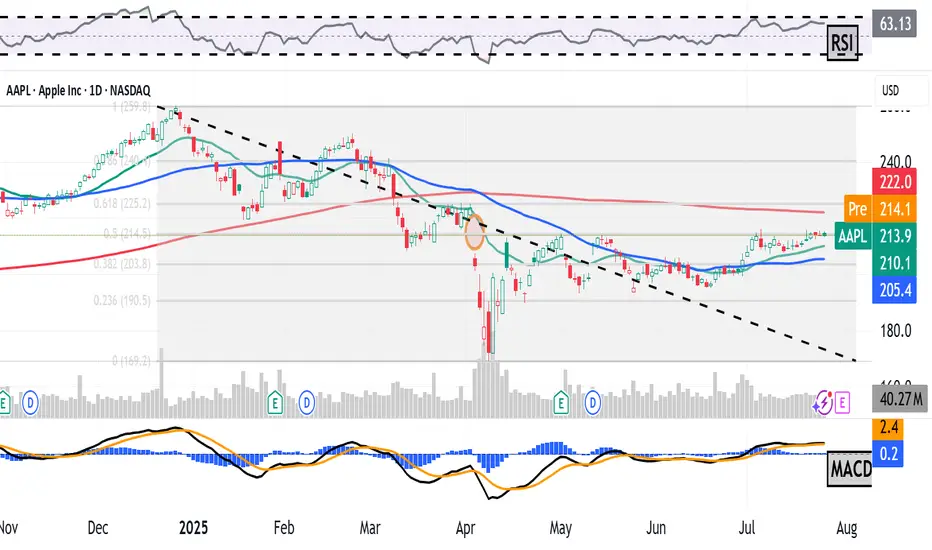
Now let's look at Apple's chart going back to November:
Readers will see that the stock appears to be at a crossroads.
On one hand, Apple developed a "triple-top" pattern of bearish reversal beginning in early May, as marked with red boxes at the above chart's right.
A triple top occurs when a "double-top" pattern fails and a stock retests its resistance from below for a third time.
However, we can see at the chart's extreme right that AAPL has just about reached its resistance level for a fourth time.
What now? Often when someone knocks on a door often enough, that door will open.
Perhaps even more interestingly, we can see that Apple's roughly $215 resistance level (vs. the $213.88 AAPL closed at Friday) appeared at almost precisely the 50% retracement point of the stock's December 2024-April 2025 sell-off.
Note that while they're included with most Fibonacci retracement models, 50% retracements aren't true Fibonacci levels. They are their own thing, but just as technically noteworthy.
All in, Apple now has two potential upside pivots.
One would be the break above the apex of the pattern that's in place. The other would be Apple's 200-day Simple Moving Average (or "SMA," marked with a red line above.)
That creates a potentially bullish set-up. Apple could see support from both its 21-day Exponential Moving Average (or "EMA," denoted with a green line above) and from its 50-day SMA (the blue line above). That's likely where we'll find out if professional managers are willing to defend the stock.
Meanwhile, Apple's Relative Strength Index (or "RSI," marked with a gray line at the chart's top) is robust, but not in a technically overbought state.
Similarly, the stock's daily Moving Average Convergence Divergence indicator (or "MACD," denoted with black and gold lines and blue bars at the chart's bottom), has a bullish look to it, but not overwhelmingly so.
The histogram of Apple's 9-day EMA (the blue bars) is above zero, which is historically a short-term positive signal.
Additionally, both the 12-day EMA (black line) and 26-day EMA (gold line) are above zero, with the black line above the gold line. That's traditionally a short- to medium-term positive signal as well.
Still, it's what happens at that fourth top in the above chart that will likely decide Apple's fate technically.
(Moomoo Technologies Inc. Markets Commentator Stephen “Sarge” Guilfoyle had no position in AAPL at the time of writing this column.)
This article discusses technical analysis, other approaches, including fundamental analysis, may offer very different views. The examples provided are for illustrative purposes only and are not intended to be reflective of the results you can expect to achieve. Specific security charts used are for illustrative purposes only and are not a recommendation, offer to sell, or a solicitation of an offer to buy any security. Past investment performance does not indicate or guarantee future success. Returns will vary, and all investments carry risks, including loss of principal. This content is also not a research report and is not intended to serve as the basis for any investment decision. The information contained in this article does not purport to be a complete description of the securities, markets, or developments referred to in this material. Moomoo and its affiliates make no representation or warranty as to the article's adequacy, completeness, accuracy or timeliness for any particular purpose of the above content. Furthermore, there is no guarantee that any statements, estimates, price targets, opinions or forecasts provided herein will prove to be correct.
Moomoo is a financial information and trading app offered by Moomoo Technologies Inc. In the U.S., investment products and services on Moomoo are offered by Moomoo Financial Inc., Member FINRA/SIPC.
TradingView is an independent third party not affiliated with Moomoo Financial Inc., Moomoo Technologies Inc., or its affiliates. Moomoo Financial Inc. and its affiliates do not endorse, represent or warrant the completeness and accuracy of the data and information available on the TradingView platform and are not responsible for any services provided by the third-party platform.
McGrath RentCorp (MGRC) Expands Modular SolutionsMcGrath RentCorp (MGRC) is a business-to-business rental services company that provides modular buildings, portable storage, electronic test equipment, and liquid containment solutions. Serving industries like education, construction, and energy, MGRC delivers flexible, scalable infrastructure when and where it’s needed. The company’s growth is driven by rising infrastructure projects, expanding demand for temporary space, and steady recurring rental revenue.
On the chart, a confirmation bar with increasing volume highlights bullish momentum. The price has moved into the momentum zone after breaking above the .236 Fibonacci level. A trailing stop can be set just below that level using the Fibonacci snap tool to protect profits while giving the trade room to run.

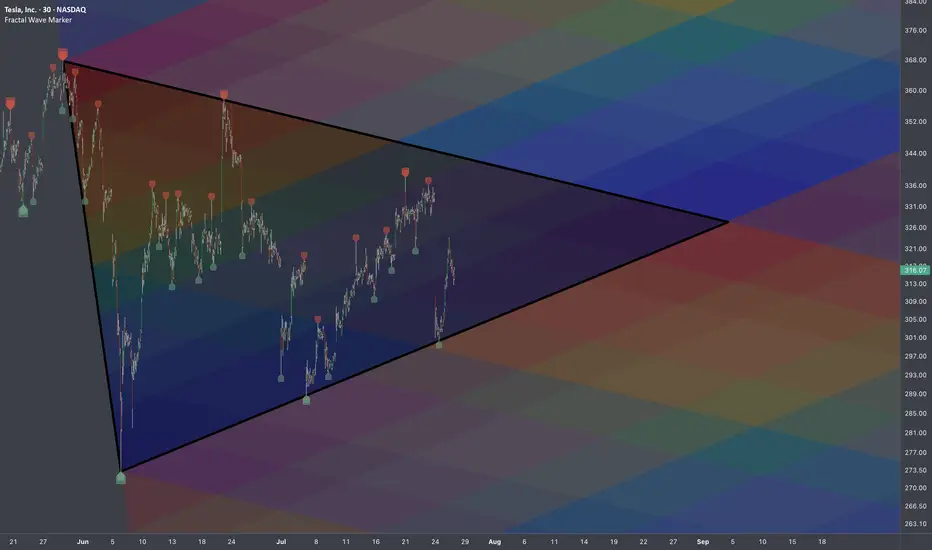
$TSLA: Breakout Wave Dimensions🏛️ Research Notes
Apart from known compression patterns for Tesla, there is another squeeze happening on smaller scale:
That area will be processed to derive the chart-based levels and see how market reacts to them.
Triangle
Breakout Expansion
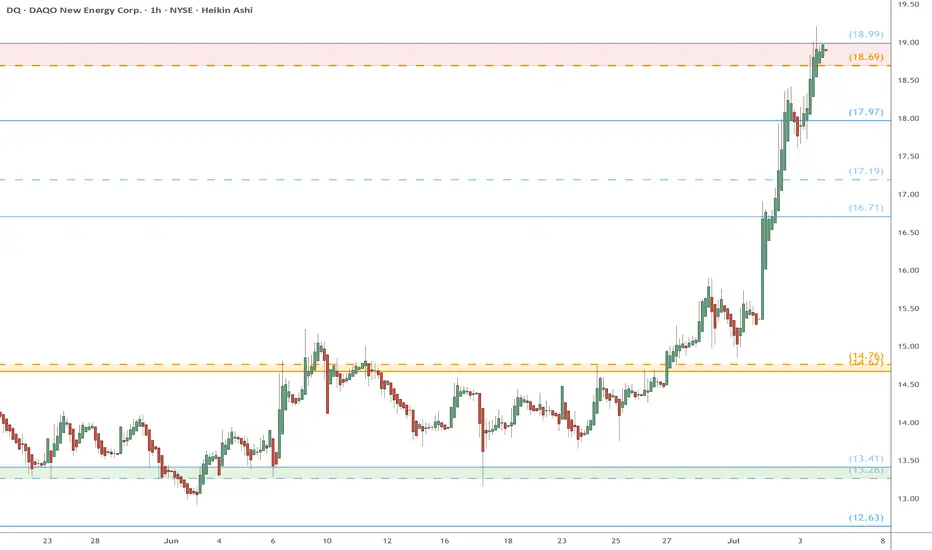
DQ heads up into $19: Major Resistance to book some profitsDQ has been flying off our bottom call (see below).
Now testing a major resistance zone at $18.69-18.99
Good spot to book some profits and look for a dip to buy.
.
Previous analysis that called the BOTTOM:
===================================================
.
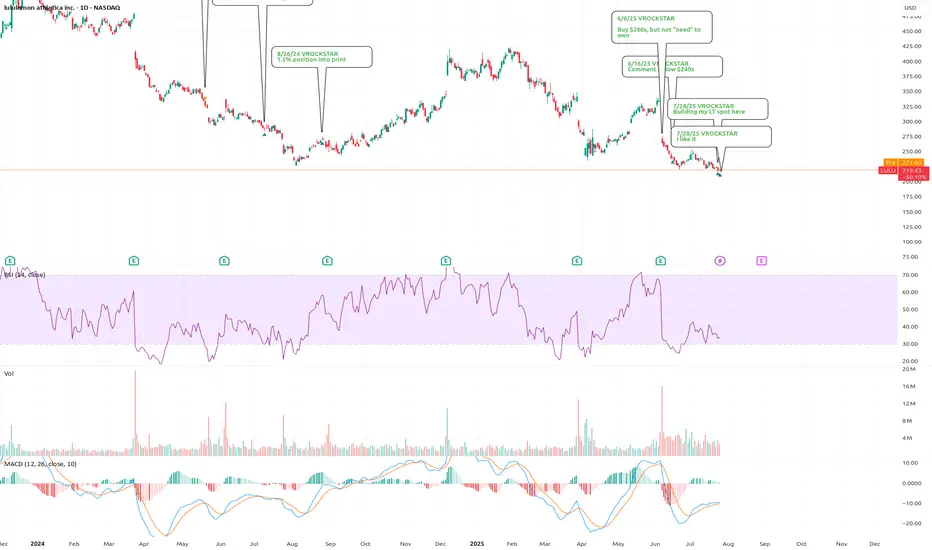
7/28/25 - $lulu - and goodbye7/28/25 :: VROCKSTAR :: NASDAQ:LULU
I like it
Apparently i can't post my thoughts anymore w/o it being flagged. so what's the point?
And i don't play stupid games and win stupid prizes... so goodbye public notes. ez decision.
Also... purely technical analysis will go the way of AI. So beware. Learn to think independently without just drawing lines on charts like 99.999% of content here. there r other places where people post more thoughtful fundamental analysis.
in the meanwhile this is the chart i thought might be helpful for anyone looking at $lulu. i literally post this for the last time... because, well, i think it's a helpful data pt.
the chart i'm trying to post now the 3rd time...
V
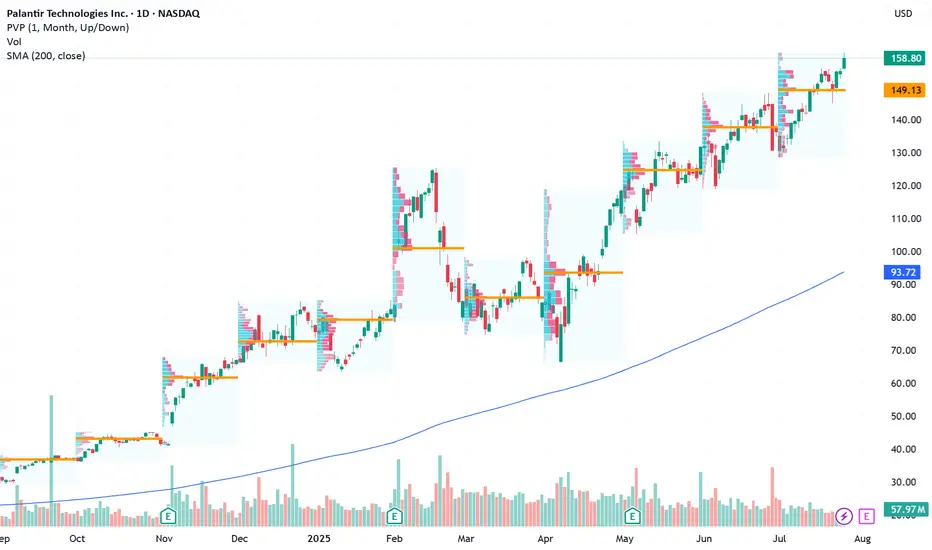
Palantir Technologies (PLTR) Shares Surpass $160Palantir Technologies (PLTR) Shares Surpass $160 for the First Time
Shares of Palantir Technologies (PLTR), a company specialising in big data analytics software, have continued their impressive performance. Following an extraordinary rally of approximately 340% in 2024, the stock remains among the top performers in the equity market:
→ since the beginning of 2025, the share price has climbed by approximately 113%;
→ on Friday, PLTR set another all-time high, with the share price exceeding $160 for the first time.
What Is Driving Palantir Technologies (PLTR) Higher?
The bullish sentiment is underpinned by the following factors:
→ Major partnerships. Among the contracts are an agreement with the US Army to develop a command system, collaboration with Accenture Federal Services, and many others.
→ Positive analyst outlooks , highlighting Palantir’s unique growth model and high margins. Analysts at Piper Sandler have set a price target of $170 for PLTR, while Wedbush recently raised their target to $160.
In addition, investors are looking ahead with optimism to the upcoming quarterly report scheduled for 4 August, which is expected to reinforce Palantir’s leadership position in a market increasingly driven by AI technologies.
Technical Analysis of Palantir Technologies (PLTR) Chart
Price action has formed an ascending channel (shown in blue), with a notable bullish pattern: each pullback (marked with arrows) has been followed by:
→ a lack of further downside momentum;
→ a rebound above the level where the decline began.
From a sentiment perspective, it is reasonable to infer that price dips are perceived not as warning signs, but as opportunities to accumulate a high-performing stock at a relative discount.
Given these factors, we expect that the upcoming earnings report could propel PLTR shares towards the upper boundary of the blue channel.
This article represents the opinion of the Companies operating under the FXOpen brand only. It is not to be construed as an offer, solicitation, or recommendation with respect to products and services provided by the Companies operating under the FXOpen brand, nor is it to be considered financial advice.

PayPal’s Stablecoin Ambitions Falter Ahead of Earnings ReportWhen PayPal launched its own stablecoin PYUSD in August 2023, the move was seen by many as a bold step toward dominating the digital payments space. However, nearly two years later, PYUSD has yet to meet expectations. Its market share remains minimal, trading volume is weak, and trust from the DeFi community is limited — all while PayPal’s next earnings report looms and investor pressure mounts.
What’s the issue?
According to data from DefiLlama and CoinGecko, PYUSD’s market cap stands at just over $400 million, despite high-profile marketing campaigns and its integration with Venmo. In comparison, USDT has surpassed $110 billion in circulation, and USDC stands at around $32 billion. PYUSD hasn’t even broken into the top five stablecoins on Ethereum by trading activity.
A key problem is low liquidity and limited DeFi adoption. Although PYUSD is available on several decentralized exchanges (DEXs), it often suffers from high slippage. Moreover, PayPal operates under strict regulatory scrutiny as a public fintech company, limiting its ability to innovate or respond rapidly to market trends.
Why earnings matter
PayPal’s Q2 earnings report is expected next week, and investors will be closely watching not only core metrics like revenue and profit but also figures related to its Web3 and digital asset initiatives. With PYUSD underperforming, pressure is building for PayPal to justify its continued push into the crypto space.
There is growing speculation that the company may consider partnering with an established stablecoin provider or even abandoning PYUSD in favor of a white-label solution — a move that could realign its Web3 roadmap.
The strategic lens
Despite current struggles, PayPal still has the brand and user base to play a significant role in digital finance. However, as DLT analysts emphasize, a stablecoin is more than a payment tool — it’s infrastructure. Success depends on liquidity, trust, and deep integration within the DeFi ecosystem. Without robust adoption across chains and use cases, PYUSD risks becoming an internal-only solution with limited external relevance.
Unless the earnings report reveals a strategic pivot or new partnerships, investors may interpret PYUSD as a lost opportunity rather than a long-term asset.

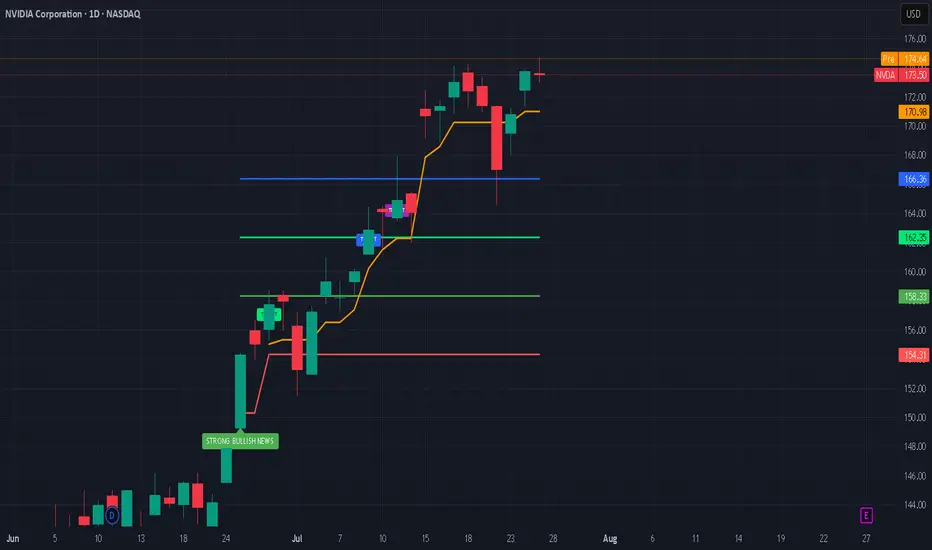
Nvidia’s Historic 2025 Stock Rally: What’s Driving It?Nvidia’s stock has once again captivated Wall Street in 2025, breaking records and fueling debates on whether its blistering momentum will continue or eventually ease. Here’s an in-depth look at why Nvidia is surging, the key drivers behind the rally, and what the long-term future could hold.
Nvidia’s Stock Rally: By the Numbers
As of July 2025, Nvidia stock has rallied more than 39% year-to-date, reaching new all-time highs above $170 and propelling the company’s market cap past $4 trillion, the largest in the world.
The stock has added nearly $2 trillion in valuation since April, outpacing tech giants like Microsoft and Apple.
Analyst price targets for the rest of 2025 vary: the average ranges from ~$174 to ~$235, with bullish forecasts up to $250 and more cautious targets down to $135.
What’s Powering the Rally?
1. Surging AI Demand:
Nvidia remains at the center of the artificial intelligence (AI) boom. Its graphics and AI accelerator chips (notably the new Blackwell AI family) are the backbone of AI infrastructure for Global Tech firms (Amazon, Meta, Microsoft, Google) and cloud service providers. This AI-centric demand has kept revenue growth robust and margins high (approaching 70%).
2. Easing China Trade Fears:
Earlier in 2025, U.S.–China export controls severely restricted Nvidia’s sales of advanced AI chips like the H20 to Chinese customers, causing a temporary selloff. However, a subsequent pause on tariffs by the U.S. and optimism about renewed China shipments reignited investor confidence, helping reverse earlier losses and extending the rally.
3. Massive Tech Investment Cycle:
The global rush to build out AI infrastructure is bringing huge investments from U.S. and international hyperscalers. Meta and Amazon alone have announced plans to pour “hundreds of billions” into AI data centers, much of it destined for Nvidia-powered hardware.
4. Strong Fundamentals and Diversification:
Nvidia sports some of the highest profit margins among mega-cap tech stocks. Its free cash flow, dominant market share, and expanding ecosystem, including platforms like Omniverse (for 3D and digital twins) and Drive (autonomous vehicles)—cement its leadership well beyond just chips.
What Could Slow Nvidia Down?
Despite the excitement, several risks linger:
Valuation Concerns: Nvidia trades at a premium (P/E above 50 for trailing earnings), raising worries of a pullback if growth slows.
Geopolitical and Regulatory Threats: Further U.S.-China tensions, new export regulations, or rising competition from rivals like AMD, Huawei, or custom silicon at cloud giants could erode growth or margins.
Cyclicality of the AI Boom: Some market watchers worry that AI infrastructure spending could prove cyclical, making Nvidia’s revenue growth more volatile in future years.
The Long-Term Outlook (2025 & Beyond)
Bullish Case: Most analysts expect continued dominance for Nvidia as AI, autonomous vehicles, robotics, and edge computing keep growing exponentially. Price targets range as high as $250 for 2025, climbing to $1,000+ by 2030 if AI adoption continues its rapid expansion.
Base Case: Moderate growth continues into 2026–2027, with a price target cluster around $180–$235 (2025) and $200–$428 (2027), assuming AI demand moderates, margins remain stable, and Nvidia fends off competitive threats.
Bearish Case: If U.S.-China relations sour and hyperscaler spending slows, the stock could retest support levels ($135–$150). However, few analysts expect a sustained collapse unless there is a fundamental change in AI or chip technology trends.
#nvda #stockmarket #finance #revenue #profit #financials #economy #technology #ai #chips
Bullish moveI see the setup is confirmed and price may boom in the next couple of weeks.
ABER, as always price do whatever it likes, it might go down deeper for more liquidity from range 3.0$ and 2.8 $
Be cautious, this is not a financial advice, share me your thoughts.

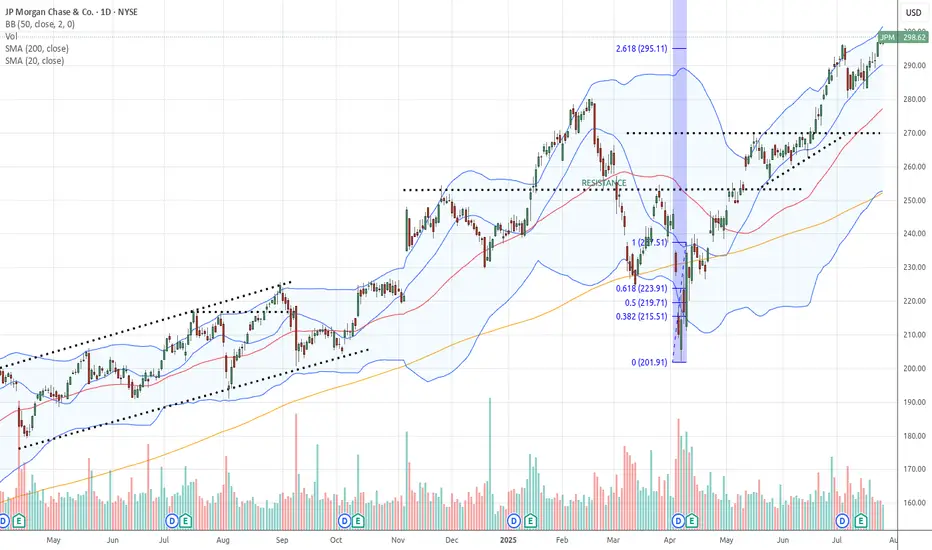
$JPM Tradespoon – Long Entry $296.36Tradespoon model generated long signal for NYSE:JPM . Predicted range: $296.36–$298.79. Trend: +0.10%. NYSE:JPM
Is it a time for BlackBerry? Potential 30% profit - 5.20 USD
The analysis of the BlackBerry Limited (BB) chart suggests a potential price increase to the 5.20 USD level. The current price is approximately 3.91 USD, and the chart shows a recent bounce from support in the 3.70-3.80 USD range, which may indicate the start of a new upward trend. The moving averages (MA) point to a previous upward impulse, and the current levels could serve as a launchpad for further growth. If demand holds, the price may break through the resistance around 4.50 USD and head toward 5.20 USD, aligning with previous peaks. However, it’s important to monitor volume and the reaction at the 4.50 USD level to confirm the trend's strength. Additionally, in 2025, there have been speculations about the brand’s potential return to the mobile market with new smartphones featuring physical QWERTY keyboards and modern features such as AMOLED screens, 12 GB RAM, and 5G connectivity, sparking interest and hope among fans (information from March 2025). Furthermore, recent data indicates a rise in stock performance, with the price reaching 7.53 USD, reflecting a 36.66% increase since the beginning of the year (as of February 12, 2025).
Potential TP: 5.20 $

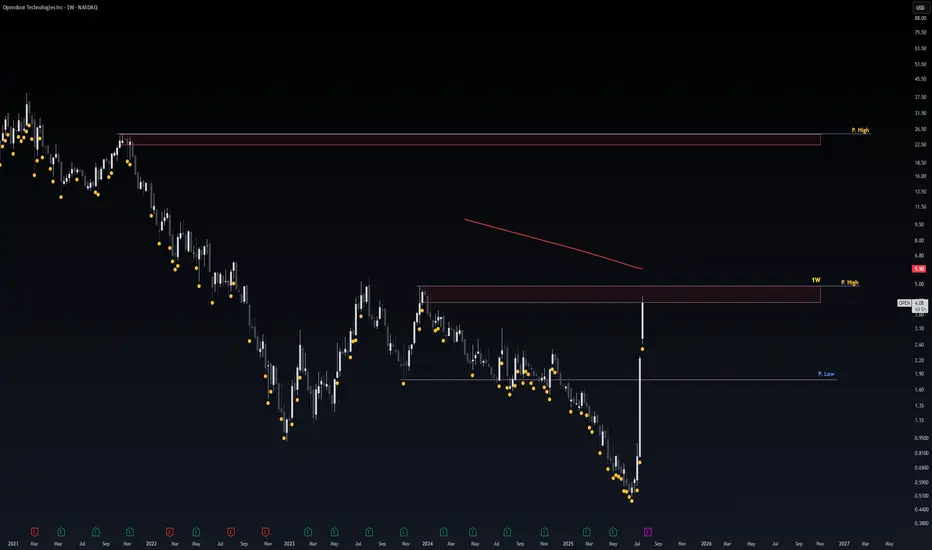
OPEN Risky AF!Sharing my crazy Thoughts ._.
the blue Lines Aka Red Zones consider As Strong Major Resistances and price will respect it !
Either by price Re-test or Reject.
Pink Line Consider As Strong Support level.
MY scenario of upcoming Days.
Stock Reject by Blue Line. and Re-test Pink Line as the support level.
Although anything in between happens i update.
Tesla Stock in Bearish Trend - Further Downside ExpectedTesla Stock in Bearish Trend - Further Downside Expected
Tesla's (TSLA) stock price continues to display a clear bearish trend structure, characterized by the formation of consistent lower lows and lower highs on the price chart. This technical pattern suggests sustained selling pressure and indicates the downtrend will likely persist in upcoming trading sessions.
Key Technical Observations:
- Established Downtrend: The consecutive lower highs and lows confirm the bearish price structure remains intact
- Weak Momentum: Each rally attempt has failed to gain traction, meeting selling pressure at progressively lower levels
- Critical Price Levels: The stock has established well-defined resistance and support zones for traders to monitor
Price Projections:
- Downside Target at $272: The bearish momentum could drive TSLA toward the $272 support level, representing a potential 15% decline from current levels
- Key Resistance at $370: Any recovery attempts will likely face strong selling pressure near the $370 level, which now serves as a major resistance barrier
Market Implications:
1. Bearish Continuation Expected: The prevailing trend structure favors further downside unless a significant reversal pattern emerges
2. Breakdown Risk: A decisive move below current support levels could accelerate selling momentum toward $272
3. Short-Term Rally Potential: While the overall trend remains down, temporary rebounds toward $370 may present selling opportunities
Trading Considerations:
- Short Positions: Consider maintaining bearish exposure while price remains below the $370 resistance level
- Stop Loss: A sustained break above $370 would invalidate the immediate bearish outlook
- Profit Targets: $272 serves as the primary downside objective, with potential support levels to watch along the way
Risk Factors to Monitor:
- Market sentiment shifts in the EV sector
- Changes in Tesla's production/delivery outlook
- Broader market conditions affecting tech/growth stocks
The technical setup suggests Tesla shares remain vulnerable to further declines, with $272 emerging as the next significant downside target. Traders should watch for either confirmation of the bearish continuation or potential reversal signals near key support levels. As always, proper risk management remains essential when trading in trending markets.

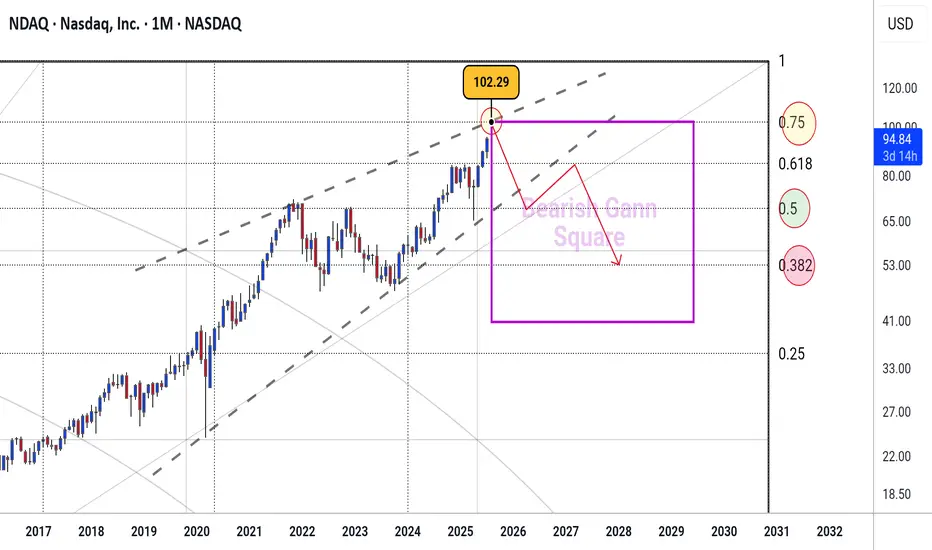
NDAQ #001 ( Say Goodbye to Nasdaq Market !!! ) Hello dear traders.
Good days.
First of all thanks for your comment and support.
------------ ---------------- --------------
Today I want to analysis Nasdaq Market which on monthly Gann Square which is grown up highly close to the 0.75 Monthly Gann Box price level .
I can see sharp rises to fill 0.75 Gann Box ( which is about 102.2 ) befor collaps .
In other words you can see a rising wedge formed which is a sign of correction .
Analysis and road map is plotted with Gann Square.
Good luck and safe trades.
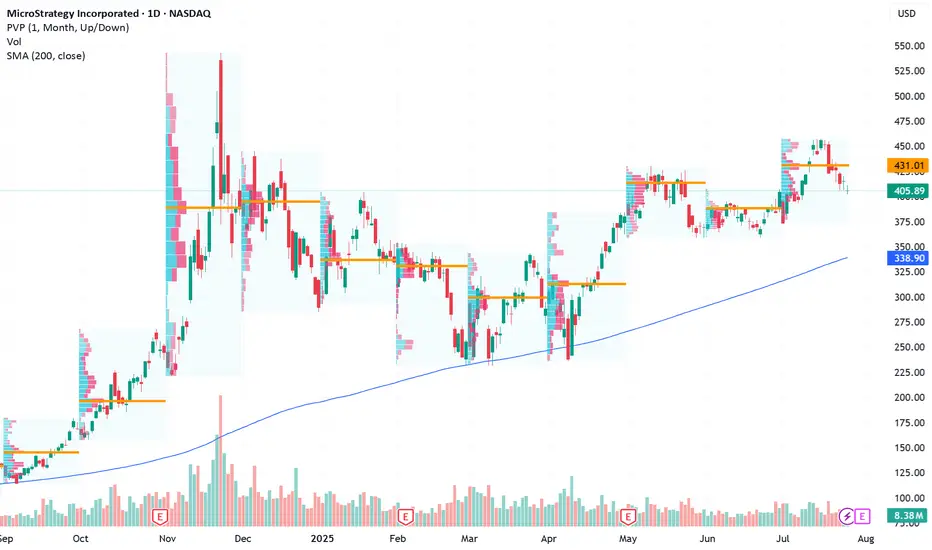
Long-Term Bitcoin Proxy Positioned for Next Upside RallyCurrent Price: $405.89
Direction: LONG
Targets:
- T1 = $418.50
- T2 = $425.99
Stop Levels:
- S1 = $399.50
- S2 = $386.20
**Wisdom of Professional Traders:**
This analysis synthesizes insights from thousands of professional traders and market experts, leveraging collective intelligence to identify high-probability trade setups. The wisdom of crowds principle suggests that aggregated market perspectives from experienced professionals often outperform individual forecasts, reducing cognitive biases and highlighting consensus opportunities in MicroStrategy.
**Key Insights:**
MicroStrategy is uniquely positioned as the largest corporate Bitcoin holder, meaning its stock price is closely tied to Bitcoin's movements. The company holds over 68,000 BTC, making it a favored choice for investors aiming to benefit from Bitcoin's potential breakout. Recent bullish market sentiment and positive institutional positioning in cryptocurrency-related equities add strength to the Long scenario.
Short-term price metrics also confirm a bullish bias, with options flows targeting calls and aggressive price strikes above current levels. However, flexibility is required as Bitcoin remains highly volatile ahead of macroeconomic shifts and Bitcoin-specific technical resistance levels.
**Recent Performance:**
MicroStrategy's stock has gained momentum over the past month, trading in tandem with Bitcoin's recent stability in the $27,000-$28,000 range. Last week, MicroStrategy saw increased interest among institutional investors, as options targeting a sharp rally were opened at key resistance levels. This suggests confidence among professional traders about crypto recovery prospects.
**Expert Analysis:**
Analysts argue the stock could serve as a leveraged play on Bitcoin’s trajectory, especially during bullish setups like MicroStrategy’s upcoming quarterly reports. Some experts point to Bitcoin’s struggle to break above $30,000 as an immediate risk, yet highlight MicroStrategy’s firm association with Bitcoin as an advantage. Beyond crypto exposure, MicroStrategy’s operational restructuring and debt management efforts further bolster its appeal as a dual-tech and crypto equity.
**News Impact:**
MicroStrategy’s long-term strategy continues to blend Bitcoin maximization with tech-driven operational focus. Recent comments from management emphasize continued cryptocurrency accumulation despite market fluctuations, securing its place as a pro-Bitcoin institutional equity. The upcoming earnings report could provide deeper insights into strategic moves for 2024, driving a post-earnings rally.
**Trading Recommendation:**
MicroStrategy presents a compelling buy opportunity for investors betting on Bitcoin-led equity rallies. Technical setups align with improving sentiment and disruptive news catalysts around macroeconomic policies supporting crypto stability, triggering higher upside potential. Long setups above $405.89 show bullish targets to $418.50 and $425.99, while flexible stop placements provide downside protection amidst broader Bitcoin resistance risks.
Long Setup for Continued Growth Potential Next WeekCurrent Price: $158.80
Direction: LONG
Targets:
- T1 = $162
- T2 = $166
Stop Levels:
- S1 = $157
- S2 = $153
**Wisdom of Professional Traders:**
This analysis synthesizes insights from thousands of professional traders and market experts, leveraging collective intelligence to identify high-probability trade setups. The wisdom of crowds principle suggests that aggregated market perspectives from experienced professionals often outperform individual forecasts, reducing cognitive biases and highlighting consensus opportunities in Palantir Technologies.
**Key Insights:**
Palantir Technologies has demonstrated remarkable resilience and strong market momentum, reflected in its substantial surge since early-year lows. Significant investor enthusiasm, coupled with robust fundamentals, has propelled the stock to all-time highs, suggesting further upside potential. Traders should monitor key levels at $160 (resistance) and $155 (support) to identify promising entry and profit-taking opportunities. Additionally, consistent earnings growth and strategic partnerships continue to enhance Palantir's attractiveness as a long-term play.
**Recent Performance:**
Palantir closed its last trading session with positive upward momentum, gaining +2.54% and marking a new high close. Its performance outpaces broader indices during the same period, demonstrating technical strength and sustained investor confidence. With steady gains and consistent returns through volatile markets, Palantir remains a compelling trade for growth-oriented investors.
**Expert Analysis:**
Analysts remain cautiously optimistic about Palantir’s near-term trajectory, emphasizing its resilience and growth-driven attributes. Predictions suggest potential sideways movement in the coming sessions, making pullbacks attractive for entry ahead of further bullish momentum. A strong earnings pattern and investor-driven rallies underpin expert calls for sustained upside potential, aligning it with other high-growth equities in the technology space.
**News Impact:**
Recent developments, including key advancements in Palantir's technology initiatives and strategic partnerships, have fueled market enthusiasm. Strong retail interest, coupled with favorable earnings updates, reinforces the stock's position as a favored choice among traders and investors seeking high-growth opportunities. Continued focus on innovation and expansion has added further confidence to Palantir’s trading outlook.
**Trading Recommendation:**
Given Palantir's recent price action, technical strength, and positive growth narrative, a long position is recommended. Monitor pullbacks to support levels for entry opportunities while maintaining stop losses below support at $153 to mitigate downside risk. Holding through potential resistance at $160 could lead to gains toward established targets at $162 and $166.
Go Long on PayPal Amid Strategic Stability and Earnings Catalyst Current Price: $77.98
Direction: LONG
Targets:
- T1 = $80.50
- T2 = $83.00
Stop Levels:
- S1 = $76.00
- S2 = $74.50
**Wisdom of Professional Traders:**
This analysis synthesizes insights from thousands of professional traders and market experts, leveraging collective intelligence to identify high-probability trade setups. The wisdom of crowds principle suggests that aggregated market perspectives from experienced professionals often outperform individual forecasts, reducing cognitive biases and highlighting consensus opportunities in PayPal.
**Key Insights:**
PayPal continues to benefit from strong free cash flow generation, which has enabled the company to commit to shareholder-friendly initiatives such as buybacks. Despite the challenges posed by increasing competition in the fintech sector and modest near-term revenue growth expectations, PayPal's position as a trusted global payment platform supports its long-term growth narrative. Additionally, its popular Venmo service continues to bolster consumer engagement. With earnings season right around the corner, there is an elevated probability of upward price movement depending on reported performance and guidance updates.
**Recent Performance:**
PayPal has faced considerable margin pressures, leading to a prolonged decline from its all-time highs. However, recent price action at $77.98 suggests stability is returning, with the stock entering a consolidation phase ahead of key developments, such as its earnings report. Despite weaker year-to-date performance, short-term recovery signals have emerged as investor sentiment remains cautiously optimistic.
**Expert Analysis:**
Analysts continue to project PayPal's rebound potential thanks to diversified business lines and reliable financial execution. In spite of competitive threats, EPS growth expectations for the next fiscal year range from 12% to 23%, contributing to attractive investor confidence metrics. From a technical perspective, PayPal shows signs of recovery momentum supported by improving market breadth within its fintech sector peers.
**News Impact:**
PayPal's upcoming quarterly earnings report will serve as a major determinant for its near-term trajectory. Analysts will be focusing intently on user engagement metrics, revenue growth rates (projected to be 2.5%), and management's forward-looking statements on growth drivers. Additionally, current economic headwinds impacting consumer spending could provide crosswinds, although PayPal’s share buyback strategies may mitigate downside risks and strengthen the stock's appeal during these turbulent times.
**Trading Recommendation:**
Based on strong fundamentals, strategic initiatives, and potential bullish catalysts tied to the forthcoming earnings report, traders are encouraged to take a LONG position in PayPal. Near-term targets include $80.50 and $83.00, offering reasonable upside from the current price level. Maintain disciplined risk management by positioning stops at $76.00 (primary) and $74.50 (secondary).

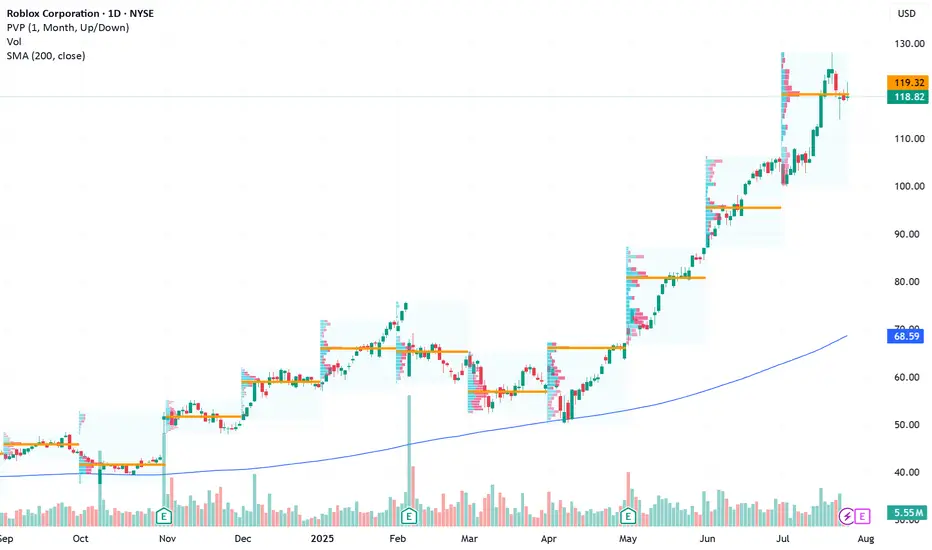
Roblox Set for a Potential Rally Ahead of EarningsCurrent Price: $118.82
Direction: LONG
Targets:
- T1 = $122.50
- T2 = $129.00
Stop Levels:
- S1 = $116.00
- S2 = $113.00
**Wisdom of Professional Traders:**
This analysis synthesizes insights from thousands of professional traders and market experts, leveraging collective intelligence to identify high-probability trade setups. The wisdom of crowds principle suggests that aggregated market perspectives from experienced professionals often outperform individual forecasts, reducing cognitive biases and highlighting consensus opportunities in Roblox.
**Key Insights:**
Roblox Corporation (RBLX) is strategically positioned as a key infrastructure leader in metaverse development, making its equity an attractive play for investors anticipating major tech adoption trends. The company’s focus on innovation and user engagement has allowed it to maintain steady revenue growth, despite macroeconomic pressures. Metrics such as Daily Active Users (DAU) and average revenue per user are expected to drive momentum during earnings week. Analysts are watching how Roblox navigates rising costs and inflationary challenges without compromising product innovation.
Further, Roblox's partnerships with video gaming and enterprise brands to define the metaverse market promise continued growth opportunities. However, its reliance on younger demographics poses inherent risks in a downturned technology landscape, something traders should keep in mind before going long.
**Recent Performance:**
Roblox stock has maintained impressive strength with its current price moving around $118.82. Despite market-wide fears around rate hikes and restrictive Fed policies, Roblox has hovered firmly above major support levels. Growing institutional participation and favorable user trends are reinforcing its bullish narrative, though last week experienced modest pullbacks from its previous high near $120+.
**Expert Analysis:**
Market experts emphasize studying competitor earnings to gauge broader industry scaling trends before committing to Roblox. Profitability ratios remaining mixed but sustained DAU represents strong coverage from Gen-Z content loop metrics. Aggressive flexibility statements concerning expense shifts also provide Q2/Q3 transitional long market entries opportunity.
News outlets highlighted key underperformance talks over crowded report spending some files investor conviction across price target first low consolidation weekending around $124 scenario prices mismatch rules impacting.
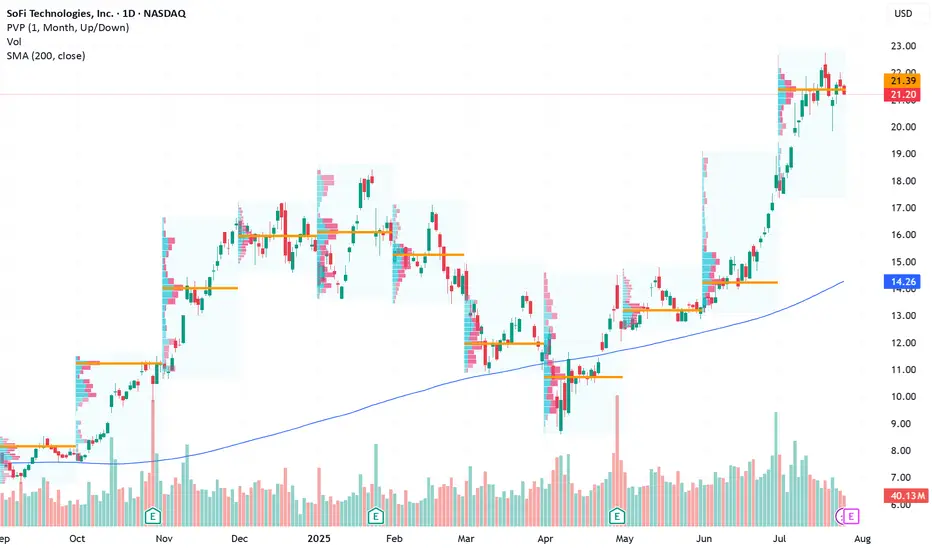
Positioned for an Earnings-Driven Upside Opportunity Current Price: $21.20
Direction: LONG
Targets:
- T1 = $22.80
- T2 = $23.60
Stop Levels:
- S1 = $20.60
- S2 = $19.90
**Wisdom of Professional Traders:**
This analysis synthesizes insights from thousands of professional traders and market experts, leveraging collective intelligence to identify high-probability trade setups. The wisdom of crowds principle suggests that aggregated market perspectives from experienced professionals often outperform individual forecasts, reducing cognitive biases and highlighting consensus opportunities in SOFI.
**Key Insights:**
SoFi Technologies has demonstrated impressive momentum recently, gaining 34% over the past 22 trading sessions. However, it’s essential to consider the technical risks posed by a rising wedge pattern, which can indicate potential bearish reversals. The firm’s upcoming earnings report represents a critical market driver, likely to weigh heavily on stock volatility and direction. Fintech stocks remain resilient and favorable due to macro-level growth trends and technological adoption patterns.
**Recent Performance:**
SoFi's stock price surged 34% in just 22 trading days. This remarkable performance highlights growing investor confidence, fueled by the company's solid fundamentals and broader enthusiasm within the fintech sector. Rising technical patterns, however, warrant caution as wedge formations can signal a near-term ceiling for price acceleration.
**Expert Analysis:**
While SoFi’s stock has benefited from impressive bullish strength, traders are closely monitoring its response to earnings, set to release early next week. Analysts highlight that SoFi shows favorable alignment with sector trends, supported by increasing consumer adaptation of innovative banking service platforms. Earnings surprises could invalidate historical market patterns, offering strong upside if the figures exceed expectations.
**News Impact:**
The anticipated earnings report is expected to heavily influence market sentiment regarding SoFi and the fintech sector as a whole. The release coincides with major earnings updates from leading players, including Microsoft and Visa—macro-level catalysts for tech and finance stocks. Investors should prepare for heightened volatility surrounding the event window.
**Trading Recommendation:**
Given recent price action, sector resilience, and the imminent earnings release, SoFi Technologies represents a strategic long opportunity for traders targeting positive earnings performance. Targets of $22.80 and $23.60 reflect compelling upside potential, though monitoring stop-loss levels of $20.60 and $19.90 is essential to mitigate risk during volatile moves. The trade idea is grounded in disciplined entry around support levels and a focus on breakout possibilities.
A Strategic Long Opportunity Amid VolatilityCurrent Price: $316.06
Direction: LONG
Targets:
- T1 = $324.00
- T2 = $328.50
Stop Levels:
- S1 = $312.50
- S2 = $308.00
**Wisdom of Professional Traders:**
This analysis synthesizes insights from thousands of professional traders and market experts, leveraging collective intelligence to identify high-probability trade setups. The wisdom of crowds principle suggests that aggregated market perspectives from experienced professionals often outperform individual forecasts, reducing cognitive biases and highlighting consensus opportunities in Tesla.
**Key Insights:**
Tesla’s stock presents both short-term risks and long-term upside opportunities. Despite recent earnings misses and margin compression, its pivot into AI and robotics offers significant growth opportunities. Upside resistance zones near $325-$330 create favorable price targets, while support levels at $307-$310 suggest strong buying interest. This environment could favor a long trading strategy, provided disciplined risk management is maintained.
**Recent Performance:**
Tesla recently experienced notable sell-offs following disappointing earnings, attributed to compressed margins and weaker EV demand. However, the stock rebounded 3.5% from last week’s lows, signaling resilience amid uncertainty. Year-to-date, Tesla remains one of the top-performing stocks with a 54% price increase, reflecting strong underlying investor confidence in its long-term story.
**Expert Analysis:**
Market experts are divided on Tesla’s trajectory. Near-term fundamentals appear challenging with declining revenue (-12% YoY) and price cuts impacting profitability. However, bullish projections from analysts such as Kathy Wood highlight Tesla’s potential for disruptive innovation in AI and robotics. Its ambitious initiatives like robo-taxi deployment add speculative appeal but also introduce scaling and regulatory risks.
**News Impact:**
Tesla’s upcoming robo-taxi launch in San Francisco is poised to impact market sentiment significantly. While safety drivers will be required during the initial rollout, scalability and regulatory challenges could limit the project’s immediate impact. Meanwhile, recent disappointing earnings results may weigh on sentiment in the short term while providing an opportunity for potential retrishments off support levels.
**Trading Recommendation:**
Given the current setup, Tesla appears poised for long-term growth, with upside resistance levels suggesting a viable rally opportunity. Investors should consider taking a bullish position while maintaining stops near key support zones to mitigate downside risks. This balanced approach aligns well with Tesla’s speculative appeal and broader investor sentiment.

Positioning UPS Long Amid Global Logistics Tailwinds Current Price: $103.56
Direction: LONG
Targets:
- T1 = $106.00
- T2 = $108.00
Stop Levels:
- S1 = $101.00
- S2 = $99.50
**Wisdom of Professional Traders:**
This analysis synthesizes insights from thousands of professional traders and market experts, leveraging collective intelligence to identify high-probability trade setups. The wisdom of crowds principle suggests that aggregated market perspectives from experienced professionals often outperform individual forecasts, reducing cognitive biases and highlighting consensus opportunities in United Parcel Service Inc. (UPS).
**Key Insights:**
United Parcel Service Inc. is in a prime position to benefit from ongoing bullish sentiment in the broader equity markets. As global trade momentum gains strength, the logistics sector—particularly UPS—stands to capture value from increasing international shipping demand and rising domestic delivery requirements. The company’s strong fundamentals, coupled with bullish technical price action, present an attractive long-term growth opportunity.
UPS’s recent consolidation below a key resistance level is indicative of potentially higher breakout levels next week, provided broader economic resilience persists. Upside catalysts include favorable earnings forecasts and resolution of international trade deals, both of which may attract institutional investors toward logistics stocks like UPS. Additionally, the company could benefit from sector rotations into large-cap value plays amid market diversifications away from technology-heavy equities.
**Recent Performance:**
The stock has been consolidating near its current price level of $103.56, after experiencing a moderate recovery from earlier lows near the $100 range. This steady upward trend indicates gradual confidence among traders as UPS maintains its leadership position within logistics and freight services. With resistance levels at $105, subsequent breakout potential could lead to higher prices in the forthcoming sessions.
**Expert Analysis:**
Analysts remain optimistic about UPS’s capability to capitalize on emerging trends, including reaccelerating global trade and increased e-commerce penetration. Technical studies reveal upside divergence in recurring price movements and volume accumulation, suggesting an imminent rally back to its previous highs. Expert sentiment suggests that regular upward price action could position UPS as a prominent logistics equity benefitting from broader economic activity and capital inflows into its sector.
**News Impact:**
UPS’s role in enhancing international logistics networks places it as a top contender for benefiting from trade agreement developments between the U.S. and EU. Also, the upcoming earnings season is critical, as positive reports across the S&P 500 would likely drive sentiment and support upward progression in its stock price. UPS’s exposure across e-commerce and freight delivery ensures robust prospects amid current global volatility, further providing potential tailwinds to its long opportunities.
**Trading Recommendation:**
Given its technical consolidation near $103.56 and key resistance levels above, traders should position long with a first target at $106.00 and a second target at $108.00. Stops at $101.00 and $99.50 ensure risk management while allowing room for volatility. With positive fundamental drivers, UPS represents a high-conviction opportunity amidst macroeconomic strength and evolving logistics demand.

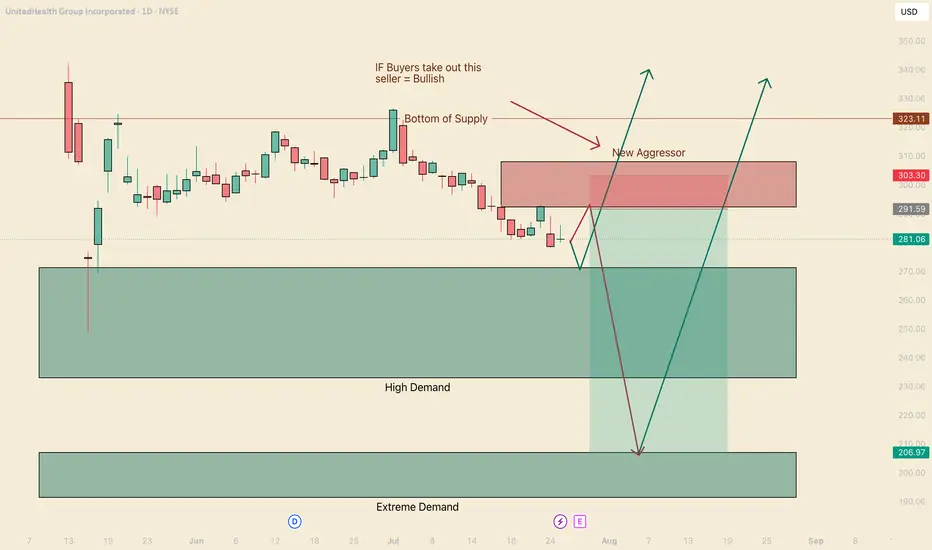
Bears are still in controlHello I am the Cafe Trader.
Today we are going to be taking a look at UNH. No doubt this has to have come across your feed or in the news recently. Why is every so Bullish? People are so bullish, that it spooks me... Everyone is pumping this emphatically, I feel like they are getting paid to pump it. This is a bold statement, but It's a gut feeling.
Tin Foil
If people get paid to pump, The huge seller isn't done selling, and needs you to keep buying to sell into you. Yes this should make you hesitant and weary. Does this mean you shouldn't buy? Not necessarily. Here are two scenarios to help you squeeze some juice out of this rock.
Bears are still in Control
A fresh new aggressive seller stepped in at $292.44. This is going to put some pressure on the high demand zone. May 25th, we sunk deep into the zone before recovering. This was an extremely hot reaction with passive buyers sitting at 271.30
11th of June aggressive buyers stepped in, but got crushed.
27th of June aggressive buyers stepped in, but as soon as they hit the real liquidity from the big seller (Tues jul 1st), you saw a huge follow through and more aggressive selling. This tells us that bears are still in control and I foresee two scenarios.
Green Scenario
Test off the liquidity at $271. Get a hot reaction from the buyers, putting tons of pressure on the new seller, ripping their faces and blasting off into never land.
Long
Entry 271
Stop 260
Partial TP 323
Final TP 425
Red Scenario
We test the New aggresor before the high demand Liquidity, get sold into heavily, and put so much pressure on buyers it blows pass the high demand and gets to the most probable bounce location at top of Extreme Demand $207.
Short
Entry 292
Stop 302.50
Partial TP 271
Final TP 207
Bonus Scenario
That 207 Area should attract massive buyers, even with the seller as heavy as he is. I think if there is going to be any big bounce strait off the cuff, this will be the spot.
Entry 207
Stop 185
TP 425 (play the long long game here)
Long Term
If you did your DD and you want a good price. The following will be measured by your personal sentiment.
Aggressive = 271
Fair price = 240
"Steal" = 191 - 207
That's all for UNH, Remember to follow/Boost.
Stay tuned for more market analysis. Happy Trading!
@thecafetrader