Catch the bounce on NVDAHi, I'm The Cafe Trader.
We’re taking a deeper dive into NVIDIA (NVDA) — one of the leaders in the MAG 7 — with a short-term trade setup you can apply to both shares and options.
Setup Context:
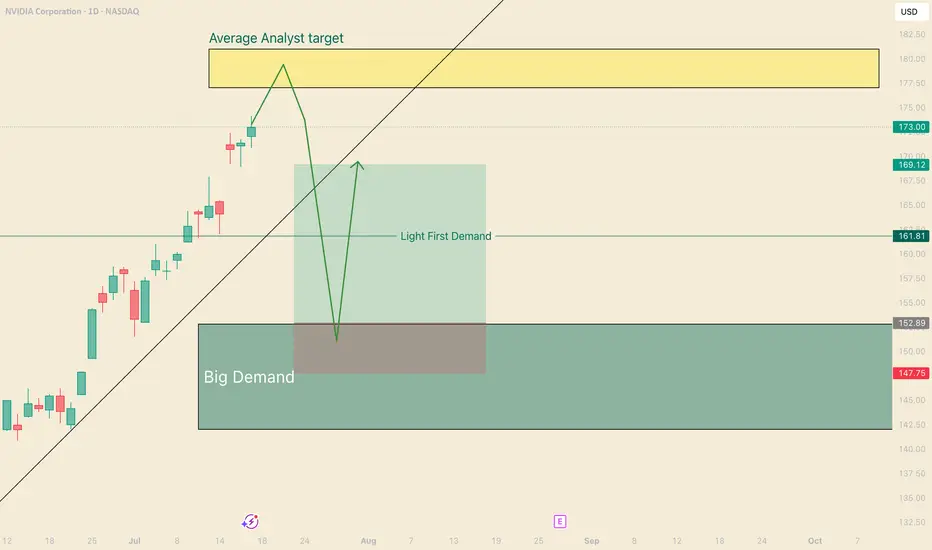
NVDA is pushing into all-time highs, and we’re now approaching the average analyst price target (around $180). While we don’t know how price will react at this level, traders should be watching for pullbacks and trend continuations — prime zones for entry.
If we get a strong move down, I see $153 as a high-probability bounce area — where buyers are likely to step in aggressively.
Price Target Outlook:
The final price target will depend on how price moves into this zone:
- If NVDA runs to $200 before pulling back, targets shift higher.
- If it tops out around $180, we adjust accordingly.
That said, an initial bounce toward $169–$170 looks reasonable.
Options Note:
If NVDA sells off hard and fast, implied volatility (IV) will spike, making options expensive and reducing your edge. This is a setup that could play out over 2–3 weeks, but the first bounce could be quick — so timing matters.
Strategy: Staggered Entry Using Two Contracts
Use two contracts — one short-term, one mid-term — to maximize reward while managing time decay.
Contract 1: Short-Term (3–5 Days to Expiry)
Trigger Entry: As soon as price taps the demand zone (~$153)
Strike Entry Price ^^Target Price
155 $2.00 ^^ $6.00
157.5 $1.50 ^^ $4.50
160 $0.75 ^^ $2.50
You’re looking for a quick reaction: get in, take profit, and step aside while the market finds new balance.
Contract 2: Medium-Term (7–10 Days to Expiry)
Timing Tip: Wait for NVDA to stall or consolidate after the initial bounce — this is when IV comes down and contracts get cheaper.
Strike Entry Price ^^Target Price
155 $3.00 ^^ $15.00
157.5 $2.50 ^^ $12.50
160 $1.80 ^^$9.00
Important: Be careful trading too close to earnings. Contracts tend to get overpriced right before and after earnings drops.
That wraps up the short-term NVDA view.
Stay tuned for more trades and setups across the MAG 7.
@thecafetrader
Take care, and happy trading!
APPL, Get Yourself a Good PriceHello This week we are breaking down the MAG7 starting with Apple.
This analysis is an aid to help you:
1 Find good price to add to your long term.
2 Hedge your current position.
3 Make a swing trade (we will touch on options pricing as well).
Currently Apple is 1 of 5 of the MAG 7 that had not gained a new high since Trump and the tariff scares. Many analysts have given their predictions on where Apples fair value lies and these vary. What they will not tell you is where the institutional buyers and sellers are. Not to worry, this is where we come in
Big Buyers and Big Sellers
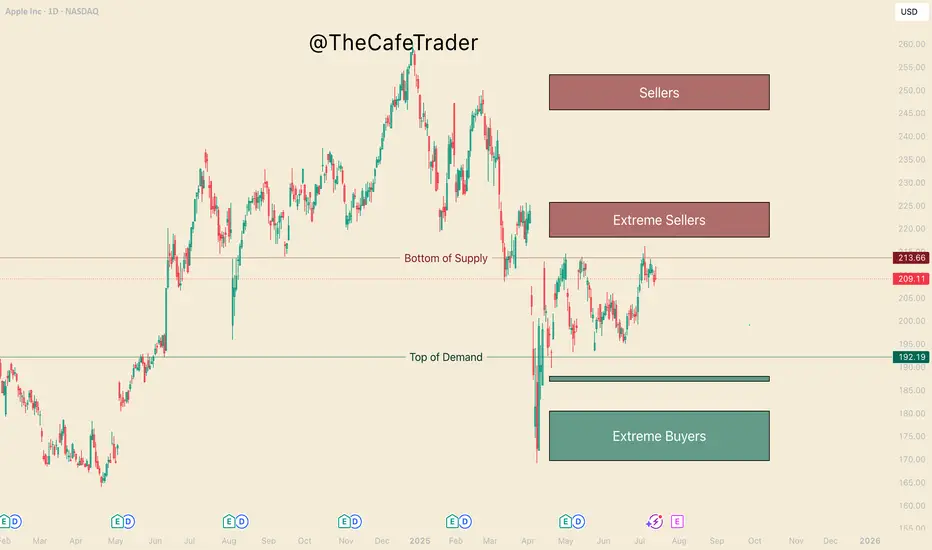
On the chart in front of you, take a look at the 3 different buy and sell zones (otherwise known as supply and demand zones). We find these areas in using a system similar to "imbalances" if you are familiar with the footprint chart, or orderflow. If you had no idea what any of that means, not to worry, I've done the work for you.
-The lines represent the fringe of real liquidity . Using this we will be able to help you find how and when you can find a good price for your long term.
- Buyers/Sellers: strong motivated liquidity.
- Extreme Buyers/sellers Extreme demand, this is an area you could consider a steal.
1 How do you find good pricing?
Simply put - Buy with the buyers and sell with the sellers.
If you are wanting to add to your long term here are the prices. Do you want to get in ASAP? or are you willing to wait for what could be a great deal. This is important as the end of the year can greatly depend on not just picking a good stock, but finding a great price.
Buying
Fair - 192
Good - 188-187
GREAT - 180-169
Now if you are in, and maybe you want to hedge the downside (you can do this by shorting the stock, or buying put options (even more in depth you can do spreads).
For now we will just focus on Buying Put options and taking profit for swing traders.
The Burgundy line "bottom of supply" previously rejected this area twice before (May 1st, and May 14th). July 7th marks the 3rd rejection. It's important to note that the last test pushes a new high, this shows a bit of weakness from the sellers.
This weakness suggests we may see the 218-225 Sellers get tested before it comes down. The question is, How strong will the buyers be coming into this zone.
If they are aggressing this area with new REAL buyers, Then we may see this run through all these sellers and continue to run until the 245 area. If we do not find real buyers here, then likely we will reject to the pricing marked previously.
If you are holding APPLE, you can look to hedge with puts at the end of the 220-223. Since you are looking at about 5-7% downside from apple if the sellers are strong here, look to only spend 2-3% of your apple worth on puts. look for maybe 2-3 weeks out if possible.
Secondly if APPL does make a bull run to 245 you can mark this area again to hedge short term puts. look for 8-10%+ downside puts 3-4 weeks out (roughly 3-5% of your apple size)
Hedging can be very useful in wanted to keep your long term and navigate some of the ebbs and flows of the market. Notice that the risk of your puts, 2-3% & 3-5%, is half of the expected reaction from these areas. if you get a big rejection, expect these options to pay well.
NOTE: If you do not understand the implied volatility (IV's) change the price of options, it is recommended that you stay away from options until you have sufficient experience. It's also important to know how to find a good strike price, and how to know if you are getting a good price. I will be breaking down options pricing in a different time.
That's all for Apple, Stay tuned for the rest of the MAG 7!
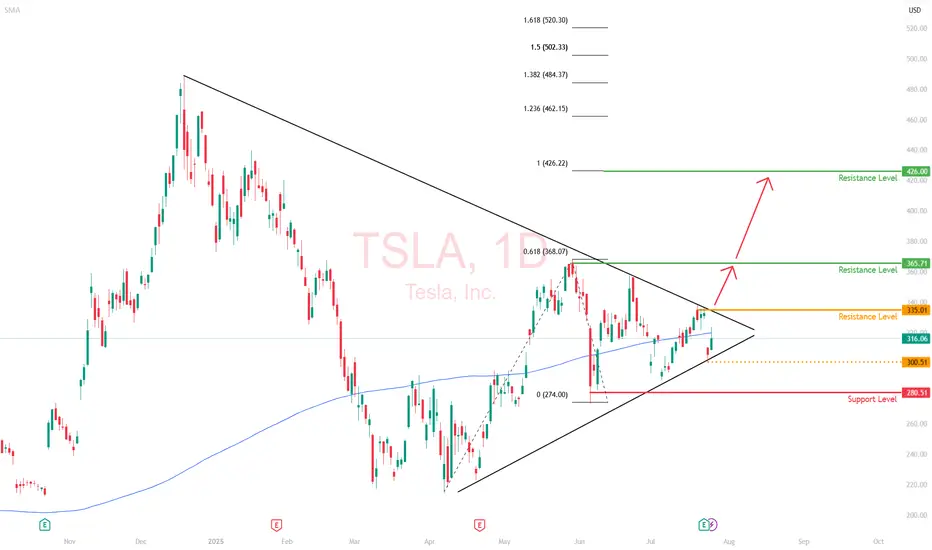
Tesla (TSLA) | Short-Term Compression, Long-Term ExTesla’s daily chart is coiled, with price currently trading at $316, sitting along the 200-day moving average. This looks like a consolidation phase with significant moves building up.
Price Action Snapshot
TSLA sold off last week, rejecting the $335 resistance level before finding footing around $300. The previous range of $280 and $365 is now tightening.
Immediate resistance sits at $335 with a clean breakout above that zone likely triggering momentum back toward the upper range of $365.
The recent drop does not seem like a capitulation move; it's likely institutional redistribution. Smart money is repositioning, not exiting.
Market Is Focused on the Wrong Data
Tesla’s Q2 earnings were objectively weak. Revenue fell 12%, deliveries dropped, and operating margins got clipped.
But this correction isn't all about fundamentals. It is about the market adjusting to a company evolving beyond traditional valuation models.
While most investors are trying to value Tesla like a car company, it’s spending this entire phase retooling itself into an AI and autonomy-first enterprise. That transition doesn't show up in EPS yet (but it will).
The Bigger Picture is Being Missed
The robotaxi rollout in Austin is live. Expansion into California, Phoenix, and Florida is on the roadmap.
Tesla is building a vertically integrated, owner-driven ride-hailing model that could eventually bypass both Uber and legacy OEMs entirely.
Optimus is no longer a lab prototype—it’s moving toward scalable production by 2026.
If Tesla even partially succeeds in general-purpose robotics, it will unlock a Technology Acceptance Model (TAM) that dwarfs the current EV narrative .
Daily Technical Outlook
We’re currently in a bullish compression, with higher lows forming against the resistance area of $365. If $280 holds and the price continues to grind within this wedge, it sets up a volatility breakout scenario.
The breakout level to watch is $335. A daily close above that reopens $365. And beyond that, the resistance level is at $426.
My View
Tesla is compressing, both in price and narrative.
The long game is quietly coming into focus, where the risk/reward skews asymmetrically in favor of the upside.
This daily compression won’t last forever, and when it resolves, the move will likely be outsized.
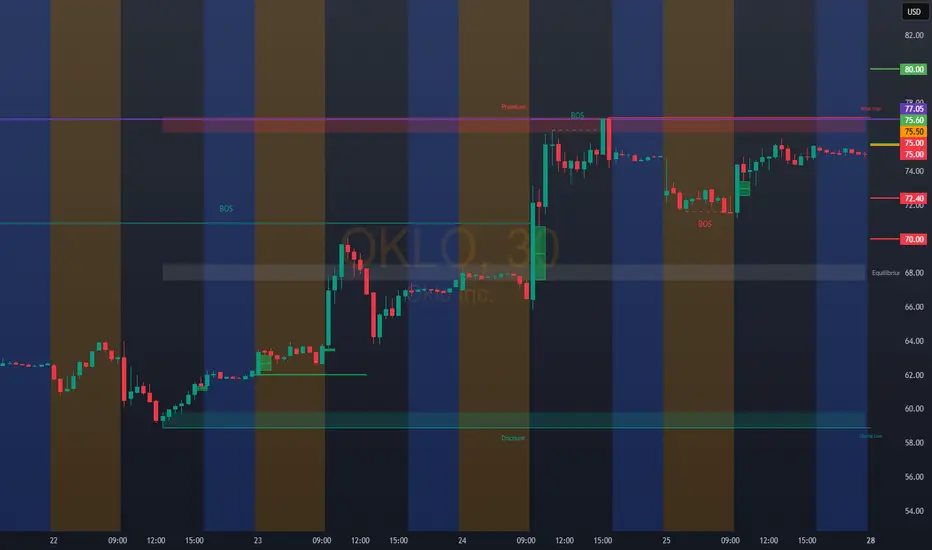
OKLO 75.50RECOMMENDED STRATEGIC ENTRIES
Bullish: (75.60/80.00) Target (82.00–83.00) Stop (74.50)
Bearish: (72.40/70.00) Target (71.00–70.00) Stop (74.00)
Bullish Analysis for Moderna (MRNA)Recent Price Action Shows Strength MRNA has shown significant bullish momentum since mid-May 2025, rising from around $24 to current levels above $34, representing a 40%+ gain. The stock has formed a series of higher lows and higher highs, establishing a clear uptrend.
Key Bullish Factors:
Positive FDA Developments
Full FDA approval for COVID-19 vaccine Spikevax for children 6 months through 11 years (July 10)
European Medicines Agency's positive opinion for updated COVID-19 vaccine formulation (July 25)
Technical Breakout
The stock broke above its resistance level around $30 in early July
Volume has increased on up days, particularly on July 8-9 (19.3M shares) and July 22-23 (12.5M shares), indicating strong buying interest
Cancer Vaccine Progress
Recent news (July 23) about researchers moving closer to a universal cancer vaccine, which aligns with Moderna's mRNA technology platform
Relative Value Opportunity
Market cap has decreased significantly from $44.4B in Q2 2024 to $10.9B in Q1 2025
Current price represents a potential value opportunity if the company can return to profitability
Price Structure Analysis:
08 Apr
15 Apr
22 Apr
29 Apr
06 May
13 May
20 May
27 May
03 Jun
10 Jun
17 Jun
24 Jun
01 Jul
08 Jul
15 Jul
22 Jul
25
30
35
MRNA Close Price
Support Levels
FDA Approval
EMA Positive Opinion
Entry Strategy:
Current price ($34.15) offers a potential entry point with strong support at the $32-33 level
Volume profile suggests accumulation phase may be underway
Risk can be managed with a stop loss below $32
Potential Catalysts:
Additional vaccine approvals or expanded indications
Progress in cancer vaccine development
Return to profitability in upcoming earnings reports
Potential for inclusion in seasonal vaccination programs
Risk Factors to Monitor:
Bank of America maintains a "sell" rating with a $25 price target
Negative PE ratio indicates the company is not currently profitable
News about Japan plant cancellation suggests demand challenges
Political uncertainty around vaccine policies

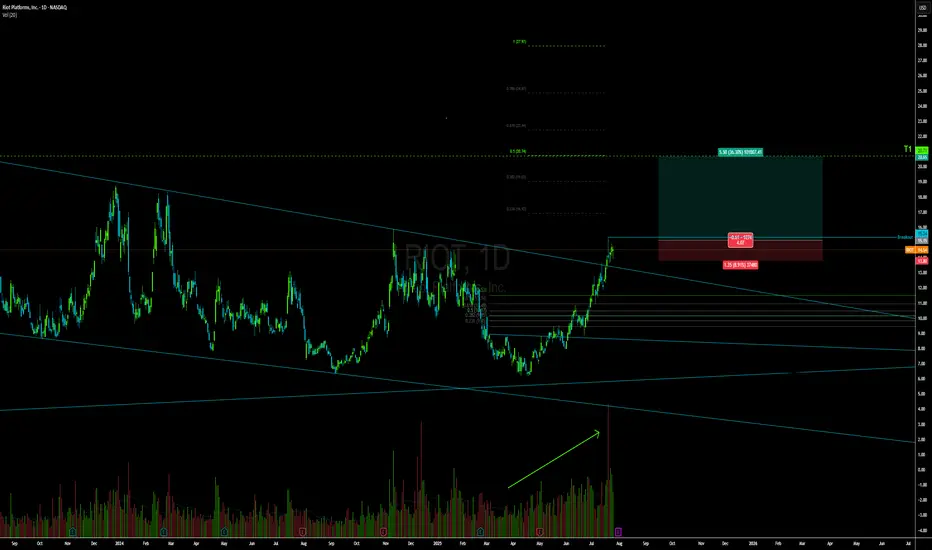
RIOT LONGNIce breakout W/ Volume, following BTC momentum, Following with BTC momentum. $20 First Target.
NVDA: 173.50RECOMMENDED ENTRIES: Bullish (174.30/175.00) Target: (176.00 – 177.00) Stop (173.50) Bearish: (173.00/172.00) Target: (172.00 – 170.00) Stop (174.00) Note: 174.00 double top

My UNH Thesis: Betting on a Healthcare Giant's Come BackThe healthcare sector has been in decline, which creates interesting opportunities. I recently talked about a few pharma plays - Eli Lilly, Novo Nordisk, and Pfizer.
Here's why I'm investing in NYSE:UNH :
UnitedHealth Group (UNH) has tanked ~50% in the past year, but the July 29 (VERY SOON) earnings could flip the script. As a historically dominant player, UNH is now undervalued amid sector weakness, offering massive upside if regulatory fears ease.
Here's my full bull case. 👇 FUNDAMENTAL ANALYSIS
Why the Sell-Off? A Perfect Storm of Bad News
UNH crushed the market for 15 straight years (2009-2023) with positive returns, predictable EPS growth, and 134% gains over the last decade.
But 2024 brought chaos:
Feb: Massive cyber attack caused a one-time EPS hit (non-recurring).
Ongoing: DOJ antitrust probe, criminal fraud investigation, rising Medicare costs, and Optum losses.
April: Disastrous Q1 earnings miss + lowered guidance.
Leadership drama: CEO death.
This erased gains (down 7% over 5 years), amplified by healthcare sector outflows—the biggest since 2020. But is this overblown? Signs point to yes. The markets almost always overreact to bad news.
Bullish Signals: Insiders Betting Big
The tide is turning:
Insider Buying Boom: $32M+ in 2024 (vs. $6.6M in 2019), including new CEO/CFO—highest in 15 years.
Congress Buying: Q2 2024 saw net purchases for the first time in 5 years (vs. historical selling).
DOJ Shift: Probe refocusing on pharmacy benefits (PBM) unit, dropping acquisition/monopoly scrutiny—implies no major findings. Great news!
Sector Tailwinds: Healthcare is one of 3 S&P sectors below historical valuations. Super investors (usually tech-obsessed) are piling in, despite the sector's -10% YTD vs. S&P's +13%.
Plus, UNH's dividend yield is at a record ~3% (vs. 1.5% avg), with 16%+ historical growth and 100%+ free cash flow conversion. Rare combo of yield + growth!
Valuation: Screaming Buy?
UNH trades at PE ~11.9 (vs. 10-year avg 23)—a steal.
Analysts project 16.7% EPS CAGR through 2029.
Conservative Scenario: 16.5% EPS growth + PE to 16.5 = $780/share by 2030 (173% total return, 18% CAGR ex-dividends).
Optimistic: PE back to 23 = $1,084/share (280% return).
Models confirm:
DCF (8% FCF growth): ~$484/share (70% upside).
DDM (7% div growth): ~$607/share (112% upside).
Blended Fair Value: ~$545/share (75-90% upside from ~$300). Buy below $436 for 20% safety margin.
Still, there is fear of DOJ uncertainty—investors hate unpredictability and that's why the stock is so low.
Key Catalyst: July 29 Earnings
This could be UNH's "most important report ever." Watch for:
Regulatory/legal updates (DOJ progress).
Full-year guidance revisions.
Metrics like medical loss ratio and PBM performance.
Positive news = potential rocket 🚀. Expectations are low (20 bearish EPS revisions vs. 0 bullish), so a beat could spark volatility... upward.
Risks: Not Without Bumps
Regulatory escalation (e.g., PBM issues) could tank it further.
Short-term headwinds: Medicare costs, sector selling.
Mitigants: DOJ de-risking, strong FCF buffer, insider confidence. Enter cautiously—size positions small.
TECHNICAL ANALYSIS
I also did a little technical analysis:
UNH price is at a resistance level
My EVaR indicator tells me we are in a low-risk area
RSI says the stock is oversold
I added the different price targets for better visualization
THE PLAN
My plan:
Later today, I will allocate 1% to 1.5% of my portfolio to the stock. If it drops, I will continue to DCA. The stock is already really beaten down, and I think a company this large cannot drop much more.
Quick note: I'm just sharing my journey - not financial advice! 😊

GWW stage 3 distribution/stage 4 declineGWW is showing a possible entry of a stage 3 distribution range, and into a stage 4 decline. The price recently busted below the 50 and 200 smas, and with large volume, has failed to recover above them. The 50 and 200 moving averages have begun to turn over. GWW has demonstrated poor relative strength (SPX). While the distribution services sector remains generally strong, many large market caps in the sector have transitioned out of their respective stage 2 advances.

AAPL Holding the Line or Ready to Slip? Jul 28AAPL Holding the Line or Ready to Slip? Key Gamma Zones In Play 🧠📉
1. Market Structure (15M SMC Chart)
AAPL recently broke out of a descending wedge structure after forming a BOS (Break of Structure) around $213.50. Two recent CHoCHs suggest an internal shift in momentum, but price failed to reclaim the red breaker block at ~$214.20–$215.40. Sellers stepped in heavily from that supply zone.
* CHoCH ➜ BOS ➜ Lower High = potential bearish continuation
* Price is compressing under the breaker zone with lower highs forming
* Final CHoCH was not sustained above key S/R level ~$214.20
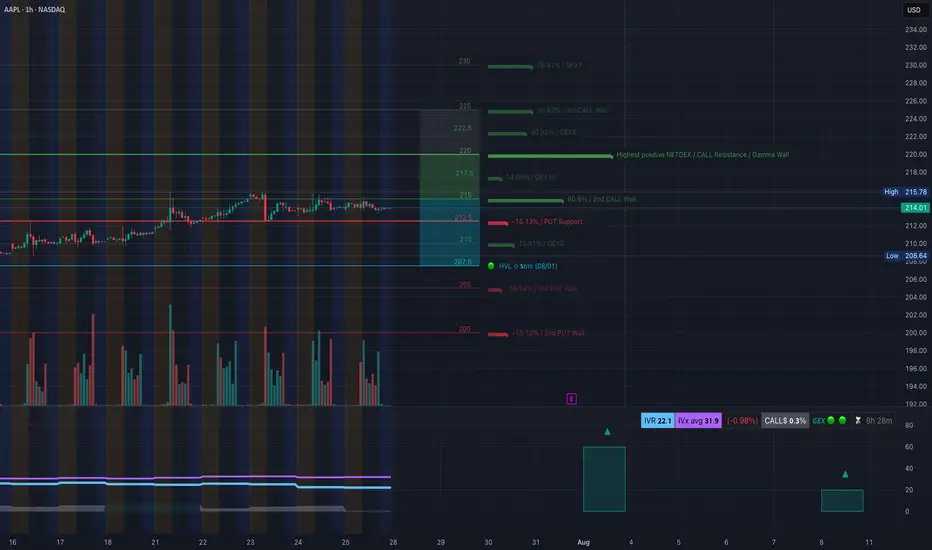
2. GEX & Options Flow (1H GEX Chart)
The Gamma Exposure map shows AAPL in a compression pocket between PUT support and CALL resistance, with volatility brewing.
* 🔒 $212.5: Key PUT support — likely dealer hedging zone
* 🔓 $215.5: Strong CALL resistance & 2nd CALL Wall
* 📉 Below $210 = Gamma Squeeze zone toward $207.5 / $205 (3rd PUT Wall)
* 📈 Above $217 opens room toward $220–$222.5 (GEX8/GEX9) and CALL dominance
IVX is still subdued (31.9) and IVR at 22.1 — suggesting cheap options right before earnings on August 1st, making directional bets appealing.
3. Key Levels to Watch
* Support: $213.00 / $212.50 / $210.60
* Resistance: $214.20 / $215.50 / $217.00
4. Trade Scenarios
📉 Bearish Setup (high probability):
* Entry: $213.80–214.10 rejection zone (breaker retest)
* Stop: Above $215.60
* Target 1: $212.60
* Target 2: $210.60
* Target 3 (if breakdown): $207.50 GEX / HVL
📈 Bullish Reversal Setup (only if breakout confirms):
* Entry: Break and hold above $215.50
* Stop: Below $214.30
* Target 1: $217.00
* Target 2: $220
* Target 3 (squeeze): $222.50 GEX9 zone
5. Thoughts & Recommendation
AAPL is compressing tightly between supply and demand, but the market structure + GEX combo leans bearish bias unless bulls reclaim $215.50. Use that as your decision line.
Intraday traders: watch how price reacts to $214.20–$213.60 zone. Failure to bounce likely leads to PUT wall retest at $212.50 and HVL support below.
Options traders: Consider weekly PUT spreads if price rejects $214.10–$215.50 again. For bulls, only consider long CALL spreads if we get a break and close above $215.60 with volume.
Disclaimer: This analysis is for educational purposes only. Not financial advice. Always manage risk and trade your plan.
NVDA Sitting at a Crossroads. Jul 28NVDA Sitting at a Crossroads: Will Gamma or Liquidity Take Control? 🔍
Overview:
NVDA is currently consolidating below a 15-min supply zone after a clear BOS (Break of Structure) on the intraday chart. Price is compressing near a rising trendline support and forming a triangle, hinting at an explosive move early this week.
📊 Market Structure (15m + 1H):
* BOS confirmed near $175 with rejection from the supply zone.
* Currently building a higher low around $173.00–173.30, sitting on trendline support.
* Price is compressing in a tight range — breakout likely on Monday.
🔍 GEX & Options Sentiment (1H GEX Chart):
* Highest Call Resistance near $176–$178 → strong gamma wall.
* Major GEX Support: $167.74 (GEX10) and heavy PUT wall at $165 (17.99%).
* IV Rank: 8.3, IVX: 37.3 (relatively cheap options).
* Call$/Put$ Flow: Heavily biased toward Calls (9%), signaling bullish sentiment.
* GEX Sentiment: Mild Bullish → neutral into highest positive gamma.
🔄 Key Zones:
* Demand Zone: $167.7 → aligns with HVL and GEX10.
* Support Below: $165 (GEX PUT wall), then $162.5 (2nd PUT wall).
* Resistance Above: $174.72 → $176 (gamma wall) → $180.
📈 Trade Scenarios:
Bullish Play (Scalp/Swing):
* Entry: Above $174.14 reclaim (supply zone flip).
* Target 1: $176
* Target 2: $178 → $180 (gamma squeeze zone).
* Stop-Loss: Below $172.90 or break of trendline.
* Notes: Needs a clean BOS and demand reclaim — watch volume + open interest shift.
Bearish Play (Only if support fails):
* Entry: Break and close below $172.90
* Target 1: $170
* Target 2: $167.7 → possible bounce at GEX10.
* Stop-Loss: Back above $174.00
💭 My Thoughts:
NVDA is in a coiled setup — either breaking out into a gamma squeeze above $176 or failing trendline support and testing $167–165 for liquidity. GEX suggests institutions are defending $165 while sellers may reload near $176. Favoring bullish bias unless $172.90 breaks.
🧠 Strategy Tip:
Watch for FVG fill on 1-min or 5-min chart if it retests trendline before launching. A strong reclaim of $174.14 may trap shorts and trigger fast moves toward gamma walls.
This analysis is for educational purposes only and does not constitute financial advice. Always do your own research and manage your risk before trading.

TSLA at the Edge of Reversal or Rally? Key Setup Ahead. Jul 28🔍 Technical Analysis (1H + 15M Confluence)
* Market Structure:
After a steep drop from $334, TSLA has shown a recovery off the $300.41 low. The 1H chart shows a bounce forming higher lows, with price now consolidating around $317–$318.
* SMC Insight (15M):
The bullish BOS and CHoCH signal a structural shift. Price has respected the ascending channel and reacted from the Fair Value Gap (FVG) inside a purple supply zone near $323–$325, indicating short-term resistance.
* Volume Analysis:
Volume increased on the bullish move off $302.5 demand zone, indicating possible accumulation, but stalled near resistance.
🔐 Key Supply & Demand Levels:
* Demand Zones (Support):
* $302.5 (1H GEX HVL zone + volume demand)
* $300.41 (last low & liquidity pocket)
* Supply Zones (Resistance):
* $323.62–$325 (15M supply + GEX resistance zone)
* $334–$338 (GEX7/High wall)
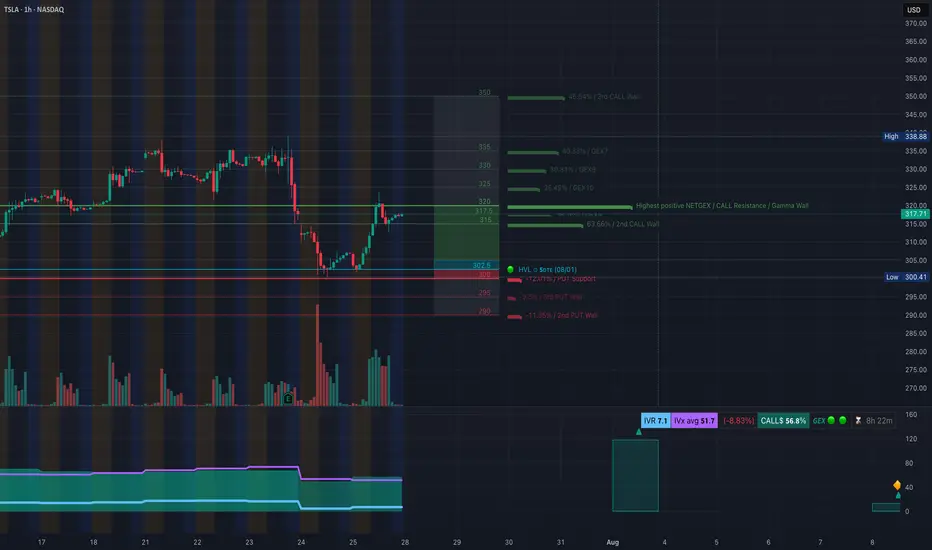
📈 Options Sentiment – GEX & Flow
* Gamma Walls (Resistance):
* $317–$323: Heavy CALL walls, especially at $320 (Gamma Wall)
* $335–$338: Strong GEX7 / GEX9 resistance — potential magnet only if TSLA breaks 325 cleanly
* PUT Walls (Support):
* $302.5: HVL + PUT support
* $295 & $290: Lower extreme GEX support (panic defense zones)
* Options Oscillator:
* IVR: 7.1 (very low — cheap premiums)
* IVx avg: 51.7 (slightly elevated fear)
* Call Bias: 68.8% bullish
* GEX Sentiment: ✅✅✅ bullish until $325, then neutral-to-risky
🎯 Trade Setups
✅ Bullish Setup (if price holds above $316–317):
* Entry: 317.50–318.00 (current consolidation)
* Target 1: 323.50 (supply)
* Target 2: 334.00 (GEX9 magnet)
* Stop-loss: 312.70 (SMC breaker structure + 15M CHoCH invalidation)
Scalp Target: 323
Swing Target: 334
Add Calls (weekly): Only above 320 breakout with volume.
❌ Bearish Setup (if price loses 312.70):
* Entry: < 312.50 breakdown
* Target 1: 305.30 (mid-demand)
* Target 2: 302.50 (HVL & GEX PUT support)
* Stop-loss: 316.10 (back inside channel, bullish flip invalid)
Scalp Target: 305
Swing Target: 302.5
Add Puts: Only below 312.5 with confirmation candle.
⚖️ Bias & Scenario Outlook:
* Neutral-to-Bullish Bias: As long as price holds above 316 and respects the ascending trendline.
* Risk Zone: 323–325 = possible reversal zone (heavy GEX wall + supply)
* Gamma Flip Above: 325 opens up 334–338.
📌 Conclusion:
TSLA is compressing between supply and demand. Monday’s price action around 317–320 will be key. A break above 320 could fuel a GEX chase to 334, while rejection may trigger a pullback toward 305–302. Stay nimble and let price confirm direction around key GEX walls and SMC structure.
⚠️ Disclaimer:
This analysis is for educational purposes only and does not constitute financial advice. Always do your own research and manage your risk before trading.
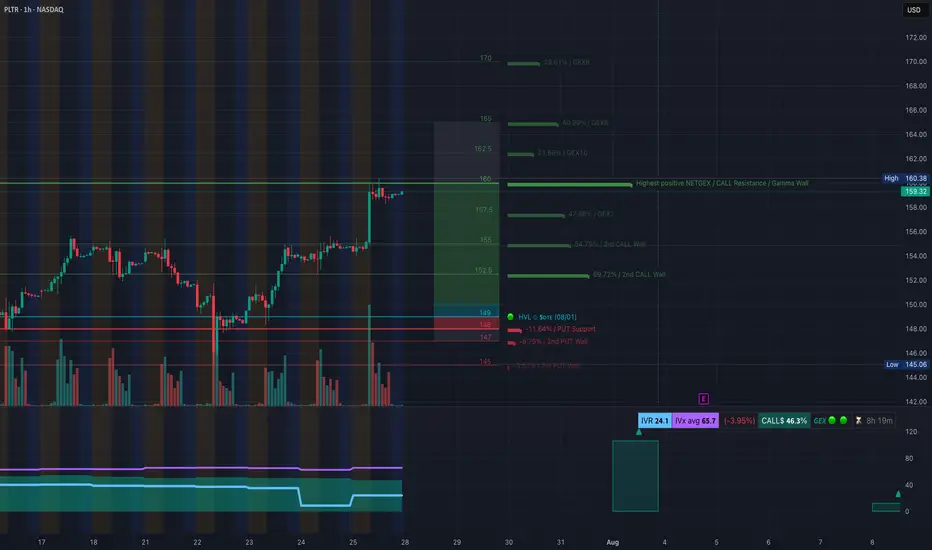
PLTR at Resistance Brink — Will It Break or Fade? Jul 28🔍 1-Hour GEX & Options Outlook
Palantir (PLTR) has reclaimed strength, now consolidating just below $160.38, which aligns with the Highest Positive GEX / Gamma Wall. The GEX stack gives us a powerful framework for potential options setups:
* $160.38 = Gamma Magnet – This is the wall where large call positioning accumulates. Price is currently pinned underneath, forming a short-term consolidation range.
* Above $160.38 opens the path toward:
* $162.5 (GEX10)
* $165 (GEX9)
* $170 (GEX9 top wall)
However, failure to break $160.38 cleanly could cause price to slide back to key support zones around:
* $157.5 (GEX Cluster, minor put wall zone)
* $152.5 (2nd Call Wall, liquidity pocket)
* $149–147 (High Volume Node + Put Support)
🧠 My thoughts: This is a textbook high gamma compression zone. If PLTR breaks and holds above $160.38 early in the week, it could trigger a gamma squeeze toward $165+. If it gets rejected again, short-term premiums may decay fast, and a move toward $152.5 is likely before any next leg.
🎯 Options Strategy:
* Bullish Setup:
* Entry: Over $160.50 with volume and confirmation.
* Target: $165, then $170.
* Contract: Aug 2nd or Aug 9th $165C.
* Stop: Below $157.5.
* Bearish Setup:
* If rejection from $160.38 with weakness.
* Target: $154.88 / $152.5.
* Contract: Aug 2nd $155P or $152.5P.
* Stop: Above $160.8.
🕒 15-Minute Intraday TA
We saw a sharp rally followed by sideways compression in a narrow range between $159.32 and $160.38. The breakout leg was supported by a clear CHoCH (Change of Character) in the NY morning session followed by a BOS (Break of Structure) up.
Price has since been flagging within a parallel channel, forming a minor order block between $158.29 and $159.32. As we head into Monday’s session, here’s what to look for:
🟢 Bullish Intraday Scenario
* Look for price to hold the OB or do a liquidity sweep down to $158.29, then break above the current flag.
* A break and retest of $160.38 with rising volume sets up a clean scalp toward $162.
* Bias remains bullish as long as price stays above the rising channel and $157.5.
🔴 Bearish Intraday Scenario
* A break below $158.29 could trigger a fade toward the next support around $154.88 / $153.97.
* A mid-morning failed breakout above $160.38 that quickly reverses would be a trap short setup.
* If price falls below $157.5 early in the day, expect downside acceleration.
📌 Scalper’s Zone to Watch:
* $158.29–$159.32 = Bullish OB + Liquidity Zone.
* $160.38 = Resistance + Gamma Wall.
* $154.88–$153.97 = Demand zone if flush occurs.
🧠 Final Thoughts:
PLTR is at a pivotal level with serious GEX heat. It's consolidating right beneath a gamma ceiling that could either trigger a breakout squeeze or unwind. Use the first 15–30 minutes Monday to judge strength. Watch the reaction to $160.38 carefully — that’s the gatekeeper.
⚠️ Disclaimer:
This analysis is for educational purposes only and does not constitute financial advice. Always do your own research and manage your risk responsibly.
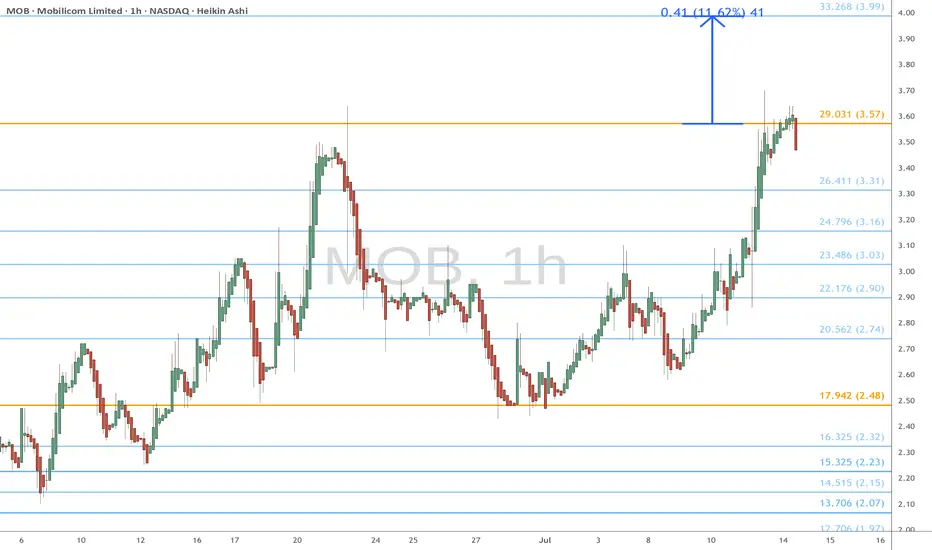
MOB eyes on $3.57: Break should POP and run OR Double TopMOB with a nice recovery from much needed retrace.
Once again testing the proven Golden Genesis fib at $3.57
If/when it breaks it should be a quick pop and then some.
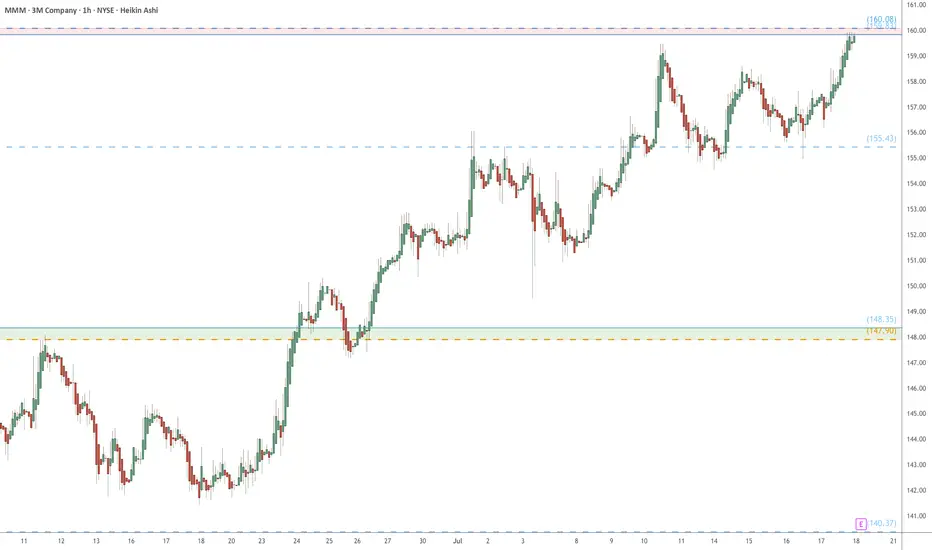
MMM eyes on $160: Resistance Zone waiting for Earnings reportMMM has been crawling off a decade long bottom.
Testing a significant resistance at $159.83-160.08
Earnings report tomorrow, so a key 24 hours here.
.
Previous analysis that caught the BREAK OUT:
Hit the BOOST and FOLLOW for more PRECISE and TIMELY charts.
========================================================
.
Z eyes on $68.80-69.75: Resistance even the Fib-Blind can SEEZillow has bounced into a major landmark of its lifetime.
Zone is defined by a Golden Covid and a Minor Genesis fib.
This has been tested from both sides many times already.
$ 68.60-69.75 is the exact resistance to watch.
$ 61.82-62.50 is the first support below to hold.
$ 76.18-7./00 is a good first Target for longs.
===================================================
.

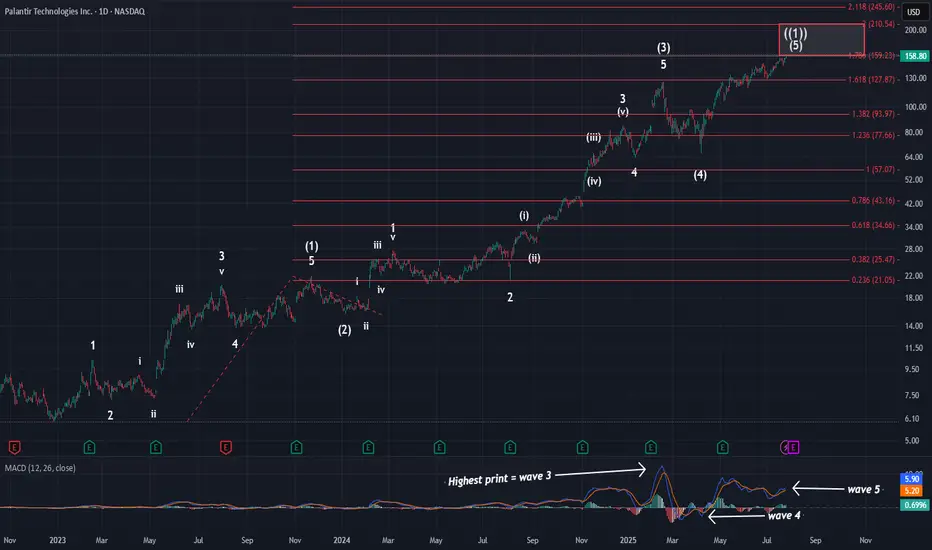
PalantirOn Friday, price hit the 1.236 extension and the larger red 1.786 extension @ $159. Tonight, I wanted to zoom out to show you where price is in the grand scheme of things. As you can see, we have all of the needed waves in place to consider this larger pattern complete. We have finally hit the standard target box for primary wave ((1)), and almost finished on what I am calling a smaller degree ED. This means that the reversal is soon at hand and that the initial move lower will be swift.
This primary wave ((1)) has lasted over 2.5 years. However, there is no way to predict exactly how long primary wave ((2)) will last. It could be short, or it could be long. Primary waves typically last months to even years to complete. Given the length of wave ((1)), I think it is safe to say wave ((2)) is likely to last over 1 year at the minimum. When our consolidation does kick off, we should be targeting the $50-$80 range for completion. Again, that won't happen fast. I will very likely take at least a year to complete.
For now, though, in the short term this pattern is putting the finishing touches on. Seeing this zoomed out picture again hopefully puts into perspective exactly how close we are to completion.
P.S: Looking at MACD, you can see I have labeled the larger waves. You can also see how much hidden bearish div we have at this time.
Long Trade Setup on $SBUX (Starbucks)📈
Entry: $94.41 (Breakout above mini wedge)
Stop Loss: $93.75 (Below trendline support)
Target: $96.38 (Key resistance zone)
Pattern: Rising Wedge breakout with bullish momentum
Risk-Reward Ratio: ~2.6R
Caution Zone: $94.83–$95.33 (multiple rejections in past)

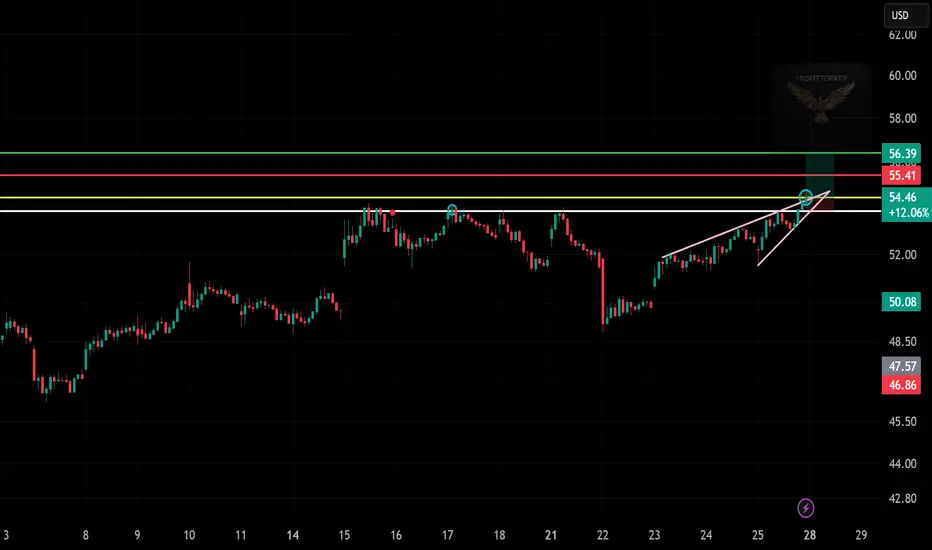
Long Trade Setup on $SMCI!📈
Entry: $54.46
Stop Loss: $53.97
Target: $56.39
Pattern: Rising Wedge Breakout
Risk-Reward: ~2R
Key Zone: $55.41 (resistance/rejection level to watch)
Long Trade Setup on $PAX!📈
Entry: $13.71
Stop Loss: $13.59
Target: $13.91
Pattern: Ascending Triangle Breakout
Risk-Reward: ~1.7R
Key Level to Watch: $13.78 (possible resistance)

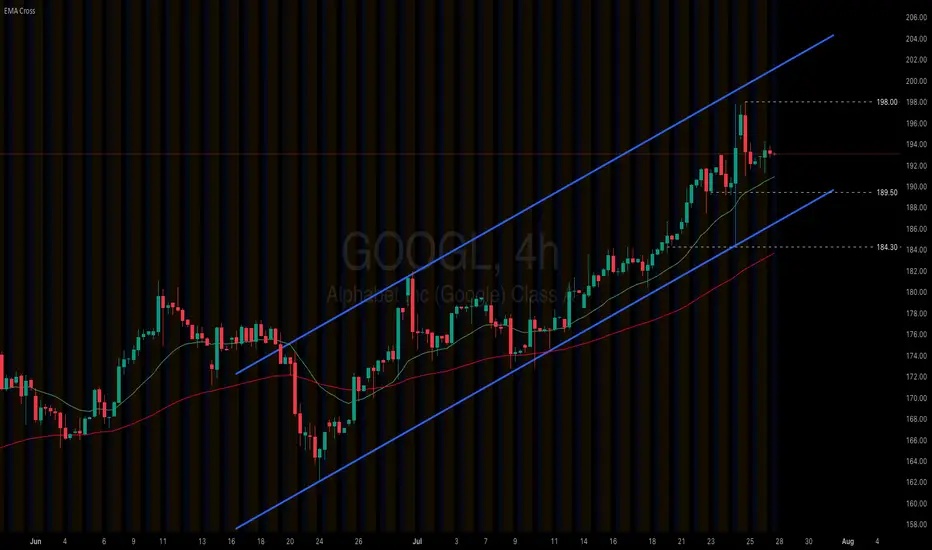
Alphabet (GOOGL) extends its rally on upbeat 2Q earnings
US equities continue to post record highs, driven by stronger-than-expected 2Q earnings and optimism over ongoing trade agreements. Alphabet’s (GOOGL) Q2 results reaffirmed the accelerating pace of AI-led growth. The company’s cloud revenue surged 32% YoY, up from 28% in 1Q, and it raised its full-year capex guidance from $75B to $85B.
Alphabet (GOOGL) remains firm within its ascending channel. The price solidly holds above both EMAs, indicating the potential extension of bullish momentum. If Alphabet (GOOGL) holds above EMA21, the price may gain upside traction toward the previous high at 198.00. Conversely, if Alphabet (GOOGL) breaks below the support at 189.50, the price could retreat to the next support at 184.30.
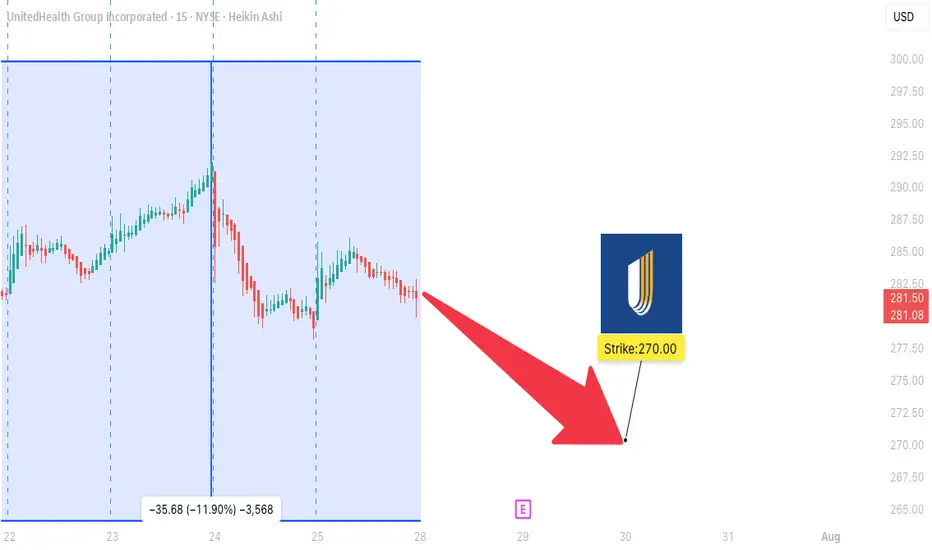
UNH WEEKLY TRADE IDEA (07/27/2025)
**🚨 UNH WEEKLY TRADE IDEA (07/27/2025) 🚨**
**Trend: Bearish Bias with Contrarian Options Flow**
🟥 **Technical Breakdown** + 🟩 **Bullish Flow Confusion** = Strategic Put Play
---
📊 **Key Technicals**
🧭 **Daily RSI:** 37.0 ⬇️
📉 **Weekly RSI:** 27.9 ⬇️ = *EXTREME BEARISH MOMENTUM*
📊 **Volume:** 1.2x prior week = *Institutional activity confirmed*
---
📈 **Options Flow Snapshot**
🟢 **Call/Put Ratio:** 1.64 → Normally bullish…
❗BUT in a falling market = **Contrarian noise** (per Gemini & Claude)
---
🔍 **Model Consensus Recap**
✅ All 5 models confirm BEARISH MOMENTUM
📉 Volume confirms downward pressure
❗ Disagreement only on *interpretation* of bullish call flow
📌 **Conclusion:** Put trade favored, but watch for surprise reversals
---
💥 **RECOMMENDED TRADE SETUP (Confidence: 65%)**
🎯 **Play:** Buy-to-Open PUT
* **Strike**: \$270
* **Expiry**: Aug 1, 2025
* **Entry Price**: \~6.10
* **Profit Target**: \$12.00 (🔁 2x Gain)
* **Stop Loss**: \$3.00 (🔻\~50%)
📆 **Entry Timing:** Market Open Monday
📦 **Size:** 1 Contract
---
⚠️ **Key Risks to Monitor:**
* 📈 If UNH moves above \$290 (Max Pain), bearish thesis invalidates
* ⚡ Gamma risk increases mid-week — *manage actively!*
* 📉 Unexpected volume dry-up could stall momentum
---
📌 **JSON FORMAT TRADE DETAILS (For Scripts/Alerts):**
```json
{
"instrument": "UNH",
"direction": "put",
"strike": 270.0,
"expiry": "2025-08-01",
"confidence": 0.65,
"profit_target": 12.00,
"stop_loss": 3.00,
"size": 1,
"entry_price": 6.10,
"entry_timing": "open",
"signal_publish_time": "2025-07-27 20:30:45 EDT"
}
```
---
💡 Summary:
Bearish momentum confirmed across models.
Flow confusion ≠ fade setup — it’s a **calculated put play**.
Trade smart, stay sharp.
🎯 Watch \$290.
💬 Tag fellow traders → \ NYSE:UNH bears unite!
\#UNH #OptionsTrading #BearishSetup #UnusualOptions #GammaRisk #MaxPain #TradingView #StockMarket
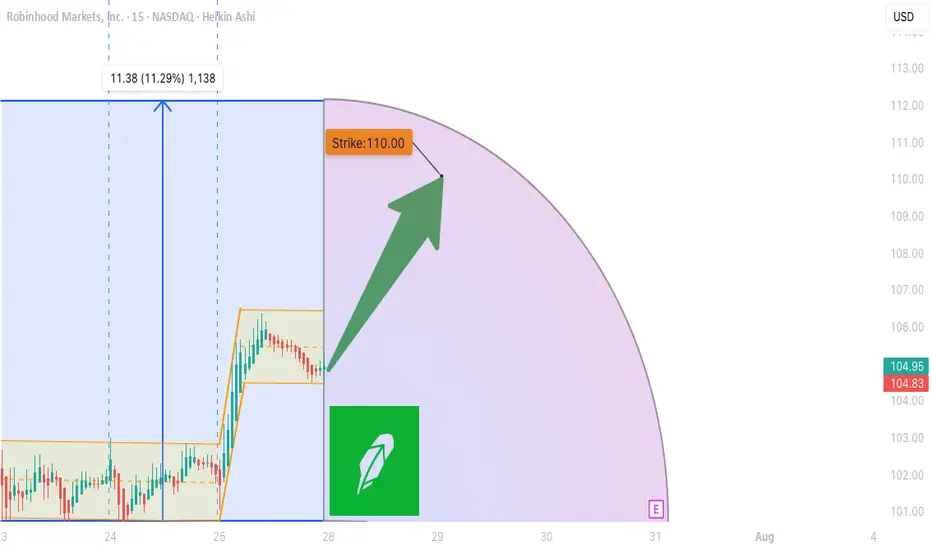
HOOD WEEKLY TRADE IDEA (07/27/2025)
**🚨 HOOD WEEKLY TRADE IDEA (07/27/2025) 🚨**
**BULLISH OPTIONS FLOW MEETS EVENT RISK CAUTION**
📊 **Options Flow Snapshot:**
📈 **Call Volume > Put Volume**
🧮 **Call/Put Ratio: 2.30** → **Institutional Bullish Flow**
📈 **Momentum Readings:**
* 🟢 **Daily RSI: Bullish**
* 🟡 **Weekly RSI: Mixed to Weak**
➡️ *Momentum is short-term positive, but not confirmed long-term*
📉 **Volume Insight:**
* **Only 0.7x** last week’s volume
➡️ *Lack of participation = ⚠️ caution*
🌪️ **Volatility Environment:**
* ✅ **Low VIX = Great Entry Timing**
* ❗ Fed Meeting ahead = Binary Event Risk
---
🔍 **Model Consensus:**
All 5 models (Grok, Claude, Gemini, Meta, DeepSeek) say:
🟢 **Moderately Bullish Bias**
✅ Bullish options flow
✅ Daily RSI uptrend
⚠️ Weak volume + Fed caution
---
💥 **TRADE SETUP (Confidence: 65%)**
🎯 **Play:** Long Call
* **Strike**: \$110
* **Expiry**: Aug 1, 2025
* **Entry**: ≤ \$2.90
* **Profit Target**: \$5.80 (🟢 100%)
* **Stop Loss**: \$1.47 (🔻50%)
📆 Entry: **Market Open Monday**
📦 Size: 1 Contract
📈 Risk-Reward Ratio: \~1:2
---
🧠 **Key Risks:**
* 📉 Volume Weakness = No confirmation
* ⚠️ **FED Event Risk** = Watch for Wednesday volatility
* ⏳ Theta decay as expiry nears
---
📌 **JSON TRADE DETAILS (for bots/scripts):**
```json
{
"instrument": "HOOD",
"direction": "call",
"strike": 110.0,
"expiry": "2025-08-01",
"confidence": 0.65,
"profit_target": 5.80,
"stop_loss": 1.47,
"size": 1,
"entry_price": 2.90,
"entry_timing": "open",
"signal_publish_time": "2025-07-27 15:09:35 EDT"
}
```
---
🔥 Stay sharp. Ride the flow, respect the risk.
👀 Watch volume + Fed headlines!
💬 Tag your team: \ NASDAQ:HOOD Bulls loading?
\#HOOD #OptionsTrading #UnusualOptions #FedWeek #WeeklyTradeSetup #TradingView #StockMarket