QuickView :FDXThe daily chart is rocking.
Bullish crossover, bullish Price action and Bullish ATR Break.
Looking for new positive price action.
Ready to catch it

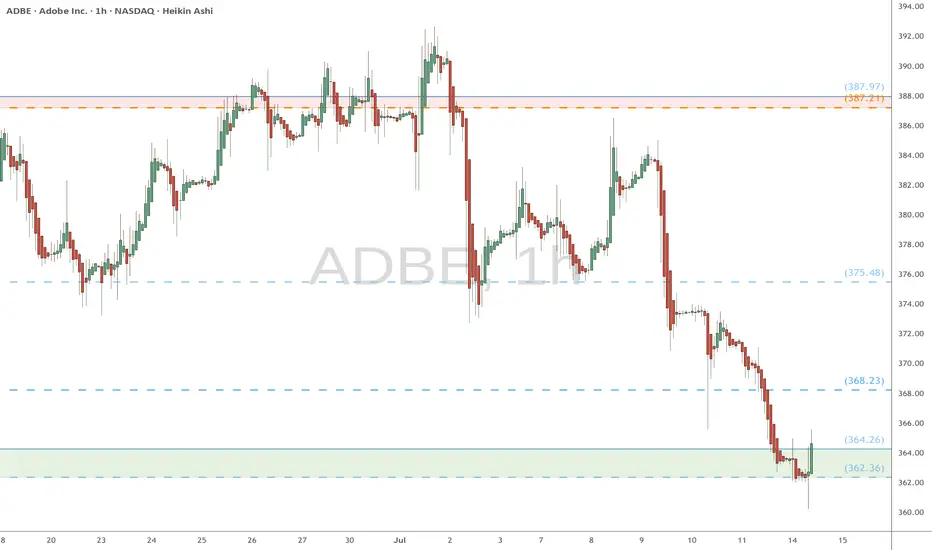
ADBE watch $362-364: Key Support zone must hold to end DownTrendADBE was struggling before last earnings and dumping since.
Currently trying to lift out of a significant support at $362-364
Looking for a Break-n-Retest of zone top Genesis fib at $324.26
.
APLD heads up at $13.10: Golden Genesis fib may stop the SurgeAPLD on a massive surge over various company news.
Currently about to hit a Golden Genesis fib at $8.10
Looking for usual Dip-to-Fib or Break-and-Retest to buy.
It is PROBABLE that we "orbit" this fib a few times.
It is POSSIBLE that we get a significant dip from here.
It is PLAUSIBLE that we break and run if bulls are hyper.
.
See "Related Publications" for previous EXACT plots --------------------->>>>>>>
.

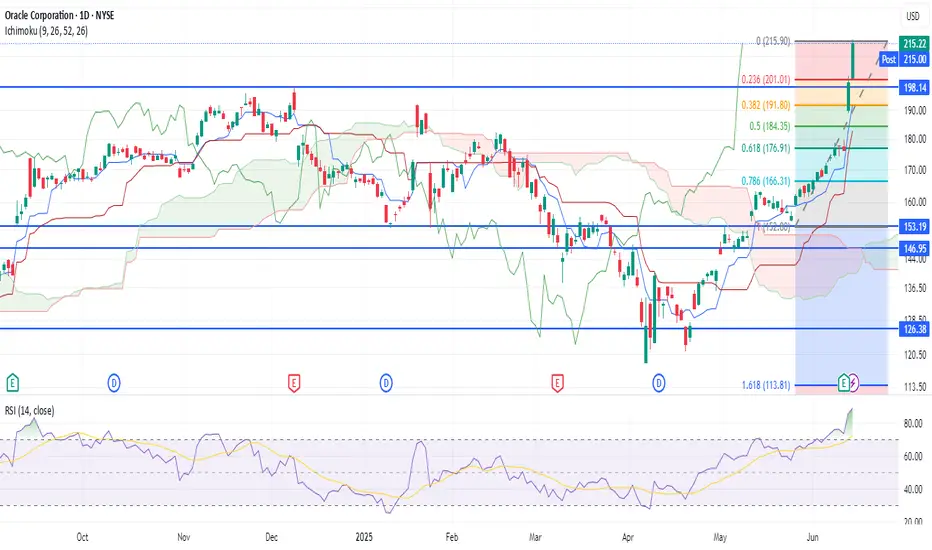
ORCL SELL SELL SELL NEVER EVER EVER EVER UNDER ANY CIRCUMSTANCE DO YOU BUY A STOCK WITH AN 89 RSI!!! NEVER ORCL is a strong sell here, once it corrects it might be a buy again based off the blowout earnings and forecasts. But today, we be way ahead of ourselves boys and girls. We should easily retrace to fib .5 $184.35 and next Fib .618 $176.91 possibly a complete gap fill in coming days/ weeks but no matter what the pumpers say it's not a buy here!!!!! Today
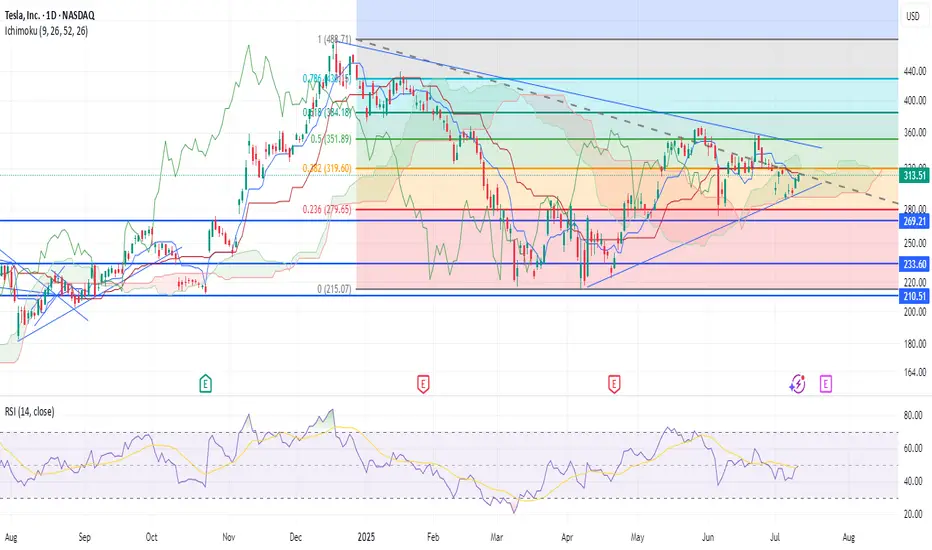
TSLA BUY+++ WEDGE FORMING $339 first targetTSLA, like AAPL, is forming a bullish wedge which likely will break to the upside. First target is $339 at wedge resistance then will reevaluate
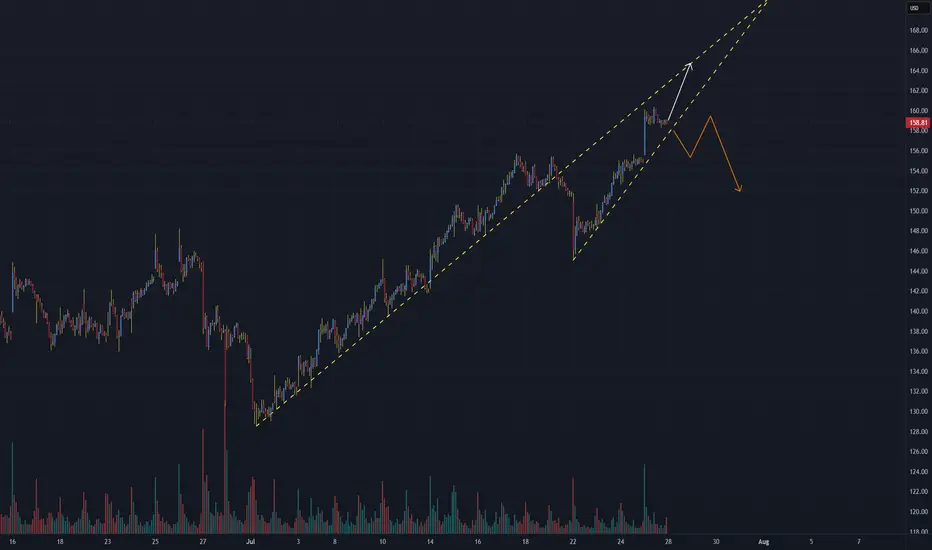
PLTR - Rising wedge formation leads to potentially larger move🧠 PLTR WEEKLY TECH+FUNDAMENTAL BRIEF
Ticker: NASDAQ:PLTR | Sector: AI / Big Data / Defense Tech
Date: July 27, 2025
🔍 Chart Watch: Rising Wedge Risk
Palantir is trading within a rising wedge formation, a pattern often signaling bearish reversal if upward momentum fades. Recent price action has tightened within this channel, and volume has been declining—a potential warning sign.
🔧 Key Technical Levels
Short-Term Resistance: $145–146
Short-Term Support: $140.50 → $137 → $132
Breakout Target: $150–155
Breakdown Risk: Below $137 could trigger $132–128
Trend Watch: If price holds wedge support, PLTR could climb toward the $150–155 range. A breakdown targets prior support at $135 or lower. Watch volume for confirmation.
💼 Palantir Fundamentals Snapshot
Q1 2025 Revenue: $884M (+39% YoY)
U.S. Commercial Growth: +71% YoY
Operating Margin: 36%
Free Cash Flow Margin (Projected): >40%
Cash Position: ~$4B
Profitability: GAAP positive for 7 straight quarters
Valuation: Forward P/S ~92–120x, Forward P/E ~200–230x
⚠️ High valuation implies heavy dependence on earnings momentum and contract wins. Any slip could lead to outsized pullbacks.
🧠 AI & Government Catalysts
Palantir continues to dominate the intersection of AI deployment and government data operations.
Notable Drivers:
$795M U.S. DoD Contract
Deep integration with agencies including CDC, IRS, Army, ICE, NHS
AI tools (AIP) deployed across sectors; strong commercial traction with Accenture, SAP, Microsoft Azure
Positioned as a critical AI infrastructure provider for NATO & U.S. defense modernization
AI Bootcamp strategy converting trial users into full deployments at scale
📆 What’s Ahead?
🔜 Upcoming Catalysts:
Q2 2025 Earnings (Early August):
Expected revenue: ~$937M (38–54% YoY growth range)
Federal Government Contracts:
Expansion of Project Maven, battlefield AI systems, and civilian data tools
AI Legislation & Spending Bills:
Ongoing policy developments could support longer-term tailwinds
🧭 Summary & Outlook
Timeframe Support Levels Resistance Levels Outlook Summary
Short-Term $140.5 → $137 → $132 $145–146 → $150–155 At wedge support. Breakdown could target low $130s unless buyers defend.
Near-Term $144.8–149.1; then $137 $159–160 → $170 (post-earnings) Strong fundamentals, but rich valuation demands execution.
🧩 Bottom Line:
PLTR remains an AI and defense-tech heavyweight. However, its current chart setup suggests caution in the near term. Watch for decisive moves around $145 and $140. Long-term bullish thesis remains intact, but the next move may hinge on Q2 earnings and AI contract flow.
Stay nimble.
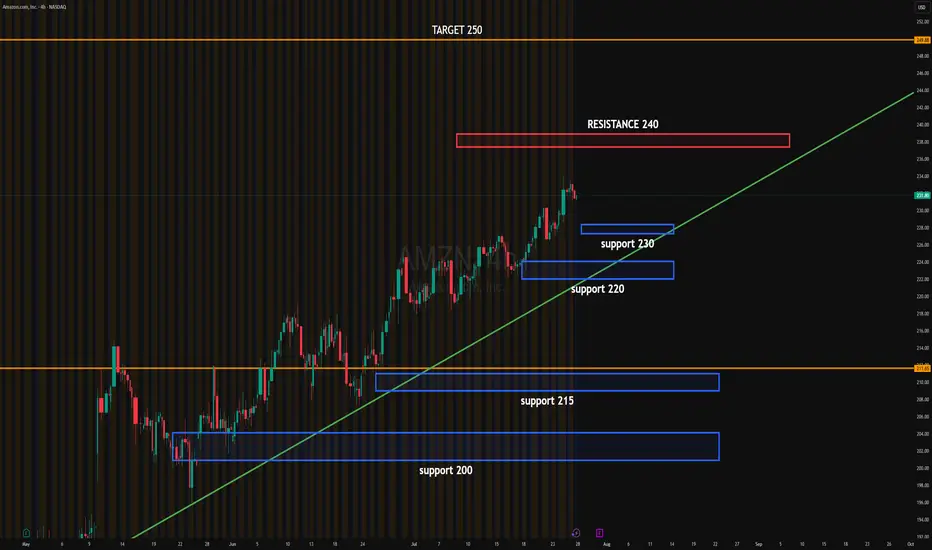
AMZN EARNINGSAMZN price action update:
Price is consolidating below the 240 resistance after a steady climb. Buyers are defending the 230 level, showing signs of absorption just above the ascending trendline.
The 233.50 breakout level could trigger momentum towards the 240 resistance. If breached, institutional targets extend toward 250.
Current consolidation suggests the Market Maker is trapping liquidity below 230 while buying time for a directional move.
Upside target: 250
Downside target: 220 if 230 fails
#AMZN #globaltrade #investment #investing #stockmarket #wealth #realestate #markets #economy #finance #money #forex #trading #price #business #currency #blockchain #crypto #cryptocurrency #airdrop #btc #ethereum #ico #altcoin #cryptonews #Bitcoin #ipo
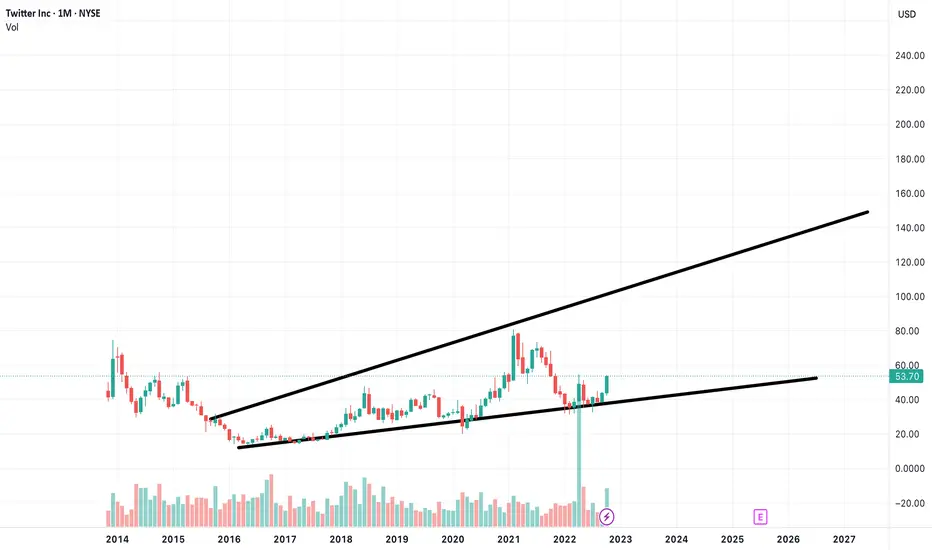
X on its way to 100 dollars a share!The new updates on the website since 2021 has made the ability for someone to make money while posting, they have just added a Job board for people to seek employment. The X team also has one of the best Paid adertisements that are helpful for the viewer who is on the computer on their profile to help them and above all the website is full of very pretty girls to talk to. This makes tender look like its better for finding Boys / Girls, Its better for Finding jobs and above all its great for content and making money as a poster on X.
$HIMS gann arc if the arc breaks we gravitate up to the next one. This combined with a cup and handle!

BofA note: : Excellent setup w/catalysts from mobile gaming & adConfirmation of self-serve launch would put story on track: APP remains top pick under coverage. We see big upside to CY26 EBITDA expectations, with this print potentially prompting upward revisions; the vast majority of investors we spoke with appear to exclude both a continued managed service onboarding ramp, and a major self-serve ramp in CY26. This quarter, management has the opportunity to
(1) confirm the launch timing of APP’s eCommerce self-serve platform for small advertisers,
and
(2) indicate the resumption of onboarding of larger merchants to its managed service. About one third of investors we spoke with expect the self-serve platform to launch this Fall, and ~40% expect a launch during the holiday shopping season. Despite this, expectations of Q3/Q2 growth appear too conservative; APP’s managed service would resume onboarding well before self-serve launches.
Mobile game ads could drive big Q2 expectations beat: Based on client conversations, 2Q25 Advertising Revenue expectations are above guidance of $1.20Bn (+4%-5% Q/Q as usual), but in line with BofA’s $1.26Bn (+9% Q/Q). Few investors we spoke with assumed a performance break-through (eg “model enhancement”) in Q2, but virtually all are above guidance. Mobile game engagement and ad load continued to trend upwards in Q2, giving our model some fundamental support. We assume flattish Q/Q eCommerce revenue, although a first cohort managed service advertisers is known to have tested APP’s new AI dashboard. We removed APP’s 1P games segment from our consolidated model as APP will report it in discontinued operations from Q2 onwards; we estimate an incremental $30mn of Advertising net revenue contribution from
divested 1P studios in Q3 onwards.
Q3 & CY25 expectations likely too conservative: Few investors we spoke with appear to assume a Q3 (1) a model enhancement or (2) an eCommerce managed service ramp, putting BofA’s $1.42bn well above the vast majority of clients. The likelihood of a model enhancement rises with each passing quarter, making upward revisions likely post print. We change CY25 Revenue/EBITDA forecast to $5.8bn/$4.5bn from $6.2bn/$4.6bn to reflect the divestiture of APP’s 1P games segment in Q2.

BofA note: Revenue strength could ease AI spending uncertaintyStrong Q can reinforce confidence in AI ad engine: With AI ROI a key stock sentiment driver, 2Q positives could include:
1) Ad rev upside reinforcing confidence in Meta’s AI ad engine,
2) strong road map for 2H ad products,
3) optimism on new revenue opportunities for AI (Llama licensing, subscriptions, etc.) With Street likely anticipating 2Q revenue upside, risks are high expectations and higher expenses offset revenue revisions. Also, EU regulatory uncertainty is likely to continue.
AI positioning optimism reinforced by performance:
Given recent CEO posts, we expect big focus on AI investment and opportunities on the call, with possible updates on Llama and AI monetization strategies. Given audience scale, we continue to see Meta as one of the best AI opportunity stocks, with potential revenue upside as AI capabilities are integrated into the ad stack. At 24.5x our 2025 EPS, and with more investment coming, continued rev. momentum (which we expect) and a convincing AI product roadmap are key for maintaining sentiment & multiple.

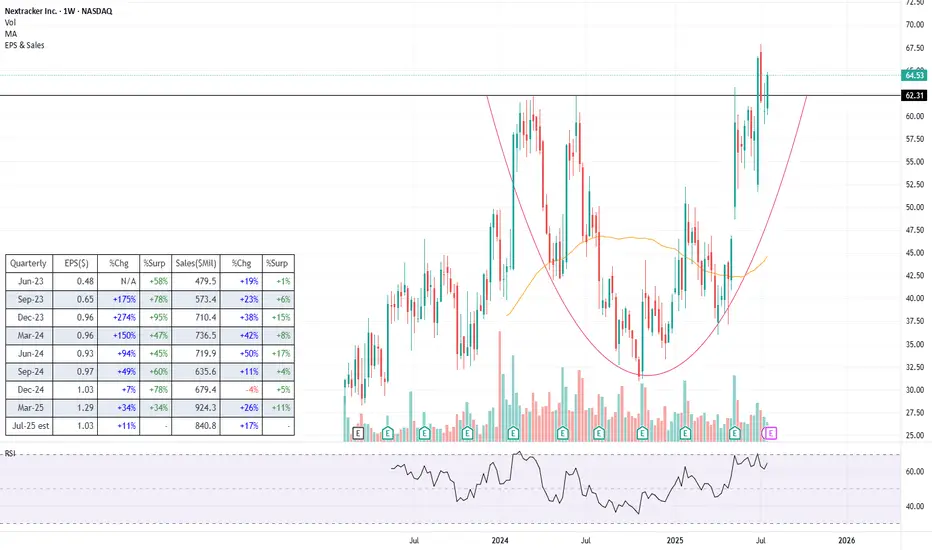
NXT (Long) - Clean energy player with even cleaner financialsLet's preamble with what the company actually does (as I imagine a lot of traders trade without even bothering... understandably). In short, Nextracker operates in the solar energy space where it is a leader in providing energy output optimization solutions, i.e. mechanical systems that rotate solar panels to follow the sun, along with software (TrueCapture) that uses sensors and machine learning to fine-tune positioning in real time.
Fundamentals
NASDAQ:NXT has been growing very strongly in recent years (see the table) despite the numerous hiccups this space has seen since 2022. There is also a backlog of $4.5bn , giving us clear visibility into the next year. Profitability is strong with earnings growth even outpacing revenue growth, showing strong operating leverage .
This all comes on the back of a relatively cheap valuation , with P/E of just below 18, which is significantly lower than some of its competitors like NYSE:NVT at 52, and NYSE:RRX at 43. No clear reason for why the markets are discounting the stock.
The balance sheet is rock solid , with no debt and $766m in cash. Moreover, free cash flow is plentiful with the firm most recently generating $622m in FCF.
Overall, the company is growing, has strong financials and is cheaply valued compared to its competitors - the kind of smoothie I usually look for. One obvious risk is policy , given that the current administration doesn't really see eye to eye with renewables and two thirds of NXT's revenue still comes from the US.
Technicals
Just breaking into an all-time high is a nice-to-have advantage when entering a new trade. The stock is breaking out from a decent, almost year-and-half long base , though I would prefer the base to be a tad more prolongated.
The stock broke the ATH on higher volume, pulled back to around the breakout point and is currently establishing the next leg higher
The price is some distance away from its moving averages, so there is a chance that there still might be some more consolidation around this level before we proceed higher
Trade
Main caveat is that the stock is about to release its earnings on Tuesday , so naturally it is a slight gamble to buy ahead of it. I decided to jump in beforehand just because I have strong conviction (and I love to punch the wall when I always get it wrong), but I would advise others to first wait on the results as a potential catalyst.
For gamblers like myself, the ATH breakout point likely serves as the best possible stoploss (black line).
One more reason why these earnings in particular could be even more of a gamble is that the BBB bill was passed since the last earnings, so if the executives decide to sprinkle the release with some not-so-positive comments regarding that, it could spook investors.
Follow me for more analysis & Feel free to ask any questions you have, I am happy to help
If you like my content, please leave a like, comment or a donation , it motivates me to keep producing ideas, thank you :)
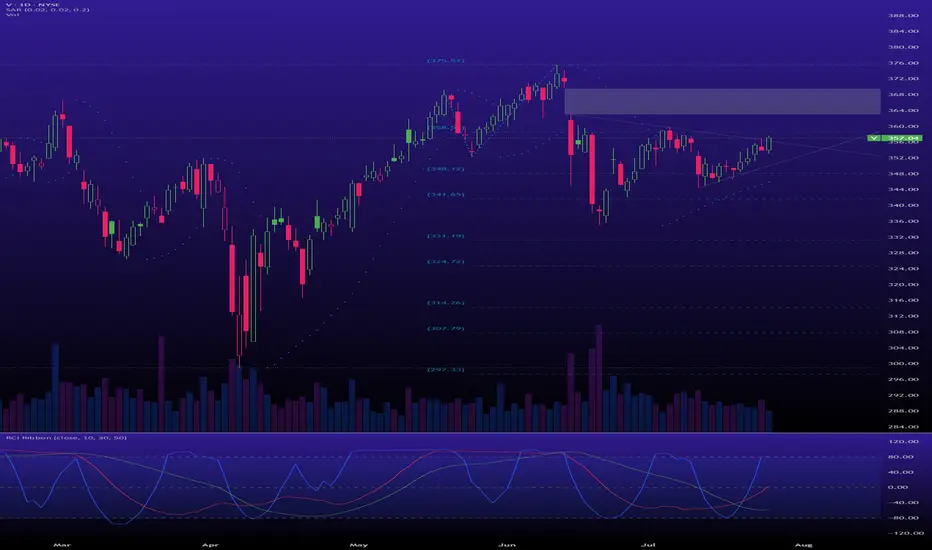
betting that $V jumps up to the gap this weekVisa is just taking a breather before its next vacation to the upper Bollinger Bands, so get ready to profit from its upward journey with a strategically placed call spread
betting that UPS already forms a bottomUPS is showing off its daily muscles, but the weekly chart still looks like it's recovering from a marathon.

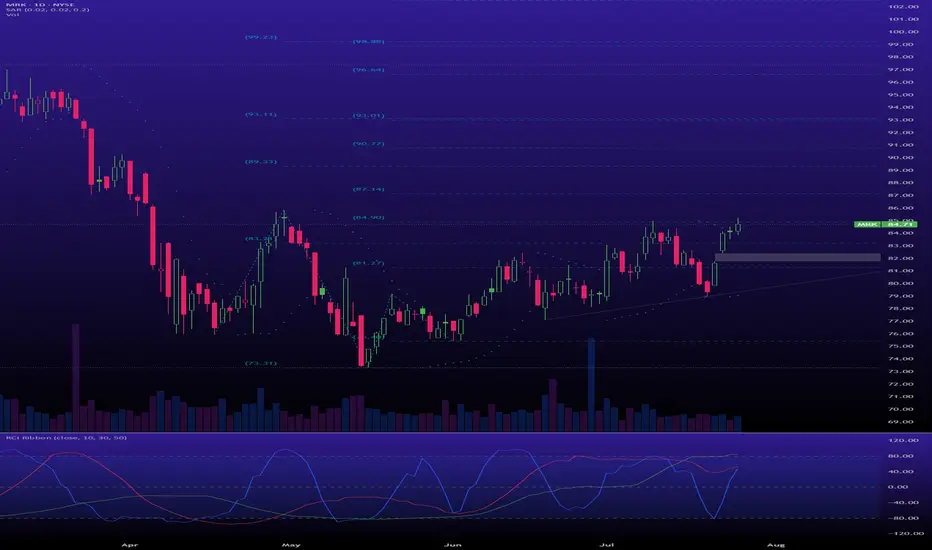
MRK potentially enters the Wyckoff accumulation phase this week.The weekly chart points strongly towards a stock emerging from a prolonged Markdown Phase and potentially entering Accumulation (Phase C), with signs of strength appearing.
Merck is basically yelling 'buy me' across all timeframes, so I'm jumping into a long call
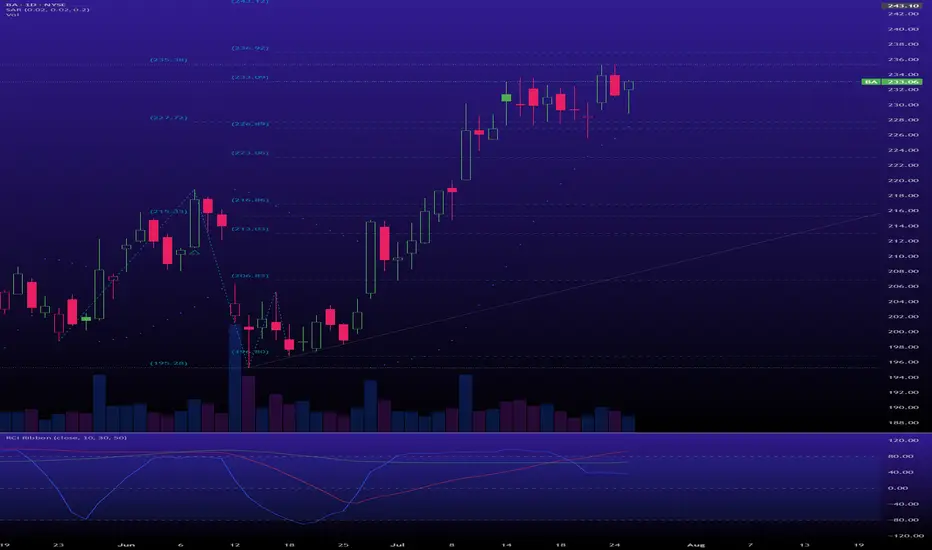
240c exp 08/15 for $BA its earnings report on TuesdayGiven Boeing's weekly chart is screaming 'to the moon' while the daily chart is just taking a breather, my money's on a bull call spread – because even a rocket needs to refuel before hitting warp speed
APPLE: Weak Market & Bearish Continuation
Looking at the chart of APPLE right now we are seeing some interesting price action on the lower timeframes. Thus a local move down seems to be quite likely.
Disclosure: I am part of Trade Nation's Influencer program and receive a monthly fee for using their TradingView charts in my analysis.
❤️ Please, support our work with like & comment! ❤️
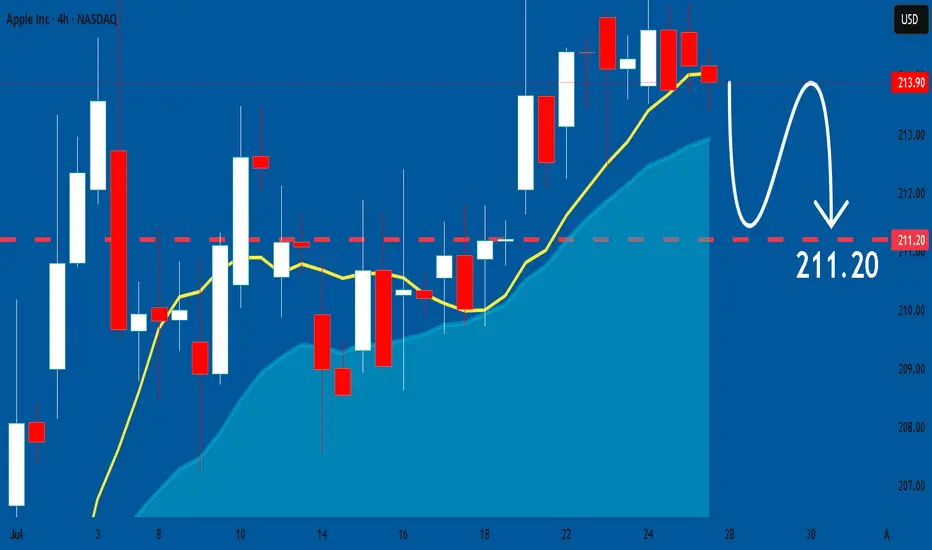
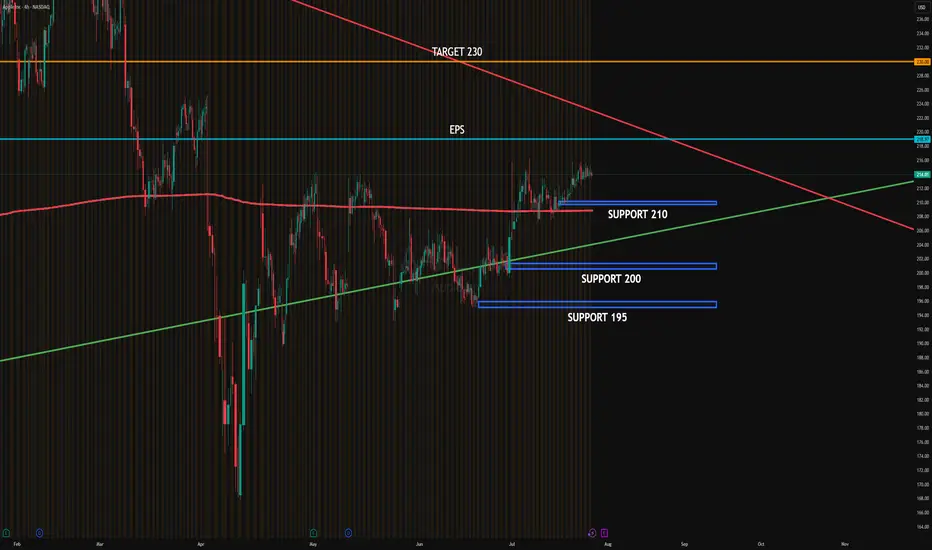
AAPL EARNINGSAAPL is consolidating just below the post-EPS resistance zone near 219, while institutions are actively defending support around 210. There's visible absorption at 210 and 205, aligning with high PUT interest, suggesting a strong institutional floor.
Distribution is evident in the 220–225 area, where CALLs are being sold to cap upside and benefit from theta decay.
Upside target: 230 if price breaks above 225 with volume.
Downside target: 200–195 if 210 fails to hold.
#AAPL #globaltrade #investment #investing #stockmarket #wealth #realestate #markets #economy #finance #money #forex #trading #price #business #currency #blockchain #crypto #cryptocurrency #airdrop #btc #ethereum #ico #altcoin #cryptonews #Bitcoin #ipo
HOOD EARNINGSHOOD is holding the 100 support zone after a high-volume sell zone near 114 from a $3.2B unload. Market makers defended the 100 level with PUT selling, suggesting institutional absorption. Price is consolidating above trendline support and may trigger a gamma squeeze if it breaks above 106 with volume.
Upside target: 140
Downside target: 100, then 85–80 if broken
#HOOD #globaltrade #investment #investing #stockmarket #wealth #realestate #markets #economy #finance #money #forex #trading #price #business #currency #blockchain #crypto #cryptocurrency #airdrop #btc #ethereum #ico #altcoin #cryptonews #Bitcoin #ipo

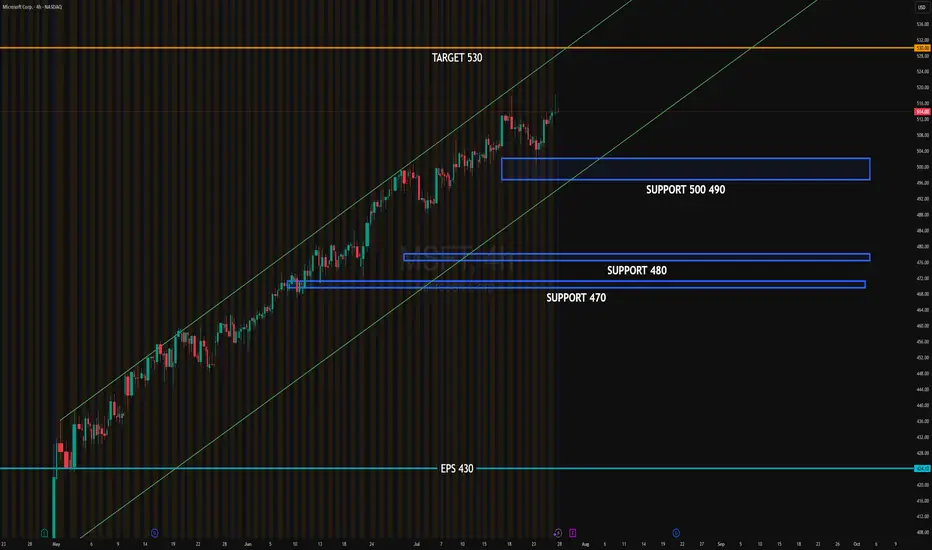
MSFT EARNINGSMicrosoft (MSFT) is consolidating near the upper edge of its ascending channel, with strong institutional defense between 490–500. The 510–520 range shows absorption and may trigger a directional breakout. A close above 515 could ignite momentum toward 530.
Upside target: 530
Downside target: 490 (support) then 480
#MSFT #globaltrade #investment #investing #stockmarket #wealth #realestate #markets #economy #finance #money #forex #trading #price #business #currency #blockchain #crypto #cryptocurrency #airdrop #btc #ethereum #ico #altcoin #cryptonews #Bitcoin #ipo
Orion Group Holdings, Inc. (ORN) Builds Marine ProjectsOrion Group Holdings, Inc. (ORN) is a specialty construction company focused on marine, industrial, and infrastructure projects across the U.S. and Caribbean. The company provides services like dredging, concrete construction, and marine facility development for both public and private clients. Orion’s growth is driven by rising infrastructure spending, coastal resilience projects, and ongoing demand for complex marine and civil construction solutions.
On the chart, a confirmation bar with rising volume signals bullish momentum. The price has entered the momentum zone by moving above the .236 Fibonacci level. A trailing stop can be placed just below this level using the Fibonacci snap tool to protect gains while allowing further upside potential.

META EARNINGSMETA is consolidating below resistance at 720, with visible absorption just under 710. Institutional activity shows active PUT selling at 700 and directional BUY CALLs around 715–720. This suggests accumulation and potential upside pressure.
If price closes above 715 this week, a breakout toward 725–730 becomes likely, especially ahead of earnings. Support remains firm at 700, with a deeper level at 620 if rejection occurs.
Upside target: 745
Downside target: 700, then 620 if broken
#META #globaltrade #investment #investing #stockmarket #wealth #realestate #markets #economy #finance #money #forex #trading #price #business #currency #blockchain #crypto #cryptocurrency #airdrop #btc #ethereum #ico #altcoin #cryptonews #Bitcoin #ipo

Could this break!?It seems the stock is now found on a range within the EMA9 and EMA21.It now draw a hammer pushing up and heading to test the SMA50.