$MSTR ONCE IN A LIFETIME FIBONACCICall me CRAZY but my target is 677 🎯
First entry at 236 ALGOS stepped in the GOLDEN ZONE
Looking to RELOAD on LOW RISK HIGH REWARD SETUPS ONLY
I will give my exact entries LIVE all I ask is Drop a "❤️"

How 3 Bullish Timeframe Signals Suggest a Buy Opportunity on AMDHow 3 Bullish Timeframe Signals Suggest a Buy Opportunity on AMD Stock
AMD stock has flashed a compelling multi-timeframe buy signal based on a weekly breakout, daily reversal, and 4H stochastic
momentum shift—all aligned with the 50 and 200 EMA and Stochastic RSI indicators.
---
Advanced Micro Devices (AMD) is showing a promising technical setup for bullish traders. An alignment across the weekly, daily,
and 4-hour charts is sending a powerful message: momentum may be shifting in favor of buyers.
This article breaks down how two key indicators—EMA (50 and
200) and the Stochastic RSI—are lining up across three timeframes to support a potential upward move.
---
Weekly Chart: Breakout in Progress
The first signal comes from the weekly chart, where AMD has broken above a recent resistance level. Price has cleared previous
consolidation highs while staying well above both the 50 EMA and 200 EMA, a classic sign of long-term strength.
This breakout is significant because weekly chart patterns carry more weight and often lead to sustained price trends. The bullish
separation of price from the 50 and 200 EMAs is a signal that long-term traders are regaining control.
---
Daily Chart: Reversal Pattern Confirmed
On the daily chart, a clear reversal has taken shape. After a recent pullback, AMD found support near the 50 EMA and bounced
higher. The 200 EMA remains below, confirming the overall bullish structure.
This bounce is further validated by the Stochastic RSI crossing
back above the oversold region, a strong signal that short-term selling pressure has been exhausted. When momentum indicators
and price structure both confirm a reversal, it often leads to an upward follow-through.
---
4-Hour Chart: Early Momentum Reversal
Drilling down into the 4-hour chart, a timely reversal is unfolding.
AMD rebounded strongly from a lower support zone while holding above the 50 and 200 EMAs. Most notably, the Stochastic
RSI has crossed bullishly, confirming the momentum shift from sellers to buyers.
This 4-hour signal adds precision to the daily and weekly bullish bias. Short-term traders may use this to fine-tune entries, while
longer-term investors may see it as confirmation to scale into positions.
---
Conclusion: Multi-Timeframe Confluence Supports a Buy Bias
When the weekly, daily, and 4-hour charts align with bullish
signals from both price action and indicators like the EMA (50 and 200) and Stochastic RSI, the odds often favor the bulls.
While no signal is guaranteed, this kind of multi-timeframe confluence is rare and valuable. It suggests momentum is building
from the ground up—starting with short-term traders and expanding into longer-term buying interest.
---
Disclaimer:
This article is for educational purposes only and not financial advice. Use a simulation trading account before you trade with
real money and learn risk management and profit-taking strategies. Trading is risky and past performance does not
guarantee future results.
---

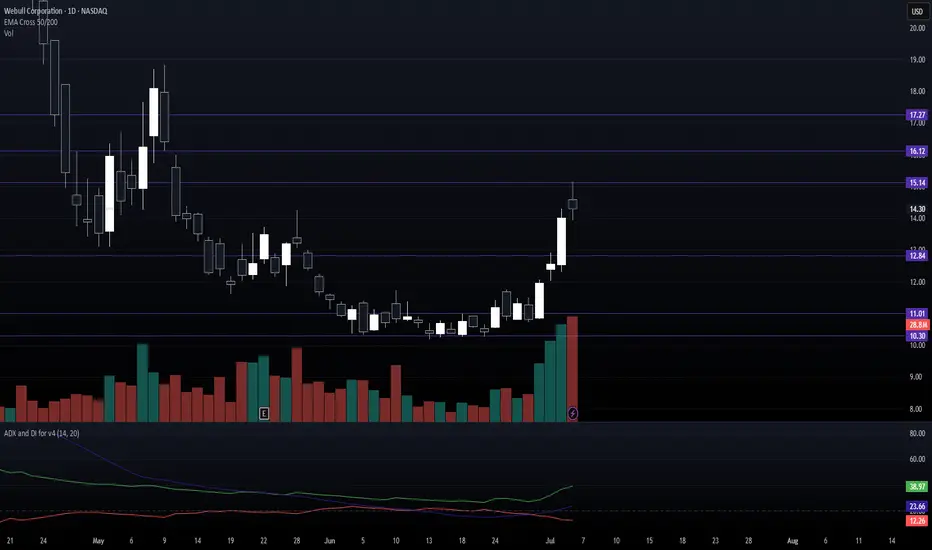
webull buy x robinhood buy webull: 24 million registered users and 4.7 million funded accounts managing $12.6 billion in assets as of Q1 2025
x
Robinhood: recently launched tokenized U.S. stocks and ETFs in Europe, enabling round‑the‑clock 24/5 crypto‑style trading and exposure to private companies like SpaceX and OpenAI : Mizuho raised its price target to $99, Cantor Fitzgerald to $100, and KeyBanc to $110 Q4 2024 EPS estimates up 322% year-over-year, and full-year 2024/25 earnings forecasted to grow by 231%/22%
bigger picture
Retail now constitutes roughly 20–21% of daily trading volume
Brokerages like Webull and Robinhood, offering strong margins, advanced tools, and retail accessibility, are driving the new wave of democratized finance empowering traders amid record market participation and innovation. lots of volume here
should expect these two to have a good quarter and next
price target by end of july
NASDAQ:BULL 16.00 range
NASDAQ:HOOD 101.00+
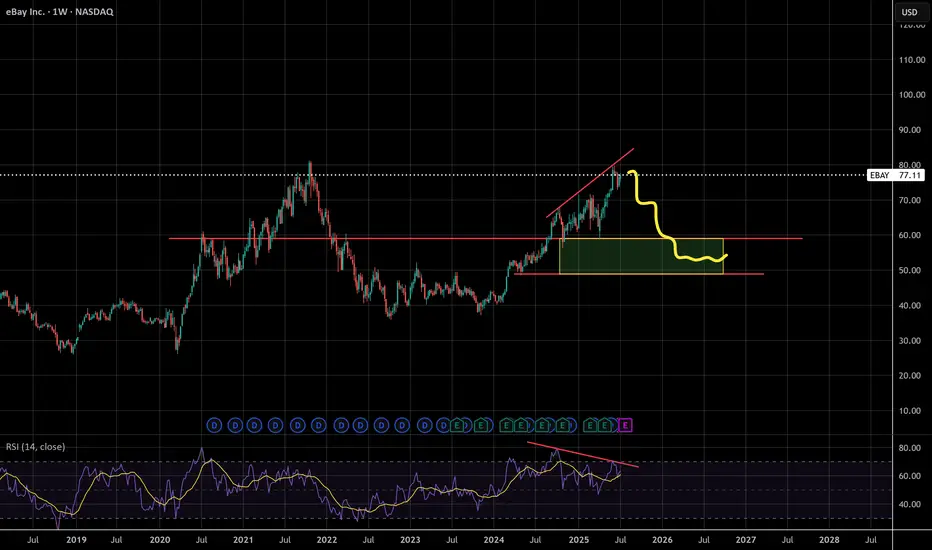
Ebay RSI flashing warnings - Handle forming?Looks like it may be forming a cup and handle, bearish divergence on the RSI
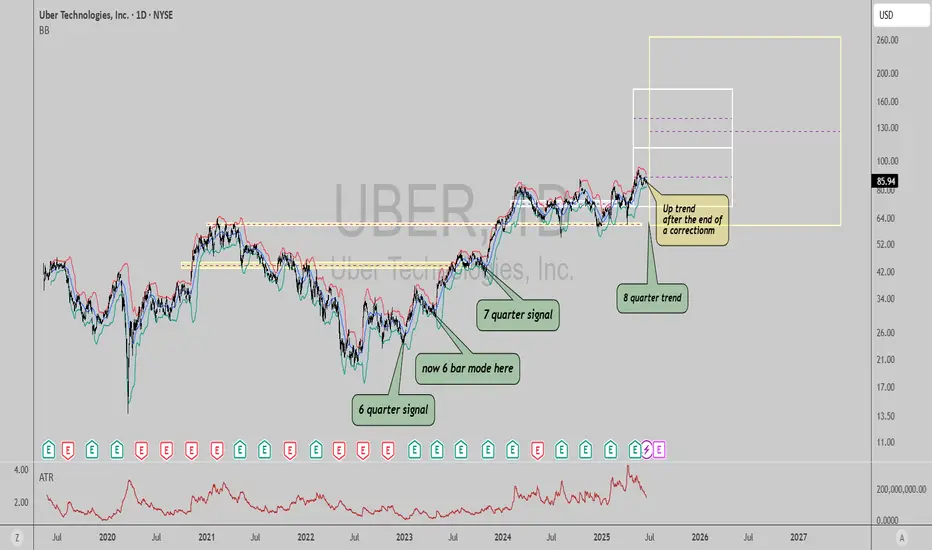
$UBER: Why $UBER Is a Robotaxi WinnerUber is on the verge of a major transformation, with robotaxis set to become a game-changing profit engine.
Technical charts indicate we can enter a long position today with low risk, while aiming for a long term rally resumption from here. Monthly and quarterly timeframe Time@Mode trends are bullish, suggesting price can reach heights between $111, $176 and $265 per share long term.
Here’s why the future looks bright for Uber investors from a fundamental perspective:
The global robotaxi market is projected to surge from $0.4B in 2023 to $45.7B by 2030, with Uber aggressively expanding its autonomous fleet in the U.S. and Europe through partnerships.
Uber’s approach is to integrate autonomous vehicles from partners (Waymo, May Mobility, Momenta, Avride, Volkswagen) into its platform, avoiding the massive costs and risks of building its own AVs.
Autonomous vehicles will slash Uber’s largest expense -driver payments- unlocking higher margins and scalability. CEO Dara Khosrowshahi calls AVs Uber’s “greatest future opportunity” for profit expansion.
Robotaxi pilots are already live in cities like Austin, with plans to expand to Atlanta, Dallas, and Europe by 2026. The average Waymo vehicle on Uber is busier than 99% of human drivers, showing strong demand and efficiency.
Uber’s core business is robust: Q1 2025 gross bookings up 14% to $42.8B, net income of $1.8B, and adjusted EBITDA up 35% to $1.9B. This profitability funds AV investments without sacrificing financial health.
Uber is uniquely positioned to lead the robotaxi revolution, leveraging its platform, partnerships, and financial strength. As AVs scale, expect a step-change in profitability and long-term shareholder value.
Best of luck!
Cheers,
Ivan Labrie.
History tends to repeat itselfHistory typically tends to repeat itself. What has happened before can happen again. Take a look at the left side of the chart and you’ll see a picture-perfect breakout pattern: price consolidates, forms higher lows and relatively equal highs, all on high volume, before breaking out. Now, we are witnessing the same setup again on a larger scale. Above is a monthly chart of SMCI, allowing you to compare the similarities between the two breakout formations. What has gone parabolic before can go parabolic again. Earnings will be reported on August 12, which is roughly one month away. If SMCI continues to push higher here, we may see a move toward the all-time high of $122.90. Always do your own due diligence and keep risk management in mind.
Not financial advice.

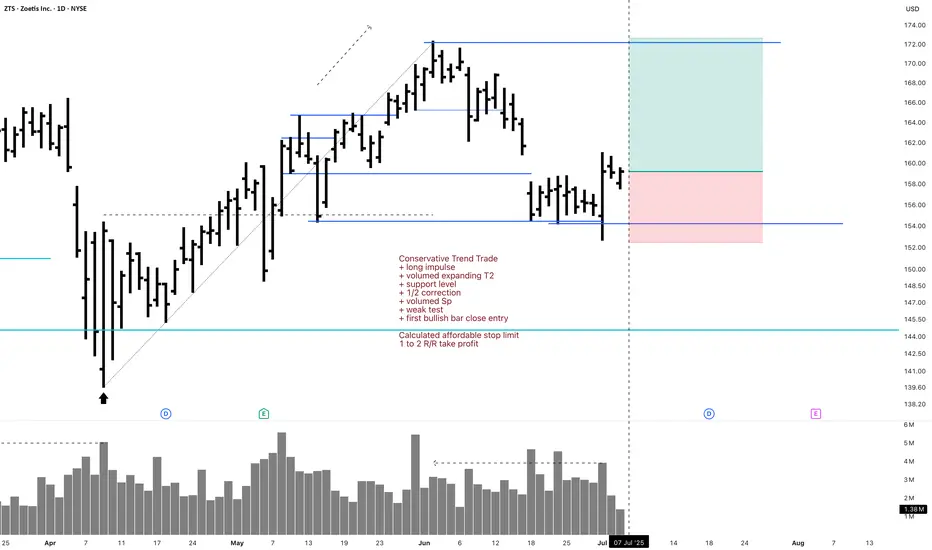
ZTS Investment 1D Long Conservative Trend TradeConservative Trend Trade
+ long impulse
+ volumed expanding T2
+ support level
+ 1/2 correction
+ volumed Sp
+ weak test
+ first bullish bar close entry
Calculated affordable stop limit
1 to 2 R/R take profit
Monthly trend
"+ long impulse
+ ICE level
+ support level
+ 1/2 correction
+ volumed 2Sp
+ weak test?"
Yearly trend
"+ long impulse
- correction"
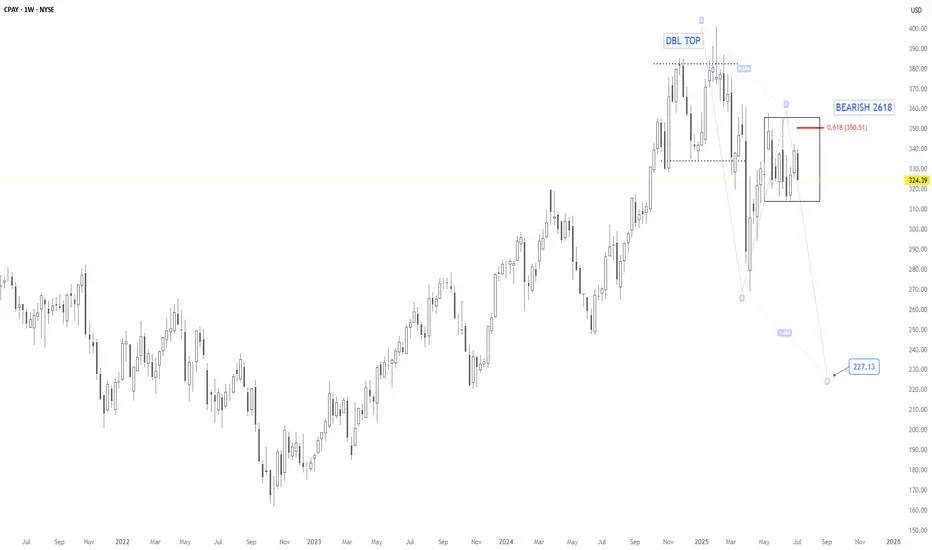
(W) Bearish Setup in PlayNYSE:CPAY – BEARISH 2618
Weekly chart confirms a Technical Double Top pattern around $370–$380, followed by a textbook Bearish 2618 retracement.
🔍 Key Confluences:
Double Top confirmed, neckline broken.
Price retested 0.618 Fib retracement at $350.51 (aligning with weekly resistance).
Bearish 2618 pattern projects downside potential toward $227.13.
First support to watch: $313.97, followed by $269.02.
🧭 Bearish outlook favored unless weekly close reclaims $355+. As long as price stays below that level, sellers remain in control.
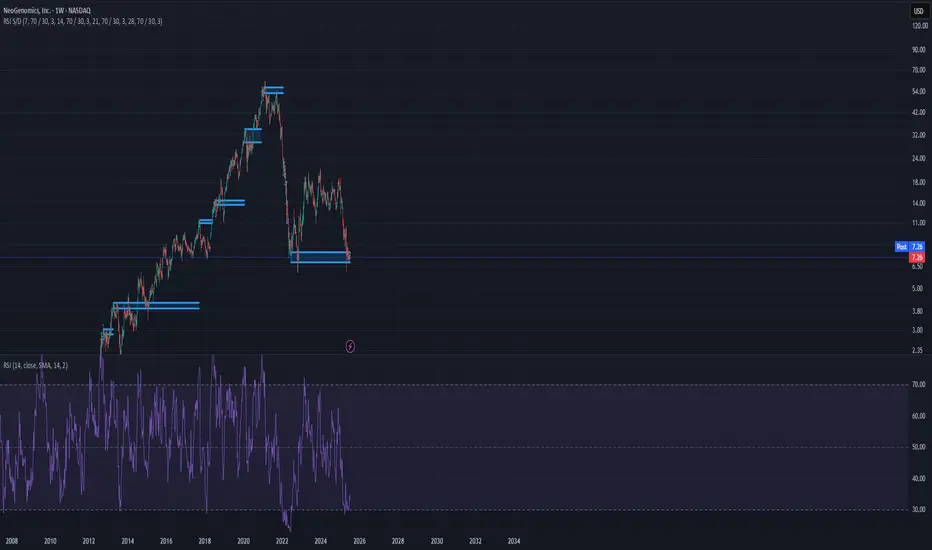
Generational bottom is in. Breakout has begunAfter forming a bullish wedge for a few months, the price went sideways for another 3 months which is a very good sign that the bottom is in.

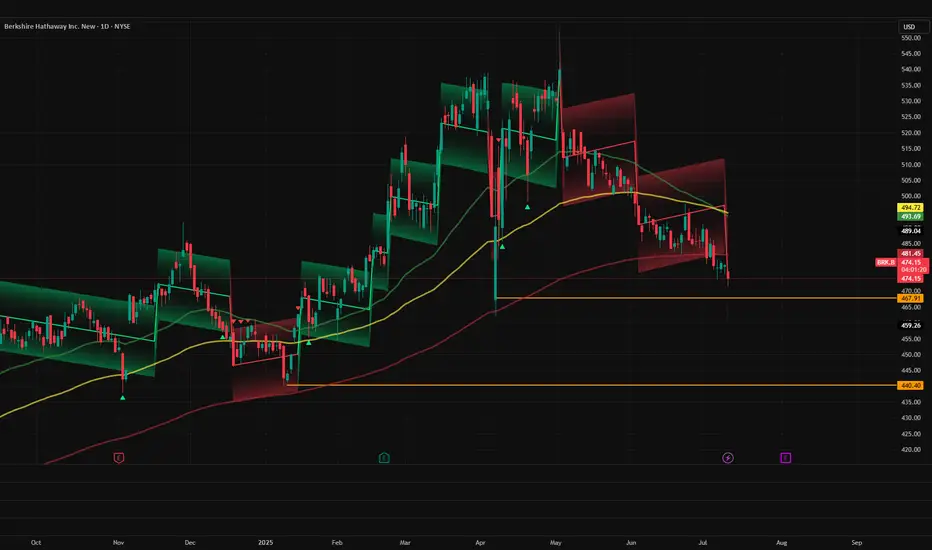
What's the deal with BRK.B?! Where is the short term bottom?I'm pretty new to this, so I'm looking to see if anyone has any thoughts about BRK.B. The best looking support is the April low, but it seems like it could fall below to the Jan 2025 low with the way it is steadily dropping. That would suck! I'm averaged at $491 and prefer not to see it go that low, but I will be holding very long-term anyway.
Any thoughts on a bottom? They hold 300+ billion in cash, so surely they'll figure out what to do with it soon. *Fingers crossed*
A 50% increase in a short time This stock presents a compelling opportunity, backed by strong fundamentals and a healthy financial outlook. On the technical side, it's forming a bullish chart pattern with clear support levels — indicating strong institutional interest. The setup suggests potential for a breakout if current momentum continues.
Watch list candidate!This guy looks interesting. I see two swing sets shaping up. First is an inverted head and shoulder, and second is cup and handle. This looks coiled to me, and very similar to NASDAQ:APLD in March 2025. Good luck
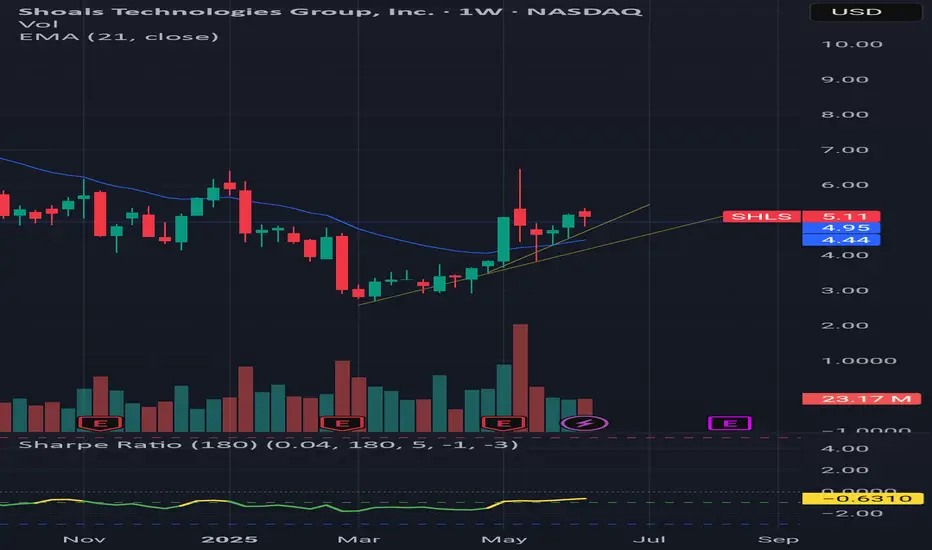
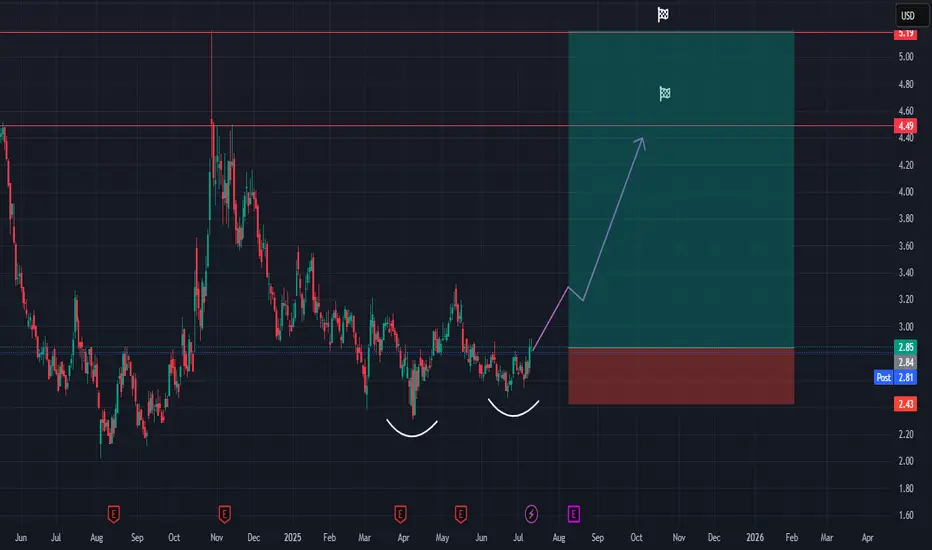
LAC (Lithium Americas Corp) – Bottom Reversal with Higher Low FoThe LAC stock chart suggests a confirmed bottom structure, supported by a clear higher low pattern—a strong technical signal that downward momentum has likely ended and a trend reversal may be underway.
After an extended downtrend, the price has formed a rounded bottom with two notable troughs, indicating accumulation and base building. The most recent low is higher than the previous one, marking a bullish higher low, which strengthens the case for a trend reversal.
Key Technical Signals:
Confirmed bottom: Rounded bottom pattern over the past several months.
Higher low: Recent price action has respected prior support and pushed higher, a bullish sign of strength.
Breakout zone: Price is currently challenging resistance in the ~$2.80–$3.00 range. A sustained move above this area would confirm bullish breakout momentum.
Upside targets:
First target: ~$4.49 (prior support turned resistance)
Second target: ~$5.19 (key historical resistance zone)
Trade Setup:
Entry: Current breakout attempt (~$2.85)
Stop-loss: Below recent higher low (~$2.43)
Risk-reward ratio: Favorable, targeting ~60–80% potential upside with limited downside risk.
Summary:
LAC is showing signs of a long-term trend reversal, with a confirmed bottom and bullish higher low. If momentum continues, a breakout rally toward previous resistance levels is likely. Traders may consider this a medium-term opportunity, with a solid technical foundation and clear upside targets.
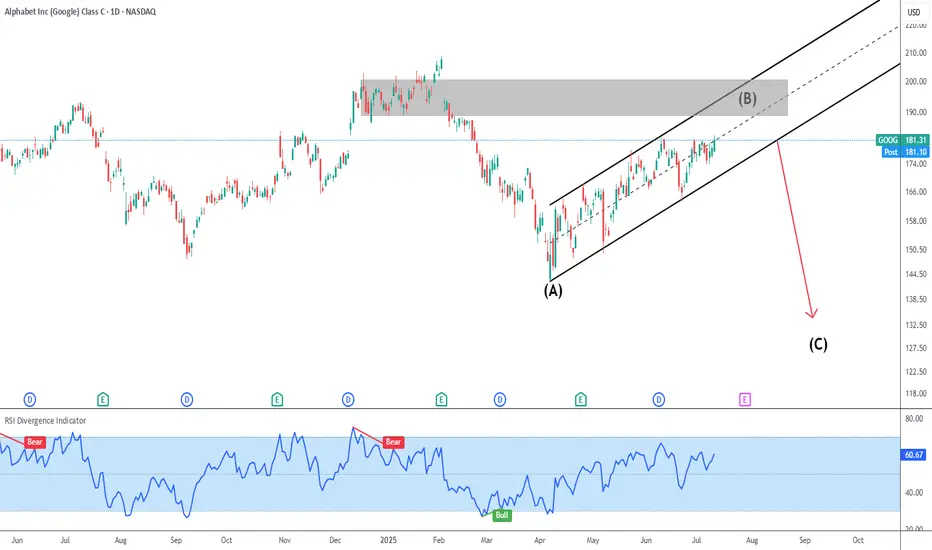
GOOG Wave B
Bullish price action from the last couple of months has been unconvincing, and this looks more like a wave B correction.
A break of the black ascending channel would be a trigger for wave C.
It would be interesting to see a reversal pattern in smaller timeframes if price touches the gray supply zone.
AMZN Ending DiagonalFrom an Elliott Wave point of view, we could be near a downside correction (wave C).
The rise from late May doesn´t have the same momentum, and looks like an ending diagonal.
A break from the bottom of the ascending wedge would indicate wave C is in progress

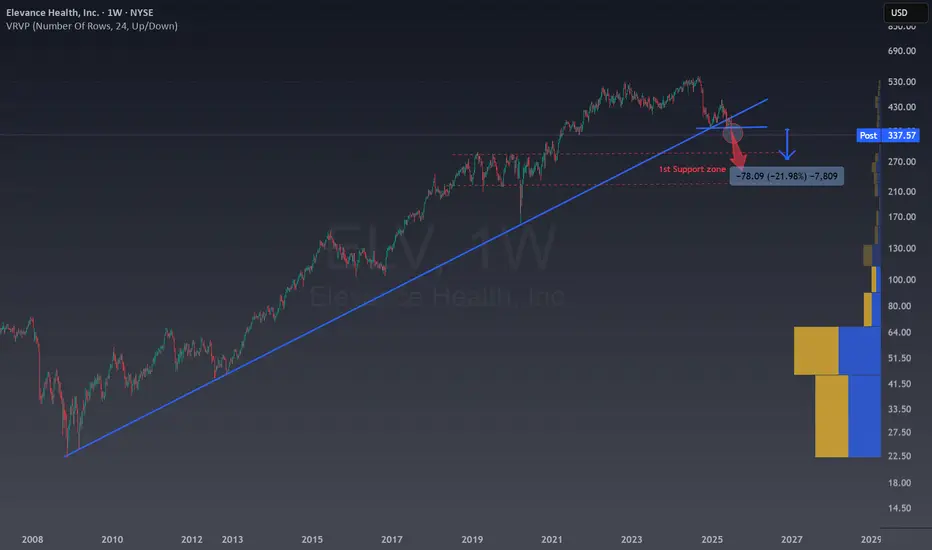
Elevance is losing the long term trendlineLosing such a large trendline is always a bad signal for a company.
The price can easily fall from 15 to 25% in the upcoming weeks or months, take care with this stock unless you are shorting.
This is especially significant while we are seeing Indexs, BTC and more doing new all time highs.
A SL in the -5% zone is enough to be protected from volatility.
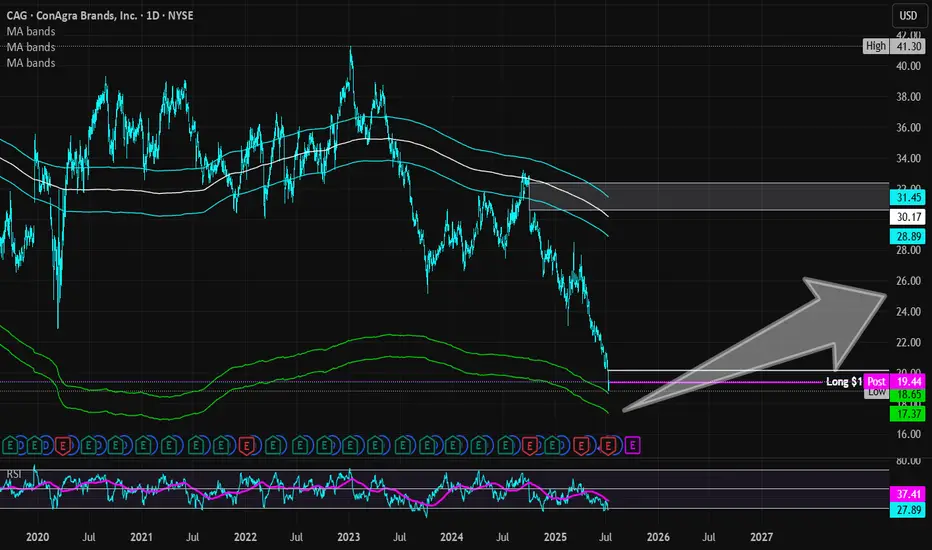
ConAgra Brands | CAG | Long at $19.38ConAgra Brands NYSE:CAG , maker of Marie Callender's, Healthy Choice, Birds Eye, Orville Redenbacher's, Slim Jim, and many more, has seen a continuous drop in share price since the rise of interest rates, inflation, and tariffs. The stock is currently trading near its book value of $18.71 and has a dividend yield of 6.9%. Debt-to-equity is reasonable (0.9x), but the company does have a Quick Ratio of 0.2x (short-term liquidity issues) and a Altman's Z Score (bankruptcy risk) of 1.7, which should ideally be 3+. Like almost every large-scale food company, earnings growth is relatively low, but 2025 is anticipated to be its worst performing year - which explains the price.
While the stock is not likely to generate triple-digit returns in the near-term, NYSE:CAG is a strong company with a nice dividend and some growth ahead. I foresee such stocks getting new life with drops interest rates. However, a dip near $17 (into my "crash" simple moving average area) or even slightly lower is possible - which may likely result in another stock entry.
Thus, at $19.38, NYSE:CAG is in a personal buy-zone with future entries planed near $17 or below.
Targets into 2028
$22.00 (+$13.5%)
$25.00 (+29.0%)
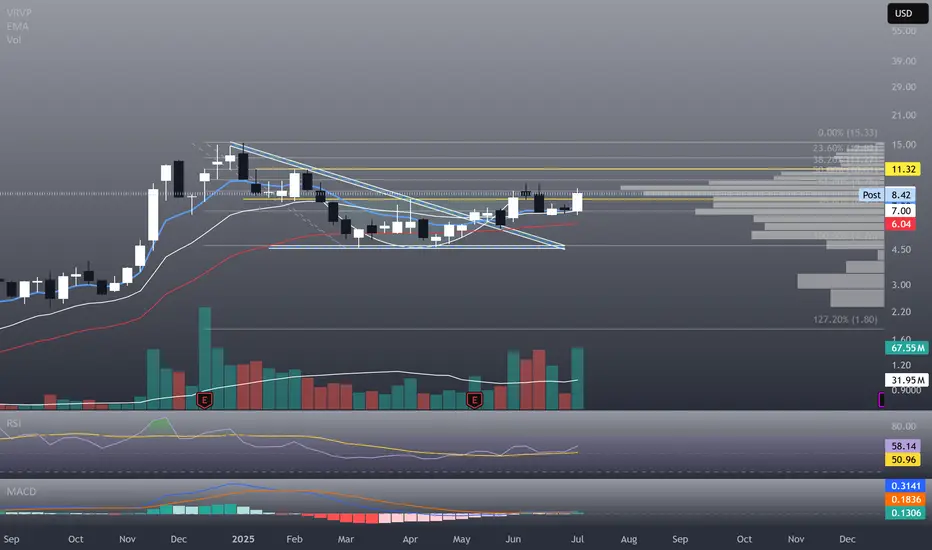
RCAT see you at 11The drone industry, particularly for military and government applications, is experiencing significant growth.
The Pentagon is fast-tracking drone production and deployment, which directly benefits companies like RCAT, ONDS etc
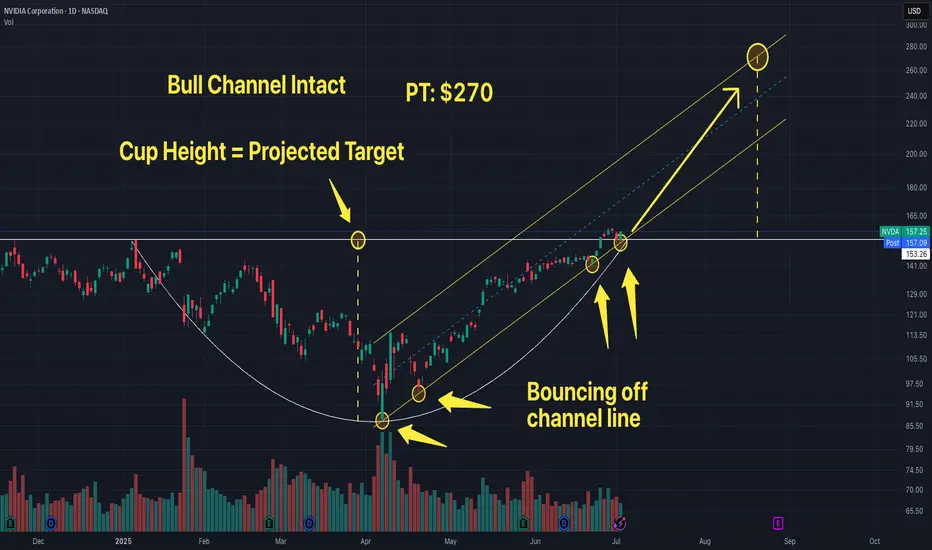
$NVDA - $270 PT in BULL ChannelThe stock is currently bouncing off of the lower channel line of the rising Bull Channel. Price action has created a Cup and Handle. The projected Price Objective sits at around $270. Remember, the height of the cup is the project target which from current stock price extends to around $270.
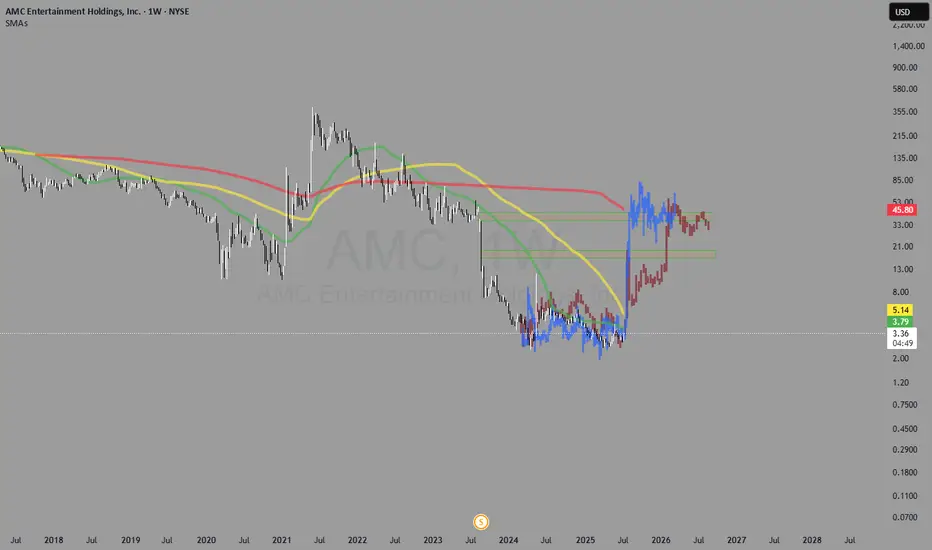
Call your mom. This stock has taught me how to trade. I found it. I bought it for the first time in 2021 and that's how my trading journey began.
Now in July of 2025, I think we might see movement we have been waiting for over the past years.
I remembered a documentary I watched over 15 years ago about a trader making unreal returns (1000s% per year) discussing his strategy. The key points I remember are the deviation from the SMAs. Stocks, that are laggers, kissing/sitting at/over moving averages, especially sitting right above the 100 day moving average for a prolonged period of time (just watch BX:GMES weekly on the 100 SMA;)) and how those stocks see INSANE amount of gains, when they move. I wish I remebered the exact documentary. I see it coming to life in these memes, it seems.
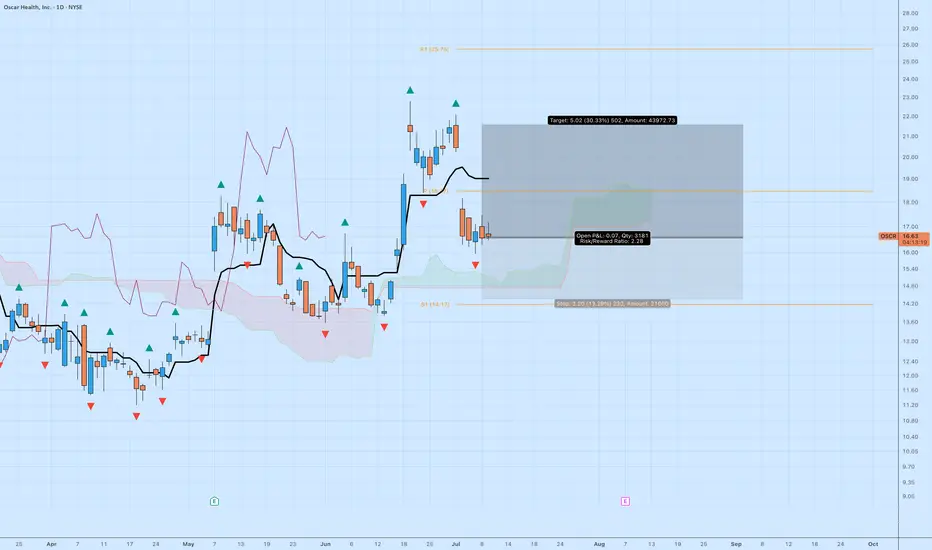
OSCR: Pullback Setup with 30% UpsideOscar Health NYSE:OSCR has pulled back into a logical area of support after a strong breakout in June. While the aggressive move may be over, this trade still offers solid upside with controlled risk.
🔍 Technical Breakdown
Price is basing above the cloud with a clean series of higher lows.
Ichimoku: Trend remains bullish, and price is holding the Kijun-sen.
MACD not shown, but momentum has stabilized after the initial thrust.
🎯 Trade Setup
Entry: ~$16.60
Target: $21.62 (+30.33%)
Stop: $14.40 (–13.29%)
Risk/Reward: 2.28 — attractive given current market conditions
This is a measured continuation setup — not aiming for the moon, just a reasonable trend extension.
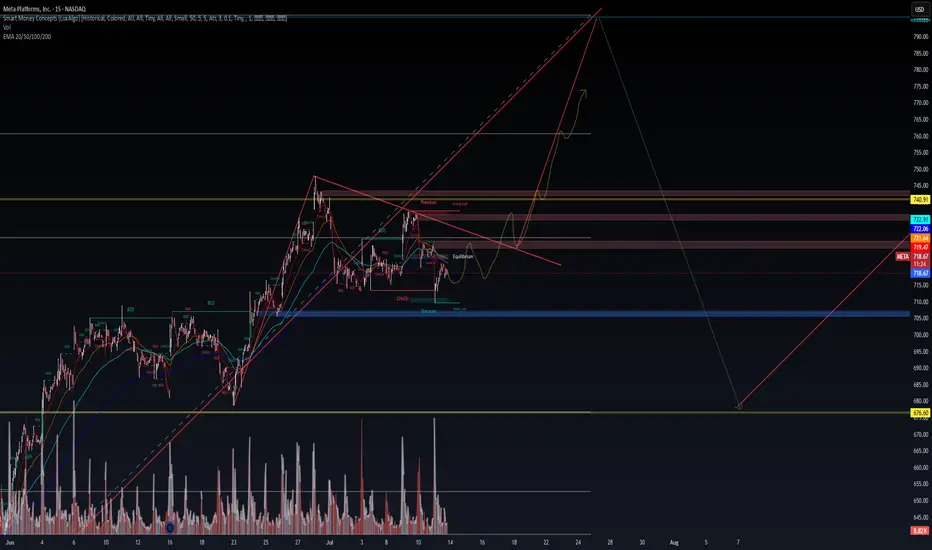
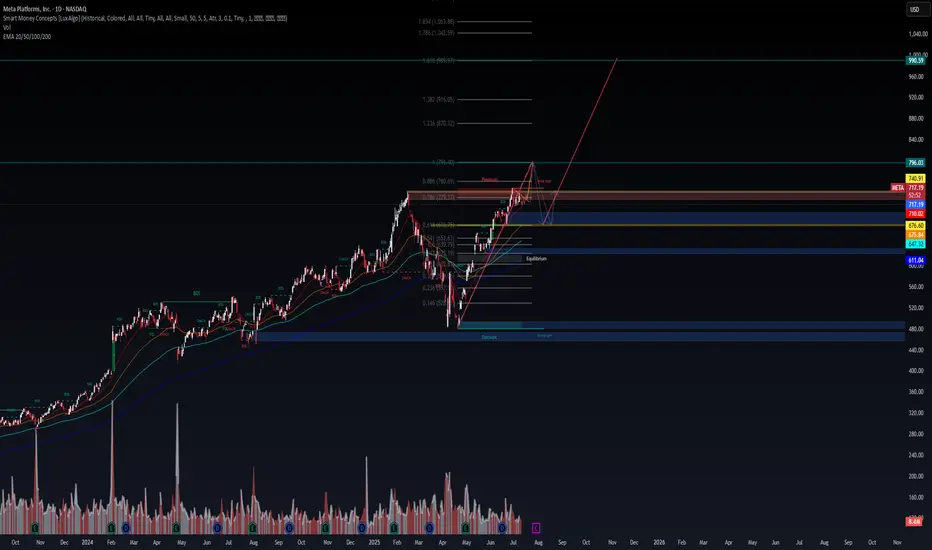
META (Meta Platforms Inc.) – Macro Compression Before Expansion META sits at a decisive macro juncture:
A clean SMC structure combined with Fibonacci premium zones signals an imminent directional expansion.
🧠 Macro Thesis:
Price is coiled just under 0.786–0.886 Premium Zone ($729–$760)
↳ This is a known trap area for retail liquidity – institutions often engineer sweeps here.
Volatility compression and volume tapering beneath the “weak high” setup
↳ Perfect conditions for either an engineered breakout raid or a sell-side liquidity hunt.
Fibonacci Expansion Zones:
🟢 Bull case: Clean path to $796 → $870 → $990
🔻 Bear case: Reversion into EQ → discount zones → $676 or $611
🗺️ Trade Structure:
🟢 Scenario A: Expansion Breakout
Entry: $729.50+ (break above weak high)
Target Range: $740.91 → $796 → $870 → $990
Stop: $710.04 (below EQ + EMA confluence)
🔻 Scenario B: Distribution Rejection
Entry: Break below $710
Target: $676 → $647 → $611
Stop: $729.50
📊 Institutional Alignment:
SMC shows liquidity-engineered structure with BOS + CHoCH confirmed
EMA 100/200 still rising → trend remains intact unless $675 fails
🧠 Positioning around EQ and premium zones is key. META is not in a “buy or sell” zone—it's in a smart money trap. Let price decide.
This is chess, not checkers.
📍 Posted by WaverVanir International LLC – Advanced Market Intelligence & AI Governance Engine
#Meta #META NASDAQ:META #SmartMoney #InstitutionalFlow #LiquidityZones #TradingPlan #FibStrategy #MarketCycle #SwingTrading #WaverVanirResearch #AITrading #VolanX #QuantStrategy #CapitalFlow #TradingView
META (Meta Platforms) – Battle at the Premium | WaverVanir Resea🚨 META is coiling at a critical inflection zone.
We're observing textbook Smart Money Concepts (SMC) behavior on both the daily and intraday timeframes:
🧠 Key Observations:
Price is hovering below the Premium Zone (0.786–0.886 Fibonacci: ~$729–$760) – a known liquidity trap.
15M structure shift shows a CHoCH (Change of Character) and BOS (Break of Structure), signaling possible upside.
Volume is tapering near a weak high – suggesting accumulation or engineered liquidity sweep.
⚔️ Scenarios in Play:
🟢 Bullish Breakout:
If META breaks and closes above $729.50 with strength and volume:
Long Trigger: $729.50+
Targets: $740.91 → $796 → $870+
Stop: Below $718 (EQ/EMA cluster)
🔴 Bearish Rejection:
If price rejects premium and breaks below $710:
Short Trigger: <$710
Targets: $676 → $647 → $611
Stop: Above $723
🎯 Strategic Outlook:
META is trapped between buy-side and sell-side liquidity. We’re watching for either a bullish expansion above weak highs or a reversion into discount toward deeper demand zones.
Volume and macro catalysts (e.g., earnings, tech sector rotation) will decide the direction.
📍 Posted by WaverVanir International LLC – Institutional Market Intelligence Engine
#Meta NASDAQ:META #OptionsFlow #SmartMoneyConcepts #TradingStrategy #VolumeProfile #Fibonacci #LiquidityZones #WaverVanirResearch #VolanX #TechStocks #MarketOutlook #InstitutionalTrading #LongOrShort #TradingView #SwingTrade #BreakoutSetup