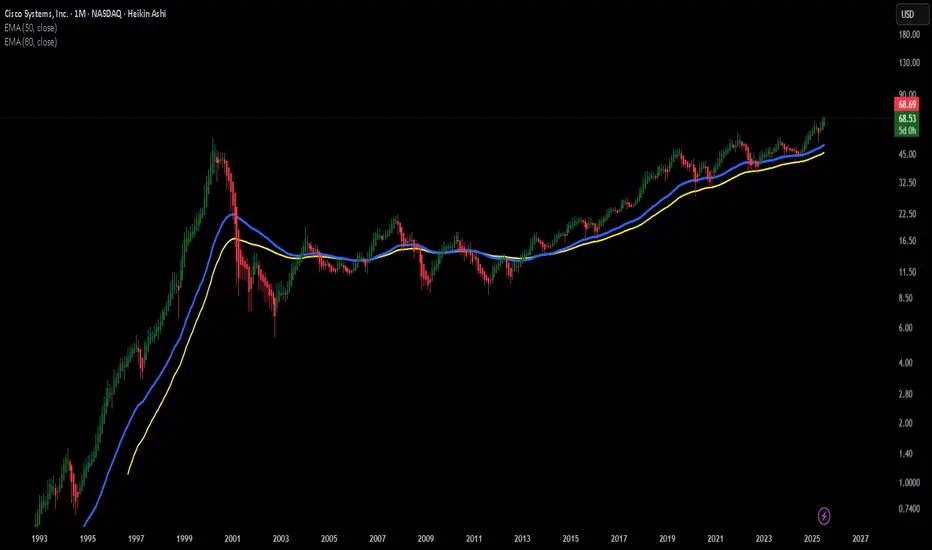
CSCO – Cisco’s Not Done Dancing Yet!
When I look at CSCO, I get the feeling that this old-school tech legend still has some rhythm left in its step. It’s like that uncle at the family wedding who’s been around the block but somehow still manages to pull off a surprisingly smooth move on the dance floor.
It may not be the flashiest stock on the NASDAQ, but there’s something about the way it moves – slow, steady, confident – that makes me think it might just be preparing for another swing to the upside.
From a chart perspective:
Recently, CSCO has been respecting a rising trendline and forming a sequence of higher lows – a classic sign of underlying strength. The price is now approaching a zone that has previously acted as resistance. If momentum builds, this level could turn into a launchpad. Of course, the market doesn’t always follow the script, but the setup looks promising from where I stand.
No predictions, no guarantees – just one trader’s interpretation of the chart. If Cisco keeps moving like this, I’ll be following the rhythm with curiosity (and maybe a fresh cup of coffee).
A lighthearted market musing, not financial advice!
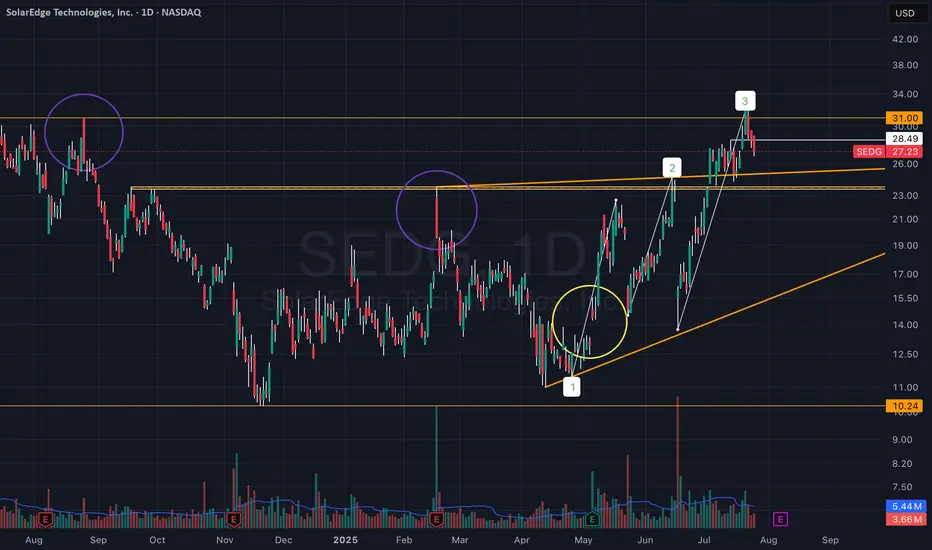
Are We Witnessing a Trend Reversal in SEDG?Something I’ve been watching closely these past few days — SEDG (SolarEdge):
There’s a setup unfolding that I think could benefit from a few more eyes on it:
• The two purple circles mark large vector candles that initiated sharp downward moves.
• The yellow circle highlights the quarterly earnings release, which triggered a strong upward move toward the $20–24 zone — the area of the first vector candle.
These vector candles reflect strong institutional activity that clearly impacted price movement.
A breakout above these zones could signal a meaningful trend reversal forming in the stock.
Price was rejected twice from this area with strong dips, but on the third attempt, it broke through, reaching the next vector candle zone around $26–31.
Now, price is approaching this upper zone with strong momentum following the breakout.
After reviewing the recent earnings report, I noticed a clear recovery and a significant upward revision in guidance, suggesting the company may be shifting direction.
Whether this holds is uncertain — but price action suggests the market is pricing in real change.
We recently printed a high of $32.45, above the $31 vector zone — a notable sign of strength.
At the moment, we appear to be pulling back into support, and structure remains intact.
Yes, there’s clearly a strong battle happening now — but I’m convinced the momentum is with the bulls.
It feels like someone already knows what’s coming in the next earnings release, or at least senses a shift in the company’s trajectory.
Everything seems to be building toward the next earnings report, expected early August.
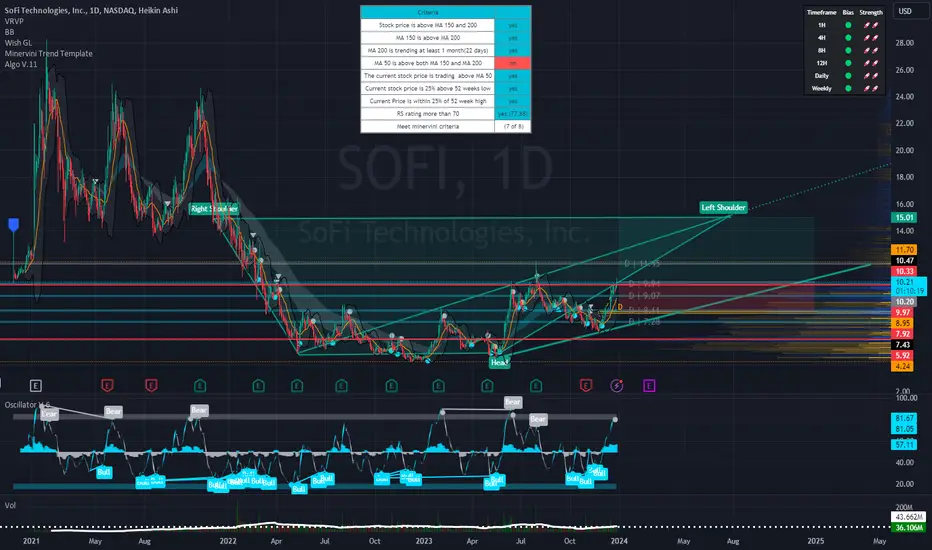
SoFi's Surge: Unveiling 2023 and What Lies Ahead in 2024Technical Analysis Overview
Current Price : $10.34, a 3.77% increase.
Weekly Trend : Showing a positive trend with a 5.35% increase over the last five days.
1-Month Trend : A significant increase of 51.96%, indicating strong bullish sentiment.
6-Month and Yearly Trends : A 17.04% increase over the last six months and a 124.51% increase year to date, highlighting a robust bullish trend.
Advanced Technical Indicators
Relative Strength Index (RSI) : 70.41 - Indicating that SOFI is nearing overbought territory, which could lead to a potential reversal or consolidation in the short term.
Moving Average Convergence Divergence (MACD) : 0.63 - Suggesting bullish momentum, indicating a strong buying trend.
Other Indicators : STOCH (83.28), STOCHRSI (84.02), ADX (37.09), Williams %R (-8.57), CCI (104.63), ATR (0.46), Ultimate Oscillator (54.76), and ROC (24.66) all contribute to a picture of current bullish momentum but with potential for short-term volatility or pullback.
Market Sentiment and External Factors
Market Capitalization : $9.904B USD.
Trading Volume Analysis : A high trading volume of 35,199,288, suggesting active market participation and interest in the stock.
Recent News Coverage Impacting SOFI
Bullish Outlook for 2024 : Analysts predict SOFI stock could continue its rally in the new year, benefiting from expected interest-rate cuts. A notable analyst has set a high price target of $14 for SOFI stock, implying significant upside potential ( InvestorPlace ).
Focus on Non-Lending Businesses : Analysts appreciate SoFi's shift towards non-lending businesses, improving earnings quality despite a higher-for-longer interest-rate policy.
Central Bank Policy Changes : Potential interest rate cuts in 2024 could benefit SoFi's lending business, as lower rates tend to spur borrowing and lending activity.
Conclusion
SOFI's stock shows strong bullish signs in the medium to long term, but the current overbought condition warrants caution for short-term traders.
The recent news and analyst predictions provide a positive outlook for 2024, making SOFI an interesting stock for both traders and long-term investors.
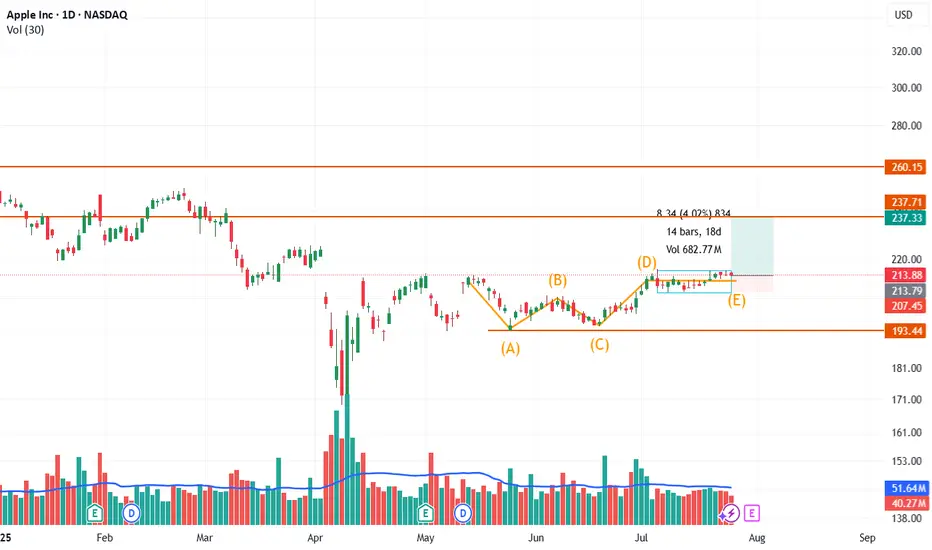
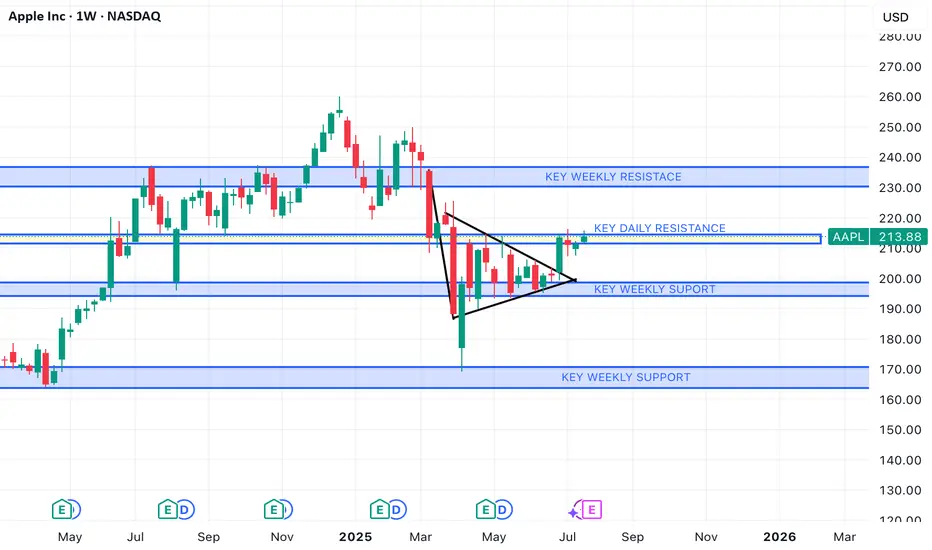
Apple Inc. (NASDAQ: AAPL) – Potential Breakout from Bullish ABCDApple has recently formed a well-structured ABCDE corrective pattern inside a broader sideways range, suggesting accumulation and possible trend continuation on breakout.
Technical Breakdown:
🔸 ABCDE Formation: The structure resembles a contracting triangle or bullish consolidation, marked by higher lows (A, C, E) and lower highs (B, D), signaling price compression.
🔼 Breakout Zone: Price has moved above point (D) briefly and is now consolidating around the $214 zone. A strong close above this could lead to continuation toward the $237 and $260 resistance levels.
🔻 Support Levels:
Minor support at $207.45
Strong base support near $193.44 (ABC low)
📈 Volume Spike: The most recent leg from E to D showed a significant volume surge, indicating possible institutional interest or breakout anticipation.
🔍 Trade Outlook:
A sustained move above $217–$218 with volume could trigger a bullish breakout.
Targets:
First: $237.33 (recent horizontal resistance)
Next: $260.15 (gap-fill or prior high zone)
Risk Management: A drop below $207 would invalidate the structure and suggest further range-bound behavior or downside.
⚠️ Disclaimer: This chart is for educational purposes only. We are sharing a trade setup based on technical signals generated by our private invite-only indicator. This is not financial advice or a recommendation to buy or sell any financial instrument.
📊 The indicator highlights potential buy/sell zones based on a custom strategy developed by our team. In this chart, we are demonstrating how the signal aligned with market structure and trend conditions.
🛑 Regulatory Note: We are an independent development team. Our private indicator and services are not registered or licensed by any regulatory body in India, the U.S., the U.K., or any global financial authority. Please consult a licensed advisor before making trading decisions.
AVGO: Too Many Similarities Market WideLike my chart on BKNG, AVGO is showing an uncanny similarity to Booking.com's chart. Many indices are showing the end of 5 waves in a super cycle dating back to the drop of March 2020. AVGO pt1 is 211. Expecting selling to increase over the next 90 days. Not certain what the catalyst will be, but looking for a major drop in equities over the next 2 weeks. Check IBM chart. I called that drop last week and many stocks will have a similar gap down structure over the next 2 weeks from what I am tracking.
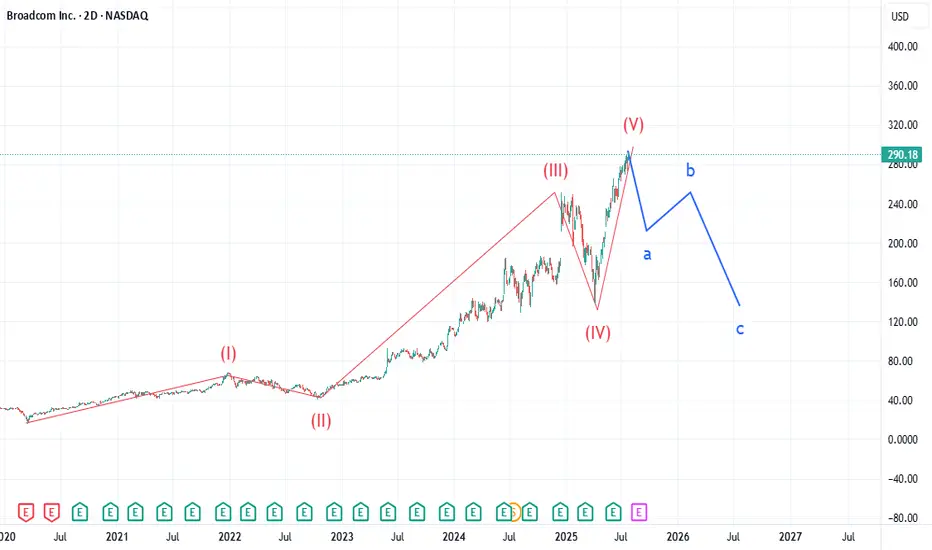
BKNG: Catalyst for the drop - EarningsBKNG has completed a super cycle 5 wave structure beginning at the completion of the March 2020 COVID drop. First target is 4030 by EOY to early next year. Many other stocks are showing a similar structure, so expecting selling volume to greatly increase over the next 90 days.

$CORZ LoadedTime Frame: 1D
RSI : Bullish
MACD: Bearish, looking for momentum
Fib Levels: Retraced back to 50.0%
Target: $16.28
Pattern invalidated of drop below 61.8% ($10.94) Fib level.

#LCID - 4HR [ A potential bullish view]Lucid blasted off last week with the collaboration of Uber and Robo-taxis. I think that blast infused more investors to the stock and I think it may never come back to take out its lows. If it does, I would load up more on it. I like their designs and the fact that they are now compatible with TESLA's Super Chargers make them even more attractive.
In my count here, I am sensing the current correction could form a triangular pattern for another high before one last correction for ABC down.
Go LCID, Go!!!
Check out my other chart ideas @CaxhPrince everywhere.

A 4HR Bullish view on #Lucid Motors ($LCID)Lucid blasted off last week with the collaboration of Uber and Robo-taxis. I think that blast infused more investors to the stock and I think it may never come back to take out its lows. If it does, I would load up more on it. I like their designs and the fact that they are now compatible with TESLA's Super Chargers make them even more attractive.
In my count here, I am sensing the current correction could form a triangular pattern for another high before one last correction for ABC down.
Go LCID, Go!!!
Check out my other chart ideas @CaxhPrince everywhere.

My thoughts on LCID-4HRLucid blasted off last week with the collaboration of Uber and Robo-taxis. I think that blast infused more investors to the stock and I think it may never come back to take out its lows. If it does, I would load up more on it. I like their designs and the fact that they are now compatible with TESLA's Super Chargers make them even more attractive.
In my count here, I am sensing the current correction could form a triangular pattern for another high before one last correction for ABC down.
Go LCID, Go!!!
Check out my other chart ideas @CaxhPrince everywhere.

$TEM – Breakout Imminent After Accumulation? NASDAQ:TEM – Breakout Imminent After Accumulation? 📈
Tempus ( NASDAQ:TEM ) is flashing strong bullish signals backed by smart money and confirmed option flow.
🔹 Technical Picture (1H)
Trendline just broken to the upside
Clean break of structure (BOS) after sweep of June/July lows
Volume spike + EMA realignment confirms momentum shift
Targeting the $66–$70 equilibrium zone short-term
High timeframe liquidity sits above $74 — a magnet if momentum continues
🔹 Options Flow (July 23 @ 6:54 AM)
$56K call sweep for Aug 1 $66C (To Open)
Smart money positioning for a rapid move higher — not retail-driven
🔹 VolanX Bias: Bullish
Long trigger confirmed on trendline break and BOS
Risk: < $59.50
PT1: $66
PT2: $70
PT3: $74+ (if volume sustains)
This is now on VolanX watchlist as a potential stealth breakout fueled by institutional flow.
⚠️ For educational purposes. Not financial advice. VolanX Protocol active.
#TEM #Breakout #OptionsFlow #SmartMoney #VolanX #TradingView

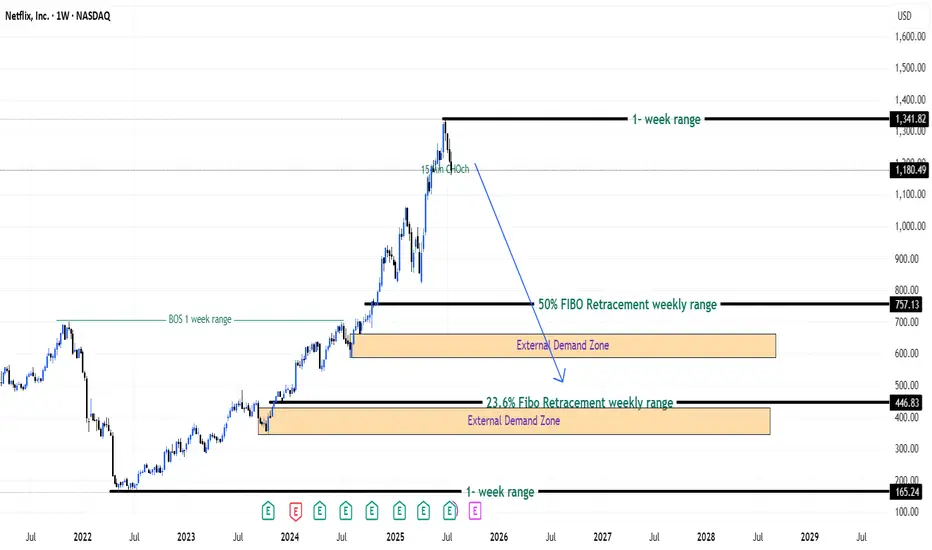
Bulls Quit? Bears Ready! - Netflix Stock (USA) - {27/07/2025}Educational Analysis says that Netflix (USA Stock) may give trend Trading opportunities from this range, according to my technical analysis.
Broker - NA
So, my analysis is based on a top-down approach from weekly to trend range to internal trend range.
So my analysis comprises of two structures: 1) Break of structure on weekly range and 2) Trading Range to fill the remaining fair value gap
Let's see what this Stock brings to the table for us in the future.
DISCLAIMER:-
This is not an entry signal. THIS IS FOR EDUCATIONAL PURPOSES ONLY.
I HAVE NO CONCERNS WITH YOUR PROFITS OR LOSS,
Happy Trading,
Stocks & Commodities TradeAnalysis.
My Analysis is:-
Short term trend may be go to the external demand zone.
Long term trend breaks the new high after going from discount zone.
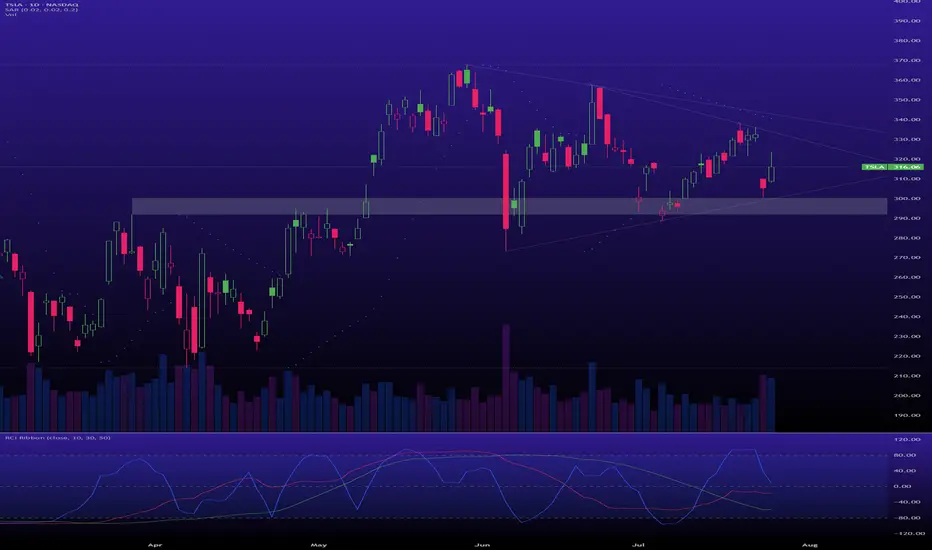
$TSLA is in an accumulation phase.A classic Wyckoff scenario is playing out, offering a prime opportunity if you have the nerve for it.
Support: The key support zone is $300 - $305. As long as this holds, the bullish thesis is intact.
Resistance: The primary target is the top of the multi-month accumulation range, around $370 - $380. A breakout above this would signal the start of a major new markup phase.
AMZN HEADING INTO AUG 25'SHORT AMAZON
Amazon is current going to retest all time highs.
I want amazon again for a buy in the $209-218 range.
I don't think see Amazon below $208 again.
Going to fail on retest of ATH right now and cool off, bring rsi down back to 50-60 Zone, before consolidating for a break of the all time highs to close out the year.
Amazon always shines in Q4 with Holidays, so expect a great close to the year, but it's an overbought stock right now. (isn't it always??...lol)

AAPL HEADING INTO AUG 25'AAPL TOPPED @ 250-260 TO CLOSE OUT 24
BAD Q1
Consistent since then.
Consolidation happened @ key weekly support $194-198 range, solid move up after.
Long Apple currently.
They have the IPHONE 17 releasing in Sept with a few new colors and new back design as well as other affordable options to assist with consumer retention, entry and re entry into the apple hemisphere for consumers.
Earnings July 31st, currently expected to increase YOY for Q3.
I expect earnings to come in strong to assist with the move up to try and work back to retest ATH again.
Long back up to $247 range to close out 2025 for Apple. End of year Q3, Q4 is always their time to shine. Don't think we see a break of ATH in 2025 for Apple though. Retest, to come back down slightly again before major break.
TEM – Bullish Continuation to $74+ | Institutional Catalyst fromTEM – Bullish Setup Targeting $74+ | Strong Institutional Backing
VolanX DSS, WaverVanir AI, and SMC confluence confirm a STRONG BUY signal for TEM, with a 15–20% upside potential over the next 30 days.
Key Highlights
AI Forecast:
Current Price: $64.49
30-Day Target: $74.56 (+15.6%)
Model Confidence: Strong Buy
Technical Confluence:
Price has reclaimed equilibrium and is holding above EMA 20/50/100.
Fib levels and channel support point to an upside breakout towards $74–75.
Breakout of $66.3 (0.618 fib) would confirm bullish continuation.
Institutional Catalysts:
Recent Russell 3000E inclusion and increased institutional ownership.
Strong partnerships (AstraZeneca, Pathos AI) and expanding AI-driven healthcare initiatives.
Upgraded 2025 financial outlook.
Trade Plan
Entry: $64.50 (current levels)
Stop Loss: $56.96 (below EMA 100)
Target 1: $65.78 (partial)
Target 2: $74.56 (full)
Risk/Reward: 1.34:1
VolanX Protocol Insight:
Both the AI forecast and technical structure suggest continuation of the bullish channel. A clean breakout above $66.3 opens the door to $74+, with a potential extension towards $80.

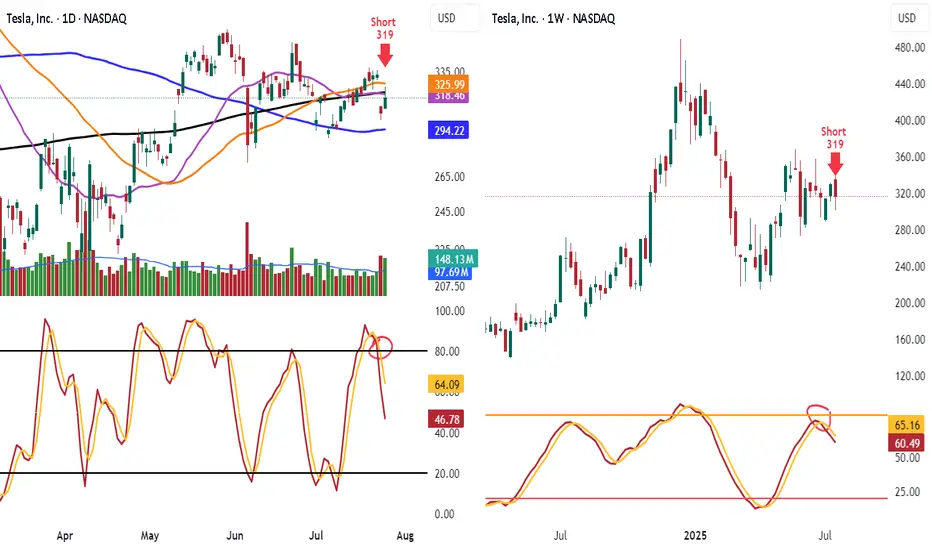
Shorted TSLA 319 Look at TSLA hit 50 day and 200 day MA and failed and know under them
Look at the lower highs and see the stoch heading down
Know lets look weekly stoch heading down and lower highs
Target is 100 day ma 294.22 take some off. When it breaks will add back on
Have trailing stop in place
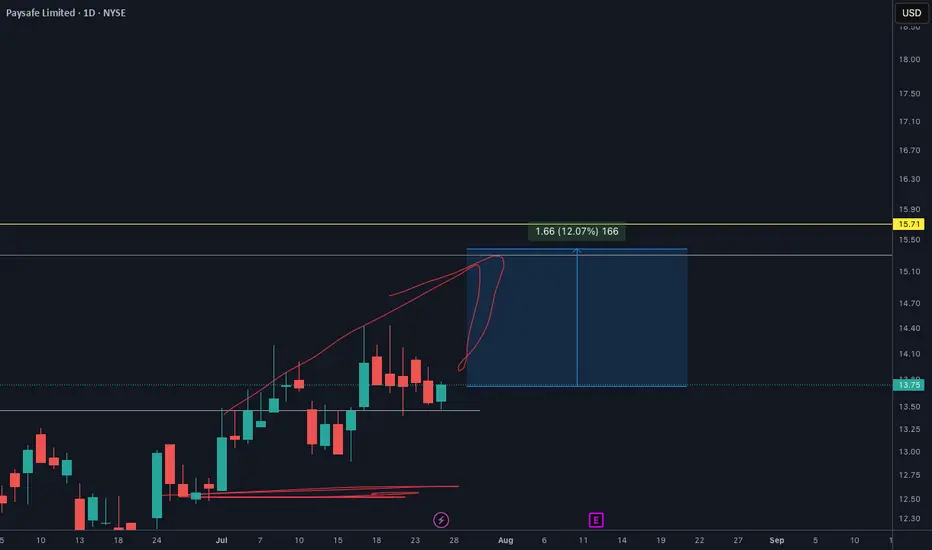
PSFE will EXPLODE soon. Make sure you check out my analysisPSFE price target is definetly $15.30. And It will happen so soon I see.
I shared this one on my youtube channel and X as well. You make sure go to my profile and follow for more.
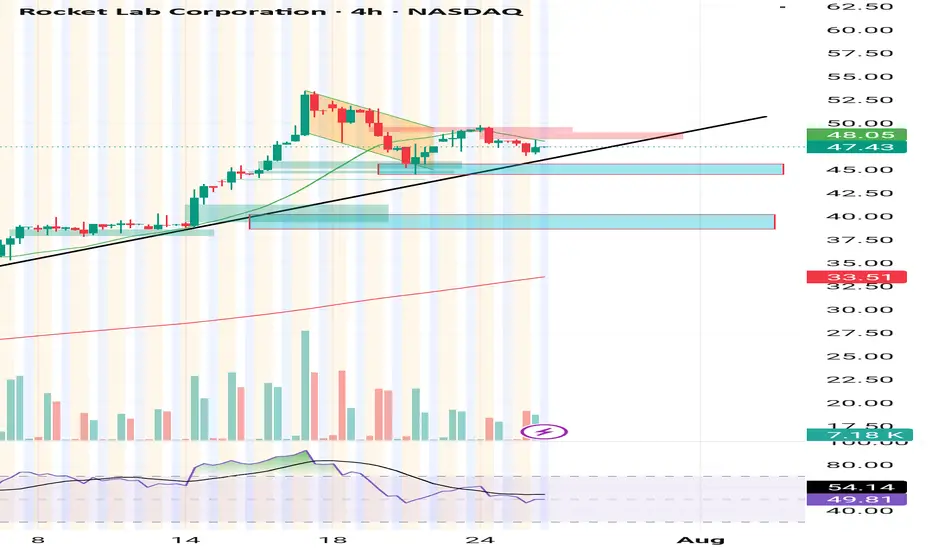
Possible upside continuation?If the Rsi curls off the center line and as price has maintained the $5.80 could we get a bounce or squeeze into next week?

Looking for a long setupLooking at the 4hr trend line for a starter, if it breaks looking to the next block for an add.
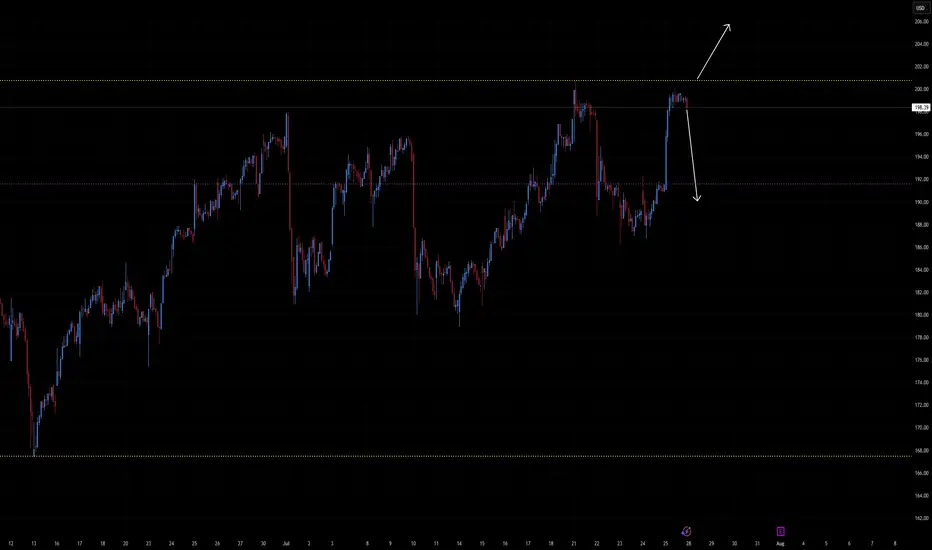
Will this stock ""NET"" you a nice return?📰 Cloudflare (NET) — Technical Overview & Breakout Strategy
Ticker: NET | Sector: Cybersecurity / Edge Computing
Date: July 26, 2025
Current Price: ~$198
⚠️ Context: Past Red‑Candle Sell-Offs
NET has experienced sharp downward reversals often signaled by large bearish engulfing candles, especially during pullbacks from the $200–$205 range.
These sell-offs typically occurred with elevated volume, triggering destruction of short-term support and dragging price toward $185–$190, followed by consolidation and eventual bounce.
Those breakdowns often led to retests of the $190 support zone, with range bottoming and short-covering rallying price back toward $200+.
🧰 Current Technical Set-Up
Price is consolidating just below its 52-week high near $200.8, forming a tight range between $190 support and $200 resistance.
Moving averages:
50-day MA ~$193, 200-day MA ~$188 — all indicating bullish trend alignment.
Investing.com
Technical ratings classify NET as a Strong Buy on both daily and weekly timeframes.
🔍 Support & Resistance Levels
Support Zones:
Primary: $190–$192 (recent consolidation base)
Secondary: $185 (recovery low after last drop)
Resistance Zones:
Immediate: $200–$202 — near all-time highs
Major Breakout Target: Above $205–$207 opens upside extension
✅ Bullish Breakout Scenario
Trigger: Clear close above $202, especially with strong volume
Targets:
Short-term: $210 → $215
Extended: $220+ if breakout sustains and earnings beat arrives
Supportive Thesis: Rising demand for cyber‑security, expanding AI tools (e.g. pay-per-crawl, bot protection), and expansion into media and content creator segments. Cloudflare maintains strong institutional accumulation metrics.
❌ Bearish Breakdown Scenario
Trigger: Fall below $190–$192 zone
Targets:
First: $185
If momentum continues: $180 → $175
Risk Drivers: Overbought pullback after extended run-up, profit-taking, or broader tech selloff. Large red candles in the past preceded rapid downward moves.
📊 Summary Table
Outlook Trigger Level Target Zones Technical Notes
Short-Term Bull Above $202 $210 → $215 Breakout from high consolidation zone
Short-Term Bear Below $190 $185 → $180 Overbought exhaustion, volume decline
Long-Term Bull Sustained > $205 $220 → $230 Continued AI/protection tailwinds
Long-Term Bear Clear break under $190 $180 → $175 Broad rotation, failed breakout
🧠 Viewpoint Summary
Cloudflare is currently consolidating just below all-time highs after a strong year-to-date rally. The stock remains technically strong, but recently stretched indicators suggest potential for near-term pullbacks. A breakout above $202+ could unlock further upside, while a drop below $190 might trigger a retest toward lower support zones.
Given Cloudflare’s expanded role in AI infrastructure and cybersecurity, its trend remains attractive—but price action will be key to confirm direction.
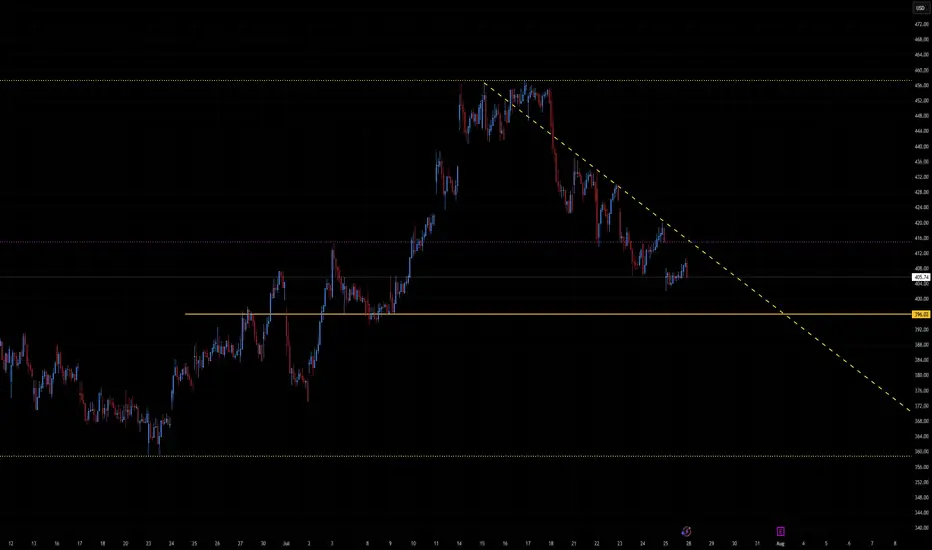
MSTR - Where it goes only BTC knows📊 MSTR – MicroStrategy Technical & Bitcoin Correlation
Ticker: MSTR | Sector: Bitcoin Treasury Proxy / Enterprise Software
Date: July 26, 2025
Current MSTR Price: ~$405.89
Current Bitcoin Price: ~$118,127
🔍 Chart & Price Structure
Recent Action: MSTR declined from the ~$430–450 range and has consolidated around the $405 level, forming a tight base.
Support Zone: $395–$400 — prior volume cluster, recent dip buyers stepped in.
Weak Resistance: $415–$420 — a shallow supply zone; bigger resistance lies at ~$430.
Volume & Candles: Mixed volume, with small-bodied candles showing indecision near $405. Buyers are attempting to hold.
📈 Bitcoin Outlook & Influence
MicroStrategy remains tethered to Bitcoin’s trajectory. Recent BTC consolidation around $118K closely influences MSTR sentiment.
BTC Projections
From Citi (Jul 25):
Base Case: $135K by year-end
Bull Case: $199K
Bear Case: $64K if equities falter or ETF flows wane
Other Views:
Hashdex sees BTC reaching up to $140K in 2025
Omni Ekonomi
Global X ETF-based models anticipate $200K within 12 months
The Australian
Kiyosaki warns of potential crash despite optimism
These imply a possible 25–70% upside in BTC, which could drive MSTR toward $500–$600+ if holdings are stable.
⏱️ Short-Term Outlook (1–2 Weeks)
✅ Bullish Scenario
Trigger: Hold above support at $400, reclaim $415–$420
Immediate Upside Targets:
First: $430
Break above $430 → $450
Drivers: Bitcoin breaking back above recent highs, ETF inflows, favorable regulatory headlines
❌ Bearish Scenario
Trigger: Break below $395
Downside Targets:
$380 → $360 → $350
Drivers: BTC weakness → below $110K, altcoin rotation, broader equity weakness
🔭 Long-Term Outlook (H2 2025 / beyond)
🚀 Bull Case
If Bitcoin reaches $135K–$200K (Citi bull case, institutional demand, ETF momentum), MSTR could rally alongside to $550–$650.
MicroStrategy’s business fundamentals (data analytics/AI) may contribute optionality beyond BTC.
🐻 Bear Case
If Bitcoin retraces toward $64K or below due to risk-off sentiment or regulatory changes, MSTR could fall back toward $300–$350.
📊 Summary Table
View Trigger Level Targets Bitcoin Scenario Confidence
Short-Term Bull Above $405 and reclaim $415–420 $430 → $450 BTC > $118K and flat-to-up Moderate
Short-Term Bear Below $395 $380 → $360 → $350 BTC dips < $115K Moderate
Long-Term Bull BTC to $135K–$200K $550 → $600+ ETF inflows + adoption acceleration High (if BTC strength)
Long-Term Bear BTC drops below $110K $350 → $300 Sentiment collapse or regulation Moderate
🧠 Conclusion
MicroStrategy’s stock remains inherently tethered to Bitcoin performance. The $395–$405 zone acts as critical support, while a push above $415–$430 could signal renewed upside. Longer-term, BTC strength into the $135K–200K range would propel MSTR toward $600+ levels; a BTC pullback could drag it toward $300 or lower.
Watch Bitcoin flows, ETF updates, and pillar crypto adoption trends—these are likely to dictate MSTR’s next leg.
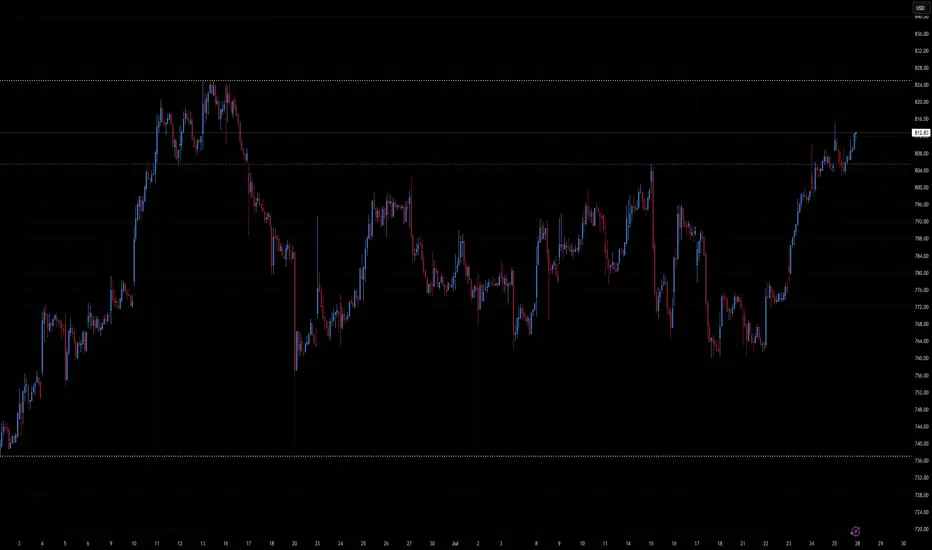
LLY - Earnings upcoming, recent news makes this appealing📈 LLY — Eli Lilly & Co.
Ticker: LLY | Sector: Biotech / Pharmaceuticals
Date: July 26, 2025
Current Price: ~$813
Resistance Zone: $825
Support Zone: $740–$750
🧪 Recent Drug News
1. EMA Backs Alzheimer’s Drug Donanemab (Kisunla)
The European Medicines Agency’s advisory committee has issued a positive opinion on donanemab for early Alzheimer's patients with confirmed amyloid pathology and fewer ApoE4 gene copies. This reverses a previous rejection and paves the way for a likely EU approval in the coming months. Data from TRAILBLAZER‑ALZ trials showed slower cognitive decline and improved safety with a modified dosing regimen, while Europe’s Alzheimer’s patient population is projected to nearly double by 2050.
2. Orforglipron Shows Promising Phase 3 Results
Lilly’s investigational oral GLP‑1 therapy, orforglipron, achieved clinically significant results in Phase 3: A1C reductions of 1.3%–1.6% across doses, weight loss averaging 7.9% at the highest dose, and efficacy seen as early as four weeks. The safety profile was consistent with injectable GLP‑1 drugs, offering a powerful oral option for type 2 diabetes management.
⚡ Analyst & Market Recap (Past Week)
HSBC issued a double downgrade, lowering its rating to "Reduce" and cutting its price target from $1,150 to $700, citing valuation concerns and competitive pressure in the weight-loss space.
Erste Group downgraded LLY from “Buy” to “Hold,” slowing expectations around drug pipeline momentum.
Despite this, other analysts maintain a positive outlook, with the average 12-month price target in the $1,012–$1,016 range, spanning a wide band from $700 to $1,190.
Investor sentiment is shifting cautiously due to rising competition and high multiples.
🔍 Technical & Market Structure
Based on the latest 30-minute chart:
Price remains stuck within a sideways trading range, bounded by a resistance level near $825 and support in the $740–$750 area.
Momentum is building but hasn’t broken through significant technical thresholds yet.
✅ Bullish Scenario
Trigger: Break and hold above $825
Targets: $850 → $900 → $950
Catalysts: Oral GLP‑1 approval prospects, Alzheimers regulatory momentum, and possible drug trial successes
❌ Bearish Scenario
Trigger: Breakdown below $740
Targets: $700 → $670
Risks Include: Rising competition from Novo Nordisk, slowing pipeline news, valuation compression, and analyst downgrades
🧠 Strategic Summary
LLY is operating in a tight technical corridor, with the potential for volatility driven by both clinical and regulatory catalysts. The recent drug developments—donanemab's EMA advancement and orforglipron's strong Phase 3 results—may supply fuel for a bullish breakout if momentum shifts convincingly above $825. Conversely, bearish pressure may intensify if the downside at $740 breaks.
Key levels to watch: breakout above $825 or failure below $740.