New targets for Reddit RDDT In this video I recap the previous reddit analysis where we looked for the long which is playing out really well .
I also look at the current price action and simulate what I think could be a target for the stock moving forward using Fib expansion tools as well as levels below for price to draw back too.
Welcome any questions below the chart . Thanks for viewing

WXY structure with a double topTesla has been in a uptrend with a corrective structure WXY. I am not sure if the WXY is a part of wave 5 terminal structure or a B wave. However expecting a double top or 78.6 retrace to 425-430 range as a minimum. For this scenario, an impulsive upside move is expected within the next few weeks. However the price needs to move back into the channel next week as a first step.

CIRCLE Stablecoin Revolution Circle is more than a crypto firm—it’s building infrastructure for a regulated digital dollar economy. With transparent reserves, global licenses, deep financial integrations, and robust blockchain functionality, USDC is rapidly positioning itself as a cornerstone of future finance.
I see a longer term potential for a great investment opportunity given the coming banking revolution involving stable coins.
For a lower risk entry, after a nearly 40% decrease in less than a week, the stock price is currently supported at the VWAP from the original IPO release.
Should the trend continue higher, I would prefer to see a bounce here on the stock.

TSLA LONGQuite a simple set up. Confirmation is still needed on 3d, and daily. Bullish candles and volume is desperately needed for validation of symmetrical setup.
Volatility incoming. Break of ATH with strength leads to price discovery into $500+.

Target Calls $100 CallsTGT Technical Breakdown — August 1st
Target (TGT) remains within a well-defined ascending channel that began forming around April 9th, showing a consistent pattern of higher highs and higher lows. Today, price action has touched the lower trendline support of this channel near $99.50, which also coincides with a key psychological level.
While this area has historically attracted buyers, yesterday’s post-earnings reaction, which saw the stock fall several points, raises major concern about potential bearish sentiment in the short term. This makes the next move crucial.
Trade Plan & Critical Levels
🔎 Entry Trigger: I’m not entering yet. My entry will only be considered at $100.55, and even then, only if the price breaks this level with conviction — specifically, I want to see a strong bullish "power candle" to validate buyer momentum.
🛑 Stop Loss: $97.50 — just below the current trendline and a key invalidation point for this bullish structure.
📈 Targets Upon Confirmation:
$103.63
$105.00
$107.00
$108.73
Summary
The structure is still bullish, but yesterday’s earnings-driven drop introduces caution. $100.41–$100.55 remains the "must-break" zone. If bulls can clear this level with strength, momentum could carry the stock to the above targets. Otherwise, failure to hold the $99.50 support could see a breakdown toward the $97.50 area or lower.

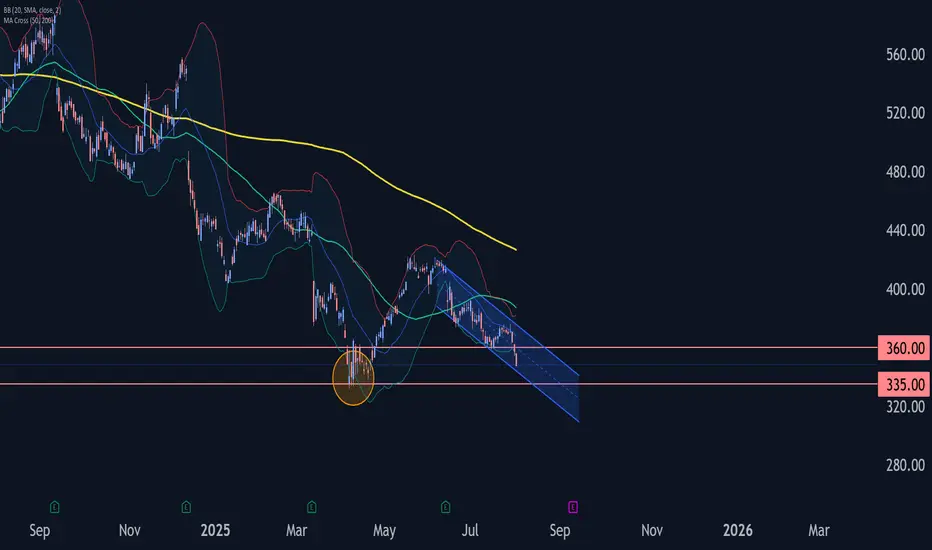
Adobe Wave Analysis – 1 August 2025- Adobe broke the key support level 360.00
- Likely to fall to support level 335.00
Adobe recently broke below the key support level 360.00 (which stopped the previous minor impulse wave i at the start of July).
The breakout of the support level 360.00 accelerated the active impulse wave C of the medium-term ABC correction (2) from the end of May.
Given the strong daily downtrend, Adobe can be expected to fall further to the next support level at 335.00 (the double bottom from April and the target for the completion of the active impulse wave C).
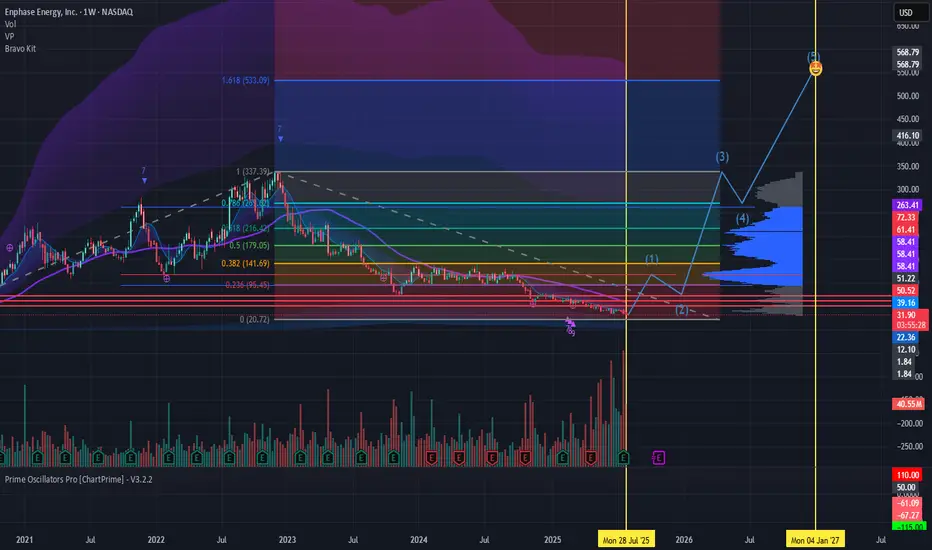
$ENPH About to make new highs Enphase trades inverse crypto and the crypto trade is coming to a quick end. Stored energy theory states during times of excess energy BTC will thrive. We are now in a new regime of AI energy cost and ENPHASE has the best batteries to scale. Minimum Target $550
Positions
1130 ENPH $50 Calls for 10/17/2025
511 ENPH $100 Calls for 01/15/2027
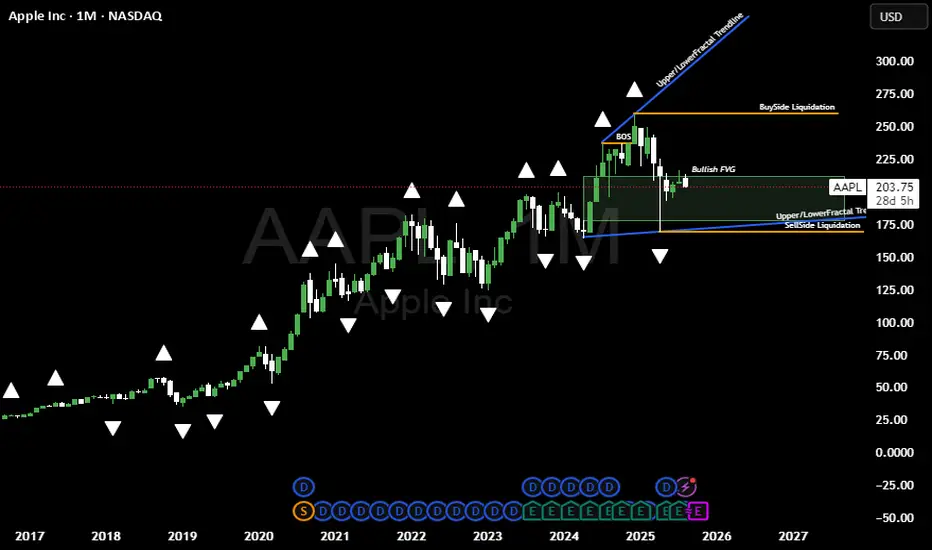
Bullish Idea on APPLNASDAQ:AAPL / Lovley day its been a while, am planing to share my views on the markets atleast once a week from now going forward. Basically on this bias idea above here @LutthMage we are leaning more on long term holding, WITH AN ADVANTAGE OF TAKING SHORT TERM TRADES BASED ON OUR LONG TERM INVESTMENT IDEA WE ARE SURE YOU WILL UNDERSTAND AS TIME GOES BY.
NOW LET THE GAMES BEGIN```
On the chart above we a basically bullish due to 4 reasons
1. The trend is our friend its currently bullish, because AAPL is BREAKING STRUCTURE NO VISIBLE Change of character as of yet
2. We got a widening channel currenly bouncing of the lower level line of the channel.
3. Price is playing around a Bullish FVG
4. APPLE JUST CREATED SELL SIDE LIQUIDITY.
We will keep you posted on the short term trades we execute based on this bullish bias on APPL, ofcourse only if they do appear for now we sit and do the hardest thing to do wich is NOTHING.
AS TIME GOES BY YOU WILL CHARACTERIZE A WASH RINSE AND REPEAT PROCESS FROM US @LutthMage NASDAQ:AAPL
RIOT: Looks pretty bad, but still has a chance to recoverBreaking down into the big bad channel maybe was the first warning of a false breakout. August first price action just made things a whole lot worse. The hope here is that RSI is tanked and has multiple pints of bullish divergence. But the bad news is, the overall price action is still a very 3 waves structure. If price falls into wave 1 territory, then it is pretty much game over. It could be a leading diagonal, or it could be another x wave to bring the price back down to the bottom of the channel yet again. BTC is also trying to maintain must keep support level. So, if next week we see a sharp recovery, then the 5 waves structure may still be intact. However, if price breaks down below $10, then best to stay out of it until things settle down. I took some profit at the top of the channel and got stopped out for most of my position for now. I will hold the rest with a stop at $9.5. If price recovers, then will ride the final wave towards $18.

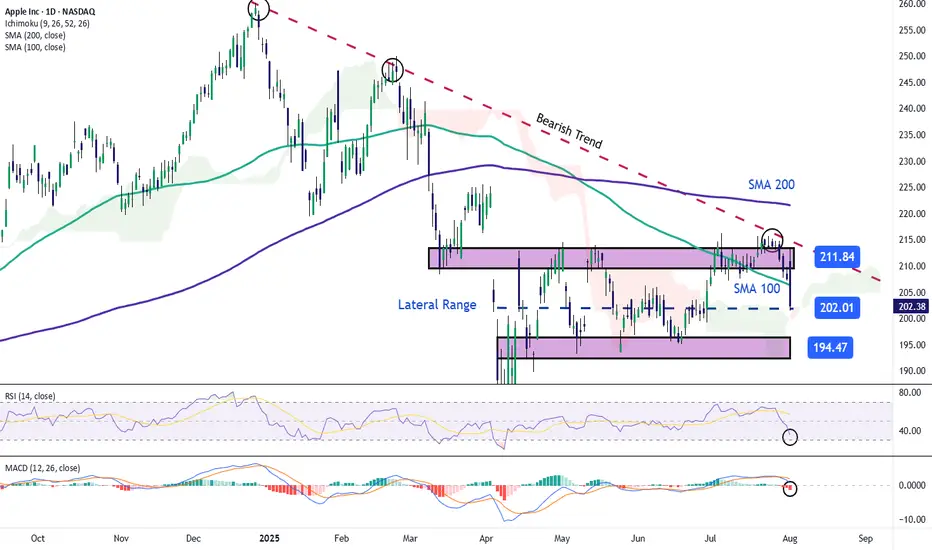
Apple Stock Falls Despite Strong EarningsApple stock is down more than 4% in the final session of the week, following the company’s earnings release yesterday. Apple reported earnings per share of $1.57, beating expectations of $1.43, while total revenue reached $94.04 billion, surpassing the $89.53 billion forecasted by the market.
However, despite the strong results, the stock is once again facing a notable short-term bearish bias as investor concerns grow. The primary issue is the perception that Apple is falling behind in the race for artificial intelligence, especially compared to its main competitors. In addition, shortly after the earnings announcement, it was noted that the company may face challenges in sustaining growth throughout the remainder of 2025, which has fueled additional downward pressure on the stock.
Sideways Range Emerges
In recent weeks, Apple’s price action has consolidated within a clear lateral range, with resistance around $211 and support near $194. So far, price fluctuations have not been strong enough to break this structure, and the latest bearish candlestick has reinforced the validity of the channel. For now, this sideways range remains the most relevant technical formation to watch in the upcoming sessions.
Technical Indicators
RSI:
The RSI line is falling rapidly and is now approaching the oversold zone at the 30 level. If the indicator reaches that threshold, it could suggest a technical imbalance, opening the door to a short-term bullish correction.
MACD:
The MACD histogram has moved into negative territory in recent sessions, suggesting a clear dominance of bearish momentum in the moving average structure. If this persists, selling pressure may continue to build in the near term.
Key Levels to Watch:
$211 – Main Resistance: Upper boundary of the current range. A breakout above this level could trigger a stronger bullish trend.
$200 – Psychological Support: Round number zone, a breakdown here could activate an immediate bearish bias for the next sessions.
$194 – Key Support: Corresponds to recent weekly lows. A move below this level would likely confirm a more extended bearish trend.
Written by Julian Pineda, CFA – Market Analyst
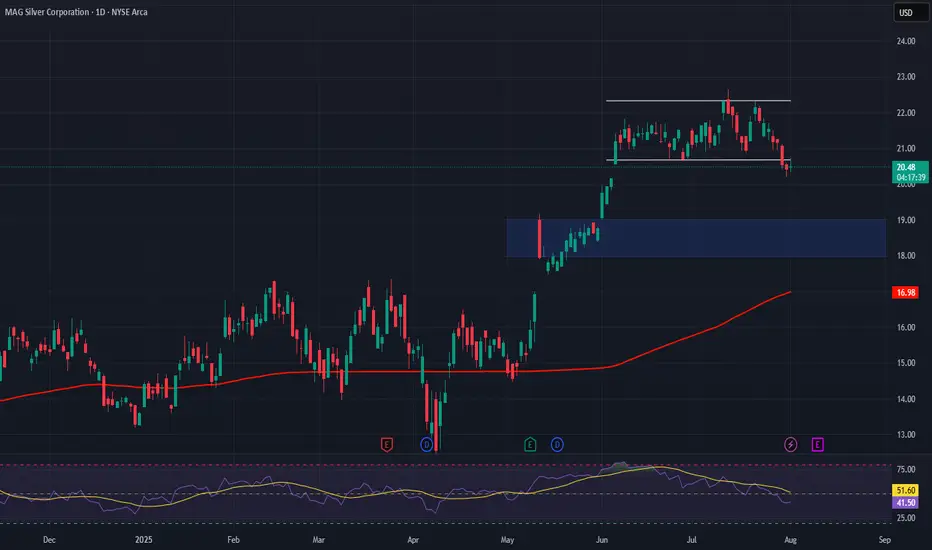
MAG Silver – A Pure-Play Winner in the Precious Metals RallyCompany Snapshot:
AMEX:MAG Silver is uniquely positioned as a high-beta play on silver and gold, with nearly all revenue tied to precious metals exposure—making it a standout in the current macro-driven metals bull run.
Key Catalysts:
High Leverage to Silver 🌐
With almost all income derived from silver and gold sales, MAG offers direct upside as investors flock to safe-haven assets amid inflation, rate uncertainty, and geopolitical risk.
Juanicipio Growth Engine ⛏️
Operated by top-tier partner Fresnillo, the Juanicipio project continues to scale efficiently, tapping into new high-grade zones that will further boost output and margins.
Financial Strength 💰
A debt-light balance sheet and healthy cash reserves give MAG financial flexibility, minimizing dilution risk and providing insulation during volatile market cycles.
Investment Outlook:
Bullish Entry Zone: Above $18.00–$19.00
Upside Target: $28.00–$29.00, driven by silver tailwinds, project scalability, and financial discipline.
🥇 MAG Silver stands out as a low-risk, high-reward name for investors seeking direct exposure to silver’s breakout.
#SilverStocks #Gold #MAGSilver #SafeHaven #PreciousMetals #Juanicipio #Fresnillo #CommodityRally #HardAssets #MiningStocks #InflationHedge #Geopolitics #MetalBulls
AMZN - LONG Swing Entry PlanNASDAQ:AMZN - LONG Swing Entry Plan
Entry Zone 1: $220.00 – $217.00
→ Open initial position targeting +8% from entry level.
Entry Zone 2: $212.00 – $209.00
→ If price dips further, average down with a second equal-sized entry.
→ New target becomes +8% from the average of Entry 1 and Entry 2.
Edit Zone : $192.00 – $190.00
→ If reached, enter with double the initial size to lower the overall cost basis.
→ Profit target remains +8% from the new average across all three entries.
Risk Management:
Stop Loss:
Risk is capped at 12% below the average entry price (calculated across all executed positions including the Edit Zone).
Position Sizing Approach:
Entry 1: 1x
Entry 2: 1x
Edit Zone: 2x
→ Total exposure: 4x
→ Weighted average determines final TP and SL calculations.
______________________________________
Legal Disclaimer
The information provided in this content is intended for educational and informational purposes only and does not constitute financial, investment, or legal advice or recommendations of any kind. The provider of this content assumes no legal or financial responsibility for any investment decisions made based on this information. Users are strongly advised to conduct their own due diligence and consult with licensed financial advisors before making any financial or investment decisions.
Sharia Compliance Disclaimer: The provider makes no guarantees that the stocks or financial instruments mentioned herein comply with Islamic (Sharia) principles. It is the user’s responsibility to verify Sharia compliance, and consultation with a qualified Sharia advisor is strongly recommended before making any investment decisions

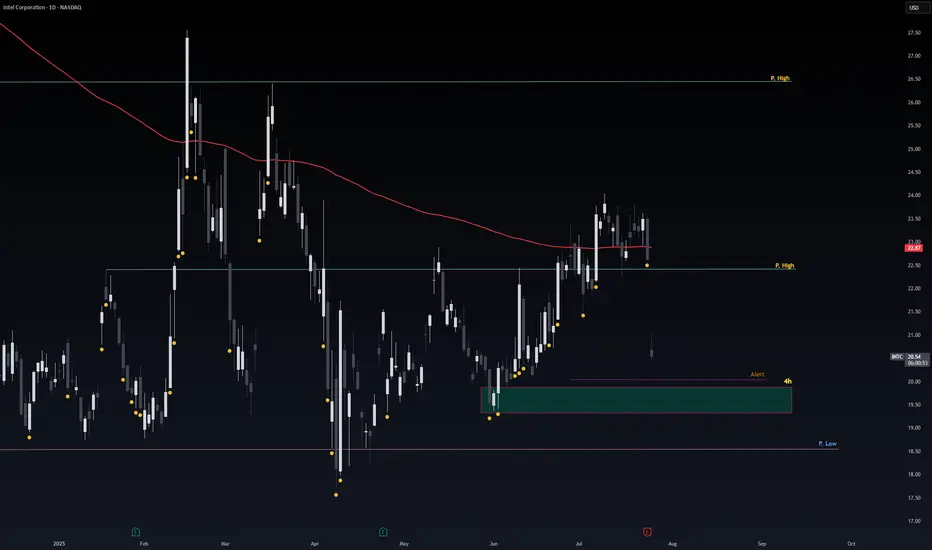
Safe Entry IntelThe 4h Green Zone is Safe & Strong Support for Intel.
If not respected the Pink Line is Second Strong support level.
Note: 1- Potentional of Strong Buying Zone:
We have two scenarios must happen at The Mentioned Zone:
Scenarios One: strong buying volume with reversal Candle.
Scenarios Two: Fake Break-Out of The Buying Zone.
Both indicate buyers stepping in strongly. NEVER Join in unless one showed up.
2- How to Buy Stock (safe way):
On 1H TF when Marubozu/Doji Candle show up which indicate strong buyers stepping-in.
Buy on 0.5 Fibo Level of the Marubozu/Doji Candle, because price will always and always re-test the
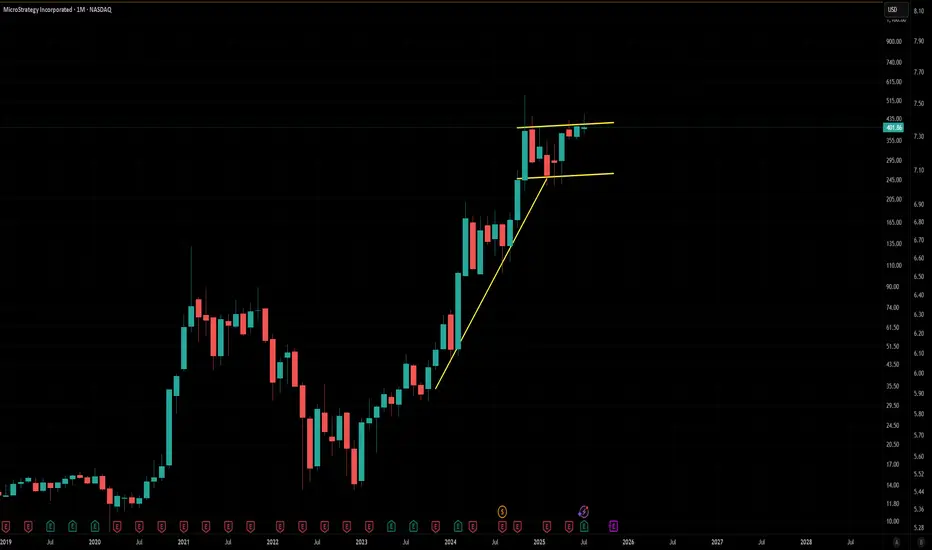
Monthly $MSTR Bullflag MicroStrategy is forming a textbook bull flag on the monthly, right after a massive vertical leg from sub-$200 to over $500.
Strong pole ✅
Tight consolidation near the highs ✅
Monthly closes holding above prior resistance ✅
This thing is coiling under ~$455. Once it breaks, it could easily send toward $800–1000+, especially if CRYPTOCAP:BTC keeps surging. BTC already confirmed a major cup & handle — MSTR just lagging a bit.
High timeframe structure + BTC correlation = explosive potential.
Watching for volume + breakout confirmation. Let’s see if it rips.
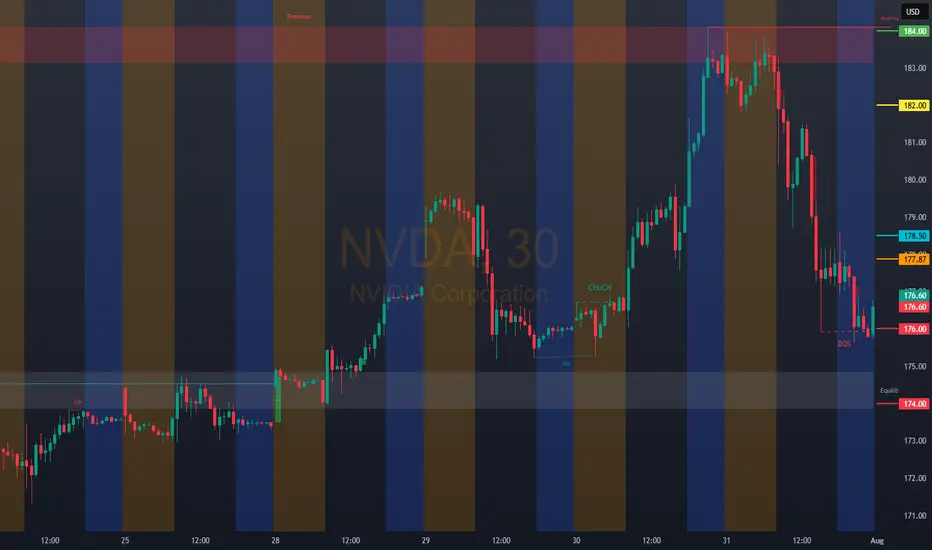
NVDA: 177.87Bullish Entries: 174.00/178.50 Stop 177.00 Target 182.00–184.00
Bearish Entries: 178.50/176.00 Stop 177.00 Target 172.00................Note if you find it somewhat confusing, here is the clarification 178.50 possible bullish reach zone wait for confirmation. 174.00 possible rebound zone or rejection of the bearish entry wait for confirmation for the bearish entry.
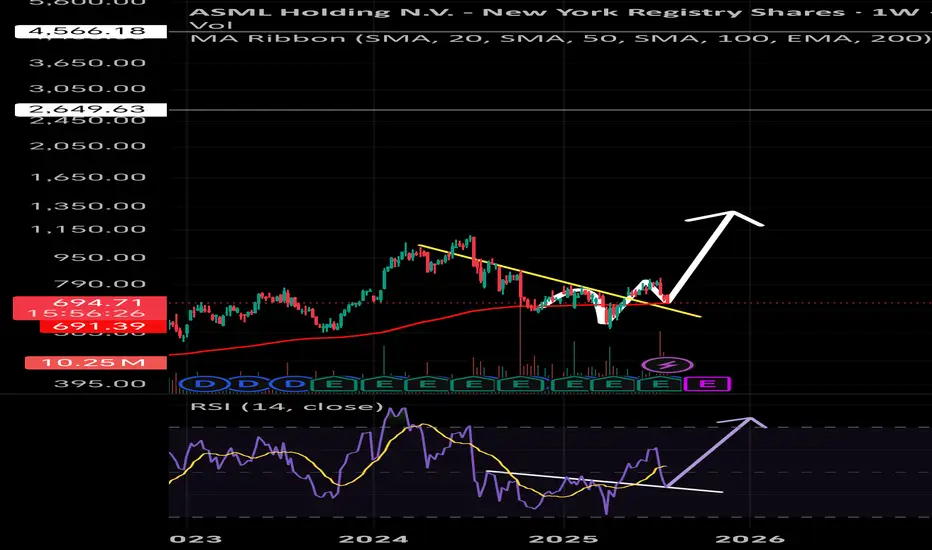
ASML : All inASML currently retesting the 200 weekly EMA support trendline.
Expecting ,Bullish trend reversal structure,
Ladt night already positioned heavily in this stock,
Pray this will play out as planned
😬🙏🙏😬
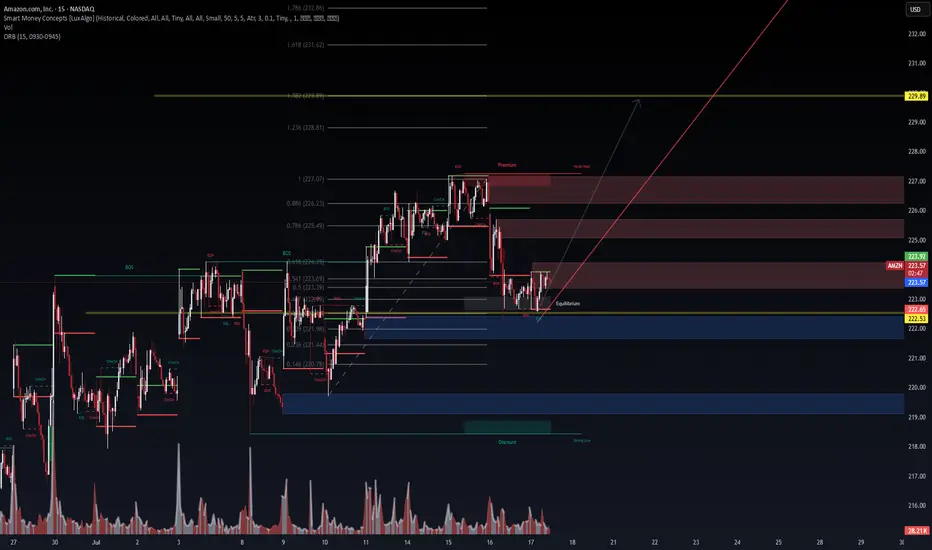
AMZN 15m – Institutional Demand Reclaim in Progress | VolanX Pro📈 AMZN 15m – Institutional Demand Reclaim in Progress | VolanX Protocol Alert
Amazon (AMZN) is staging a potential bullish reversal from a deep discount zone following a strong rejection near the 0.146–0.236 Fibonacci confluence at ~$220.78–221.44. We are now consolidating near the equilibrium zone (223) with signs of early accumulation.
📊 Technical Thesis:
Break of Structure (BOS) at 223.92 sets short-term bullish intent.
Reclaiming the ORB high and equilibrium.
Price rejected from deep demand (blue zone) and now printing EQH + BOS microstructures.
Premium liquidity sits above 227–229, with a magnet at FIB extension 1.618–1.786 = 231.62–232.86.
Volume profile shows declining sell pressure post-demand sweep.
📌 Key Levels:
Support: 222.53 | 221.44 | 220.78 (deep value zone)
Resistance: 226.23 (0.886 FIB) → 229.89 (FIB target zone)
Smart Money Premium: 226.5–229.8
🧠 VolanX Protocol Bias:
This is a long-biased setup, favoring institutional reaccumulation. If AMZN maintains above 223 with volume absorption, we anticipate a liquidity sweep through the premium zone, targeting 229.89.
🎯 Probabilistic Targeting:
60% → Retest 226.23 (EQH magnet zone)
30% → Breakout and reach 229.89 (measured move)
10% → Breakdown below 222.53 invalidates the setup
⚠️ Risk Note (VolanX Standard):
This post reflects strategic technical modeling, not financial advice. Trade your own system. View this as a signal integrity alignment, not a directive.
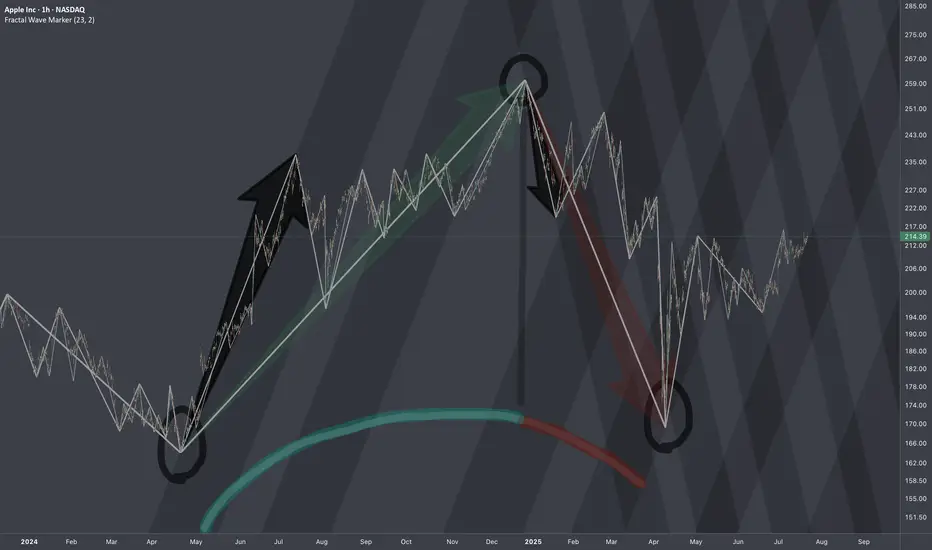
$AAPL: Structure SurgeryResearch Notes
Original Structure:
Altering structure for experimental purposes
Angle of fib channels that rises from cycle low, has been pushed into the past to the top of first major reaction. blue area resembles the change
Reason
The the angle of Fibonacci channels which cover the general decline (from perspective of ATH to end of cycle), are adjusted to the angle of the first bear wave of smaller scale.
Therefore, when it comes to measurements of opposing forces for working out interference pattern, having this symmetric approach of mapping interconnections is fair.
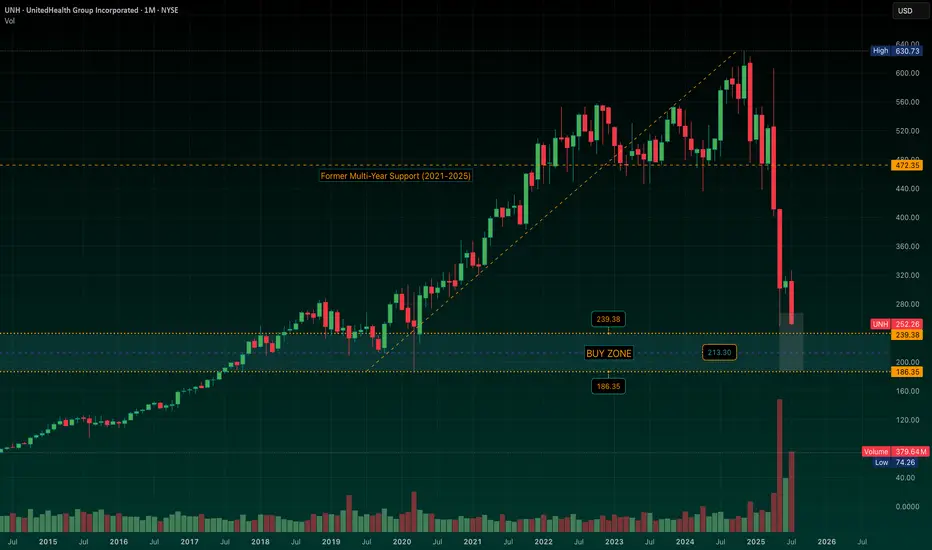
UNH: Mapping Out a Defined-Risk LEAPS Strategy in the "Buy Zone"UNH is approaching a broad structural support region I’ve been tracking -- a wide zone from $239 down to $186, where (for me) the stock begins to offer compelling risk/reward and long-term value. Momentum, IMO, is still decisively lower, but we’re nearing levels where I start preparing.
The midpoint of the “Buy Zone” near $213 reflects a potential average cost area I’d be very comfortable building from, depending on how price behaves as it enters the zone.
I’ll look to initiate exposure through long-dated call options (LEAPS) -- as I’ve started doing in NYSE:CNC -- once the setup begins to stabilize. From there, I’ll begin layering in short puts at ownership levels that align with the broader structure. If assigned, I’ll own where I intended. If not, I’m collecting premium to help finance the LEAPS.
I’m not in the business of calling exact bottoms… this is about building a position that respects time, structure, and flexibility -- anticipating a slow grind higher over the next 12–18 months. Stay tuned.
$90 in next 6-12 months?I am buying this dip and expected it to hit 90 in 6-12 months based on tech analysis. All the best. Not a financial advise.

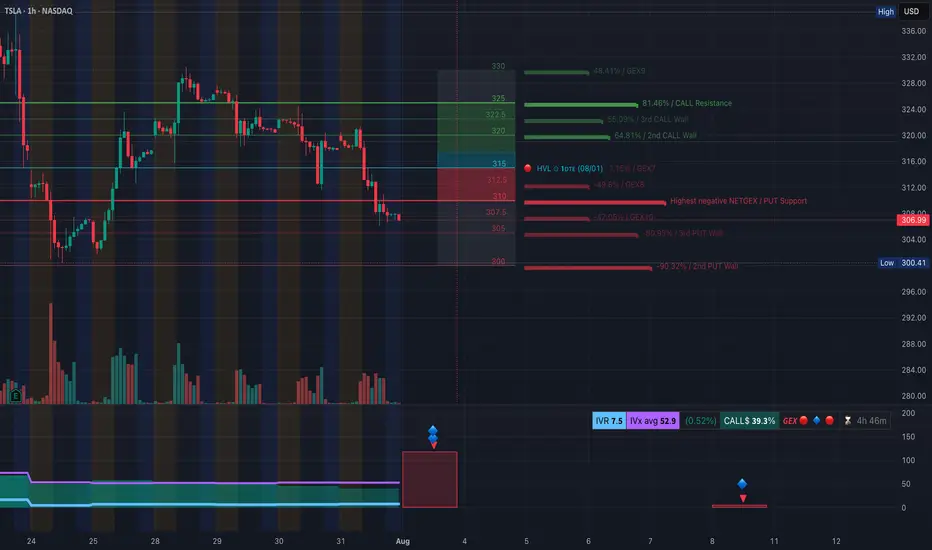
TSLA Downtrend Deepens — Key Gamma Floor at $300.41. August 1TSLA Downtrend Deepens — Key Gamma Floor at $300.41 Now in Sight
🔍 GEX & Options Flow Insight (1st Image Analysis)
TSLA continues to grind lower, breaking multiple gamma supports and staying pinned near the $306–$307 zone. The GEX profile shows a clear negative gamma environment, which means dealer hedging flows can intensify moves in either direction — but right now, momentum remains firmly bearish.
* Call Walls & Resistance:
* 📍 $321.36 → 2nd Call Wall (64.81% GEX2)
* 📍 $325.00 → Call wall resistance
* 📍 $330–$332 → Higher gamma resistance, unlikely in current structure without a strong reversal
* Put Walls & Support Zones:
* 🛡️ $306.99 → Current price zone, already tested multiple times
* 🚨 $300.41 → Highest negative NET GEX / hard gamma floor
* 📉 Below $300 → Opens quick downside to $295–$292
* Volatility Insight:
* IVR 7.5, IVx Avg 52.9 → Low relative IV in the context of a trending move down
* Call flow 39.3% → Bearish tilt despite modest call activity
* GEX sentiment: 🔴🔴🔴 = Strong negative gamma → price more sensitive to continued downside flows
✅ Option Trading Suggestion:
Bias: Bearish until a firm reclaim of $311–$315
Strategy: Bear put spread
* Entry Idea: Buy 305P / Sell 295P (Aug 2 or Aug 9 expiry)
* Invalidation: Strong hourly close above $315
* Target: $300 → $295
Why this works: Negative gamma positioning increases the likelihood of a push to $300. If $300 breaks, option dealer hedging can exacerbate selling.
🧠 Technical Analysis (1H Chart) (2nd Image Analysis)
Market Structure & SMC:
* 🟥 Multiple CHoCH events confirming breakdown structure
* ❌ Lost prior BOS levels near $321, then $315, and now hovering above $306
* Trading firmly inside a downward-sloping channel
Trendline Dynamics:
* Well-defined descending channel from recent highs
* Lower bound points toward $300–$295 in coming sessions
SMC Zones:
* 🟩 Demand Zone: $300–$295 → Last defense before deeper drop
* 🟥 Supply Zone (Purple Box): $319–$325 → Major resistance cluster
🔄 Price Action & Key Levels
* Support:
* ✅ $306.99 → Current defense
* 🚨 $300.41 → Critical gamma floor
* 📉 $295 → Lower channel target
* Resistance:
* 🚩 $311.64 → First reclaim needed for relief
* 🚩 $319–$321.36 → Key supply & call wall zone
🧭 Scalping / Intraday Trade Setup
🟥 Bearish Setup (Preferred):
* Entry: Breakdown below $306
* Target 1: $300.41
* Target 2: $295
* Stop: Above $311
🟩 Bullish Reversal Setup:
* Entry: Reclaim of $315 with volume
* Target 1: $321
* Target 2: $325
* Stop: Below $311
🔁 Summary Thoughts
* TSLA remains in a clear downtrend with a negative gamma backdrop.
* $300.41 is the key gamma floor — holding it may see a short-term bounce, breaking it risks a fast flush to $295.
* Until bulls reclaim $315, all rallies remain suspect.
🚨 Disclaimer:
This analysis is for educational purposes only and does not constitute financial advice. Always do your own research and manage your risk accordingly.
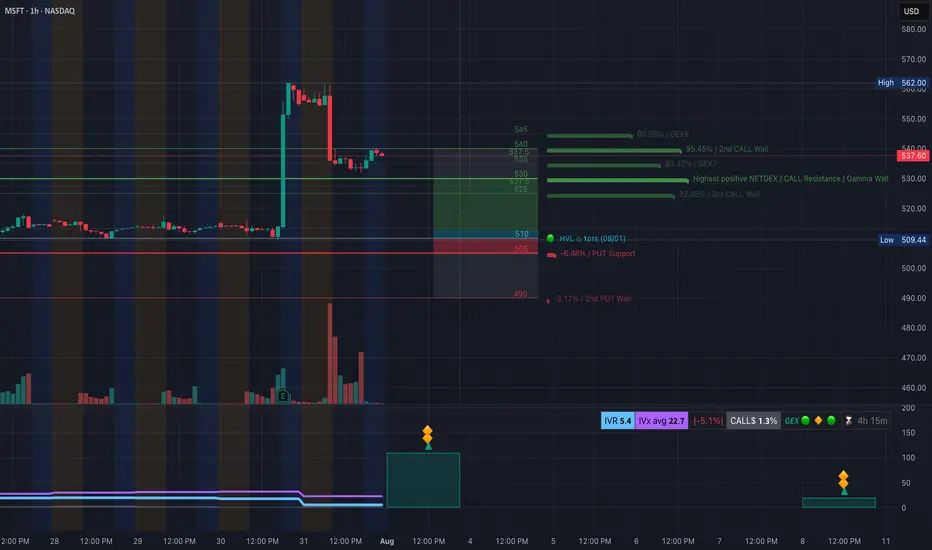
MSFT Post-Earnings Surge. 8/1MSFT Post-Earnings Surge — Consolidation Before Another Leg Up or First Sign of Exhaustion?
🔍 GEX & Options Flow Insight (1st Image Analysis)
Microsoft exploded higher after earnings, reaching the mid-$530s before pulling back slightly. It now sits between strong gamma support and a major Call Wall cluster, indicating a consolidation phase that could lead to either a continuation move or a deeper retracement.
* Call Walls & Resistance:
* 📍 $537.60 → Current price zone, right under minor gamma resistance
* 📍 $540.00 → 2nd Call Wall (95.45% GEX7)
* 🧱 $545–$562 → GEX8/extension zone for a bullish breakout target
* Put Support Zones:
* 🛡️ $530–$525 → Gamma pivot area; losing this would weaken bullish positioning
* 📉 $510.00–$505.00 → Strong HVL + PUT wall support
* 🚨 $490 → Second PUT wall = major breakdown trigger
* Volatility Insight:
* IVR 5.4, IVx Avg 22.7 → Low IV = cheaper premium for spreads
* Call flow 1.3% = Low aggressive bullish positioning
* GEX sentiment: 🟢🟡🟢 = Still supportive for consolidation with bullish lean
✅ Option Trading Suggestion:
Bias: Bullish consolidation, but near-term capped under $540 unless volume expansion
Strategy: Debit call spread for limited risk
* Entry Idea: Buy 540C / Sell 550C for Aug 2 or Aug 9 expiry
* Invalidation: Daily close under $525
* Target: $545 short-term, $562 on breakout
Why this works: MSFT is supported by gamma positioning above $525 and could make a clean push toward $545+ if earnings momentum continues. Spreads help protect from IV crush after earnings.
🧠 Technical Analysis (1H Chart) (2nd Image Analysis)
Market Structure & SMC:
* ✅ Clear BOS (Break of Structure) on earnings gap
* 🟢 Price is consolidating within the post-gap range
* ⚠️ Potential CHoCH forming if price fails $525, which would indicate weakness
Trendline Dynamics:
* Holding above short-term uptrend support line
* Still in a steep post-gap bullish channel
SMC Zones:
* 🟩 Demand / OB Zone: $530–$525 → High-probability bounce area
* 🟥 Supply Zone (Purple Box): $538–$545 → Overhead resistance from post-gap highs
🔄 Price Action & Key Levels
* Support:
* ✅ $530–$525 → First defensive zone
* ✅ $517–$513 → Secondary support
* 🚨 $510–$505 → Hard gamma floor
* Resistance:
* 🚩 $540 → 2nd Call Wall resistance
* 🚀 $545–$562 → Extension zone if breakout occurs
🧭 Scalping / Intraday Trade Setup
🟩 Bullish Setup:
* Entry: $530–$532 dip reclaim
* Target 1: $540
* Target 2: $545–$550 extension
* Stop: Close under $525
🟥 Bearish Pullback Setup:
* Entry: Rejection at $540
* Target 1: $530
* Target 2: $525
* Stop: Breakout above $540 with volume
🔁 Summary Thoughts
* MSFT has post-earnings momentum but is consolidating just below a Call Wall cluster.
* Holding $525–$530 keeps the bullish case alive toward $545+.
* Options are cheap enough for defined-risk bullish spreads, but caution if $525 breaks.
* Expect range-bound chop until a decisive breakout over $540 or a breakdown under $525.
🚨 Disclaimer:
This analysis is for educational purposes only and does not constitute financial advice. Always do your own research and manage your risk accordingly.
ATAI Bulls break to weekly higher highsNASDAQ:ATAI Bulls break to weekly higher highs, making 3.06 Monday's low now THE most important support level going forward.
Support: 4.04, 3.66, 3.61
Resistance: 4.29, 4.52
