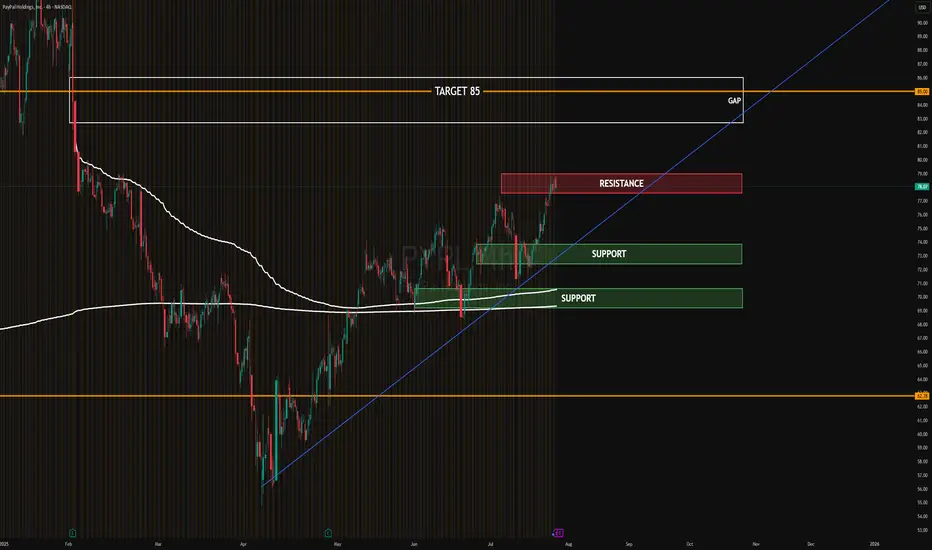
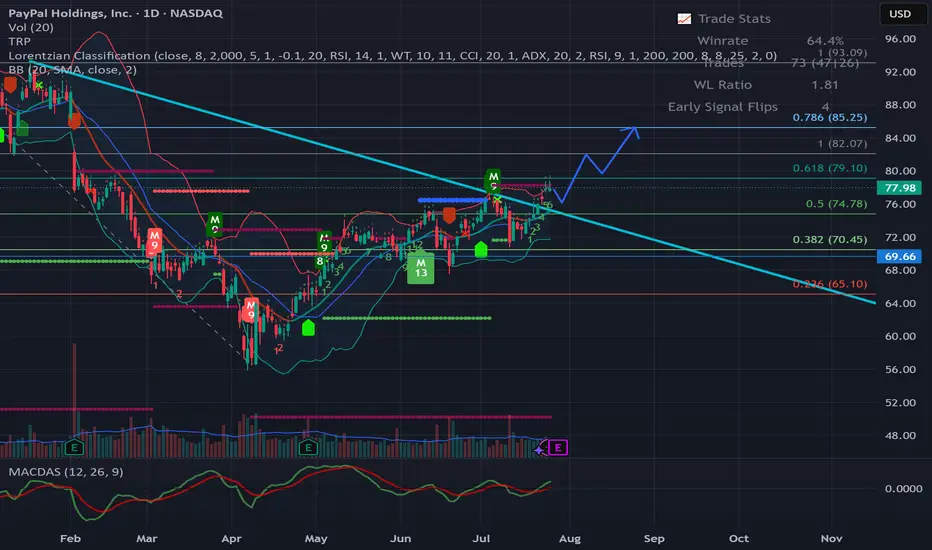
PYPL EARNINGSRESISTANCE: $78.50 – $79.50 → Current supply zone capping upside
SUPPORT ZONES:
$73.00 – $74.00 → Immediate support
$69.50 – $71.00 → Critical zone to hold structure
GAP TARGET: $85.00 → Upside potential if earnings surprise
Trendline: Strong bullish trend since May, still intact
ALB Long, Resurrection of lithium trendALB have started to rise in recent weeks. It's price stays near 5-year lows.
Long-term Price Levels already have worked to bounce the stock by around 50%+.
Most likely funds have started to trade it in Mean Reversion strategies. So, the movement back to 200MA and 800MA on Weekly time-frame is quite possible.
As fast as banks would start to rise stock's rating - it will go sky high.
Recently UBS already cut it's rating to "Sell". Yet, trend already is mighty enough and just kept going higher.
Full margin on every black 1D candle!

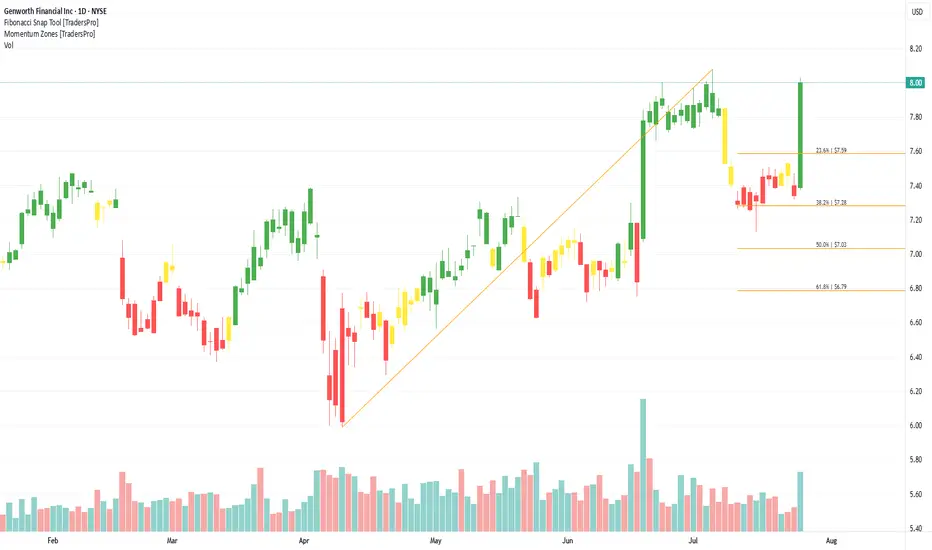
Genworth Financial Inc. (GNW) Supports Aging NeedsGenworth Financial Inc. (GNW) is an insurance holding company offering long-term care, life insurance, and annuity products. The company helps individuals plan for aging and retirement with financial protection solutions that address rising healthcare costs and longevity risk. Genworth’s growth is driven by an aging population, increasing demand for long-term care coverage, and efforts to modernize insurance offerings for today’s retirement needs.
On the chart, a confirmation bar with rising volume shows bullish interest. The price has entered the momentum zone by breaking above the .236 Fibonacci level. A trailing stop can be set just below that level using the Fibonacci snap tool to protect gains while leaving room for continued upside.
SOFI EARNINGSResistance Zone: $22.50 – $24.00
Support Zone 1: $18.00 – $19.50
Support Zone 2 / EPS Breakout Line: $14.50
Bullish Target: $25.00
Trendline: Still intact — medium-term trend remains bullish

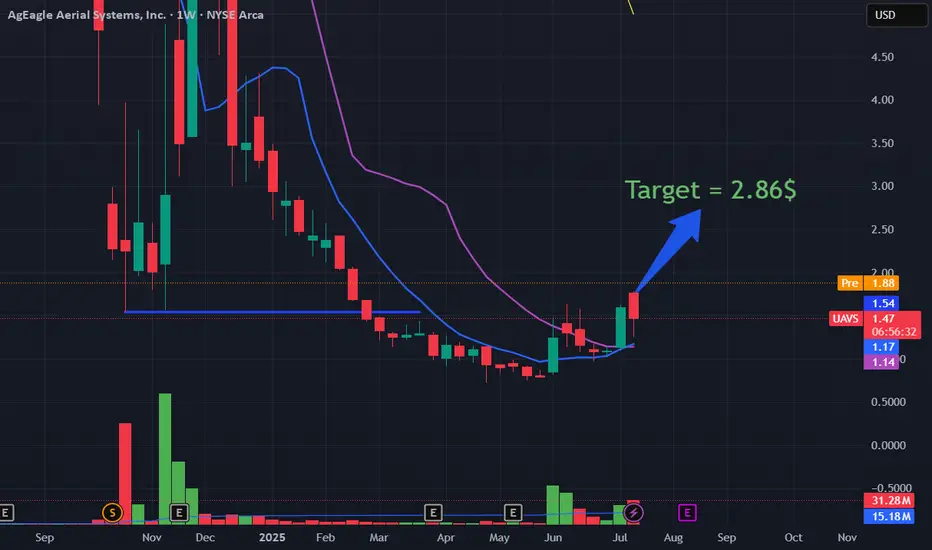
UAVS about to give 100% gainsShort post: UAVS has positive news on receiveing government approval. It has also seen a major volume spike recently and I expect it to go to 2.86 soon. If this breaks 2$ today then next target is 2.45lvl.
tradingview.sweetlogin.com
APLD Trade Setup
🔹 Target: $22.67
🔹 Stop Loss: $9.13
🔹 Entry Zone: Around $15.50 or better on a dip
🔹 Risk/Reward: ~1:1 at CMP, ~2:1 if entry near $13.50
🔹 Bullish momentum intact if it holds above $11.65
📌 Watching for continuation toward 2.0 extension level. Trade safe!
#APLD #TradingView #Stocks #Fibonacci #SwingTrade

NatWest Group (NWG): A Kicker Setup Is BrewingKicker-like Surge Shifts Tone
The latest daily candle resembles a bullish kicker, gapping above the previous day's range with strong follow-through—a possible sign of sentiment shift. Notably, this move came with an RSI jump from the equilibrium zone of 50 to near 60, suggesting growing momentum. Price has pushed through immediate resistance near $14.00 while holding firmly above the rising 50-DMA. RSC with SPX is indicating a revival in strength.
📆 Weekly Chart Overview
After a brief multi-week pullback, NWG appears to be stabilising just above its 20-week moving average. The latest weekly candle shows a strong rebound, closing near the highs and gaining over 6%, suggesting renewed buying interest. RSI has turned upward from the 60 zone, indicating momentum may be regaining strength. This price action, coupled with the overall trend structure, suggests the broader uptrend remains intact and buyers may be attempting to reassert control.
Gautam Mazumdar

CDNS - Another One that Break the Previous High Hello Everyone,
Last one for this week is CDNS Cadence Design Systems
What They do?
Cadence Design Systems’ products include Industry leading EDA (electronic design automation) tools, an IP portfolio which includes predesigned and configurable blocks, automated packaging tools, PCB layout and routing technologies, verification tools and hardware, and more. Cadence products are used in a variety of market segments, including mobile, consumer, cloud datacenter, automotive, aerospace, IoT, industrial and others. The Cadence Design Systems IP portfolio includes Tensilica DSPs for AI, vision, audio, IoT, and baseband applications; Denali memory and storage IP; and controllers for the latest standard interfaces including PCI Express, USB, and Ethernet. As of December 2021, the company operates in 20 countries across the globe and employs approximately 7,600 people.
Financial Highlights:
Every year Revenue increased last 15 years
2025 (TTM) $4.87 B 5.03%
2024 $4.64 B 13.48%
2023 $4.08 B 14.83%
EPS (TTM) 3.95
On Friday it broke to previous high which was hit 4 times in the past.
Jun 24
Jan 25
May 25
Jul 25
First stop 350-353 then in this point it can play around then final target for me is 430 - 433 which is more than %30 up.
It can try to re-test 327 again. If re-test then i can directly jump in it. If not then trend is UP now and i see again big potential this one too. Maybe it can make us rich :)))
This is just my thinking and it is not invesment suggestion , please do not make any decision with my anaylsis.
Have a good start a Weekend

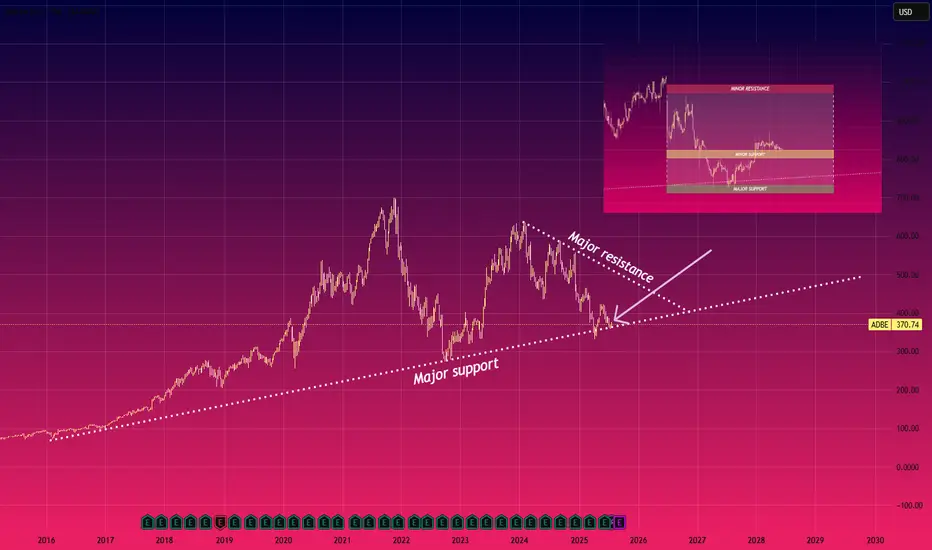
L: Quick Analysis on $NASDAQ:ADBE Support and ResistanceQuick Analysis on NASDAQ:ADBE Support and Resistance
The chart shows NASDAQ:ADBE nearing a major support level around $370, Which has held since 2016, the downward resistance line suggests continued pressure, but a breakout above $400 levels could signal a bullish reversal
Please note this is not financial advice
ETN - Break Previous HighHello Everyone,
This is the 3rd one that i would like to mention.
What they do?
Eaton Corporation focuses on solving challenges in electrical, aerospace, hydraulic, and vehicle products (including eMobility) through its power services. These products promote efficiency and safety for industry usage. In dealing with electrical demands, Eaton is one of the top four large global players in the worldwide low- and medium-voltage electrical market.
Financial Highlights:
Record First Quarter Results: Eaton reported with strong sales and profit growth across its segments.
Aerospace Segment: Record sales of $979 million, up 12% organically.
Vehicle Segment: Sales of $617 million, down 15% due to organic and currency impacts.
Organic Growth: Continued strong organic growth across the company.
Backlog: The backlog in the Aerospace segment was up 16% organically.
Full Year 2025 Guidance:
Organic Growth: 7.5-9.5%.
Segment Margins: 24.0-24.4%.
Earnings per Share: Between $10.29 and $10.69, up 10% at the midpoint.
It pays also dividend , current dividend yield %1.04
So, on Thursday it broke the previous high which was reached the last year on December.
On Friday it continue to go high.
Options : it can re-test the 379 the go up to 500 - 505 , or directly it will go to UP till reach to 500-505.
First resistance is in 433.
This is one of the stocks that has really big potential for me and other advance is they are paying dividends. But all in all my expectations are quite high for this company.
This is just my thinking and it is not invesment suggestion , please do not make any decision with my anaylsis.
Have a good start a Weekend

LUNR - Big Potential Hello Everyone,
2nd stock for today is LUNR Intuitive Machines, Inc.
What they do?
Intuitive Machines, Inc. is a public U.S.-based aerospace firm headquartered in Houston, Texas. Founded in 2013, the company specializes in commercial lunar exploration, offering payload delivery, mission control capabilities, and the development of lunar infrastructure.
Core Business Lines
Lunar Access Services – Cargo and scientific payload delivery via Nova‑C landers
Lunar Data Services – Building the Near Space Network (satellite/relay comms system)
Infrastructure-as-a-Service – On-surface navigation, maintenance, and automation systems
Financial:
It is still not a profitable company
Q1 25 - Revenue $62(m) / EPS ($0.11)
In the chart i see a big opportunity to reach 18.50 level which is over %40 gain .
There is a break up the up trend and already re-testet break level, so direction is now Up.
My final target is 18.00 / 18.50 . Resistance levels you can see in Chart as Fib levels.
Final remark, as i say long term i think it is one of the stocks that has a big potential.
This is just my thinking and it is not invesment suggestion , please do not make any decision with my anaylsis.
Have a good start a Weekend

PYPL - Potential to 85.00Hello Everyone,
This week i will be busy on Sunday and not have time to work on Charts. Therefore today i spent some time and make some analysis.
PYPL is the first one.
Look like there is a break out to up trend and I am expecting it to reach 85 soon which is more than %10 .
It could re-test to 74.50 - 75.00 , if it will re-test then these price levels could be a good entry point to maximize profit. If not then maybe we can see some back off in 79.00.
Final target for me 85.00 / 86.00 . All in All trend is UP
This is just my thinking and it is not invesment suggestion , please do not make any decision with my anaylsis.
Have a good start a Weekend
CAN I believe CAN has developed a flag that rests on the support at around the 077 level from which it could restart, otherwise a return to the lows

RIOT: Sideways is goodRIOT has broken above a very important downward channel dating back July of 2023. It is imperative that RIOT stays above the channel. The sideways consolidation while BTC and the crypto market corrects is a pretty good sign. Next week might be more of the same, maybe a bit more down to gain the momentum back for the last leg up. If we get the final move up, it will confirm a 5 waves sequence. The target would be between 2 to 2.618 extension between $18.68 to $24.33.
On the flip side, going back inside the channel would be a sign of weakness. Going back to $11 would be a confirmation of bull run end. All will depend on how the broader crypto market performs for the next 2 weeks or so.

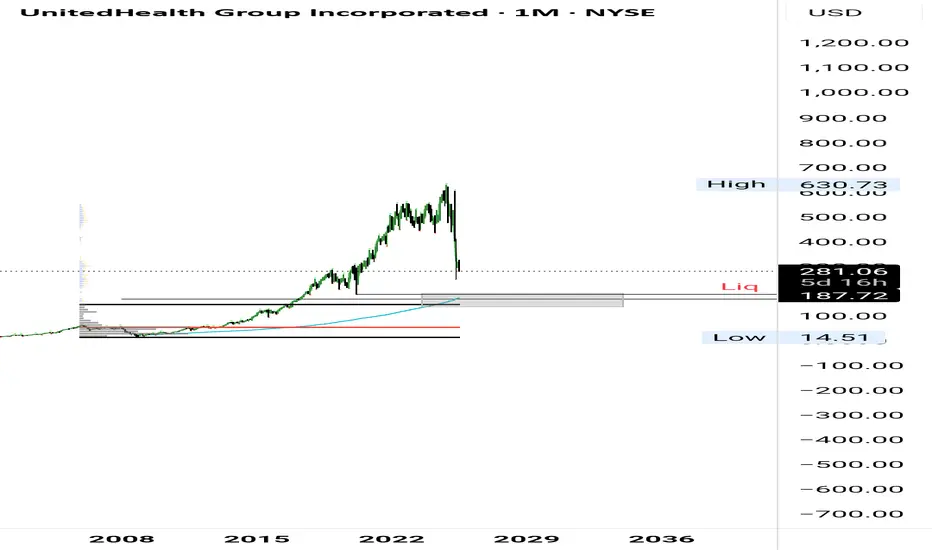
UNH Long Setup BuildingStill expecting more downside. Area of interest isn't far—anchored VWAP, VAH, 0.75 fib, and a possible liquidity sweep all line up there.
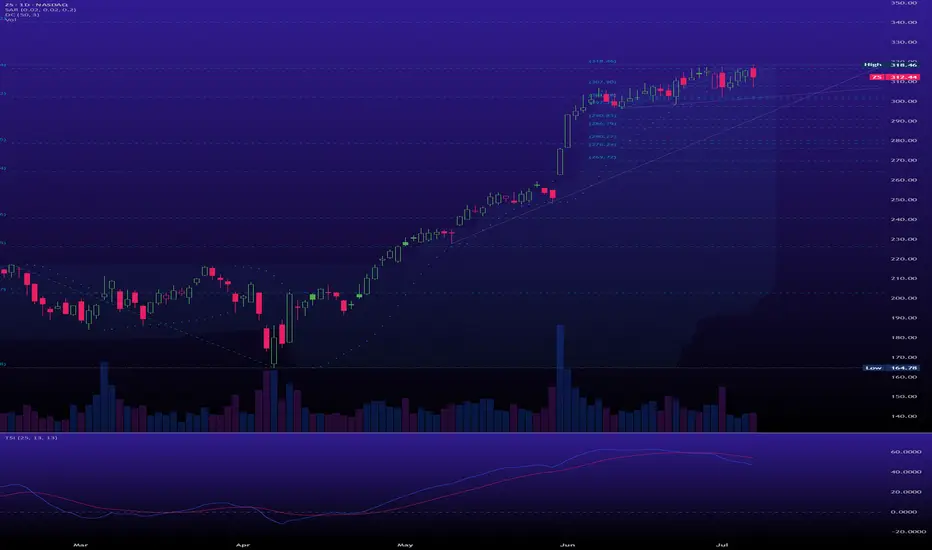
ZS is starting the early sign of the Wyckoff distribution phaseMarkup (Phase E) that has been going on for months. But look closer. The momentum is getting tired. The daily chart is where the truth comes out. After that magnificent run, the price has stalled and started moving sideways for a month.
Entry Level: Initiate a trade if ZS rallies to the $325 - $327 area and fails to hold its gains.
Price Target: The ultimate target is the start of the markdown phase, with an initial price objective around $250.
Stop Loss: A confirmed weekly close above $335 would indicate the distribution pattern has failed and you should exit the trade.
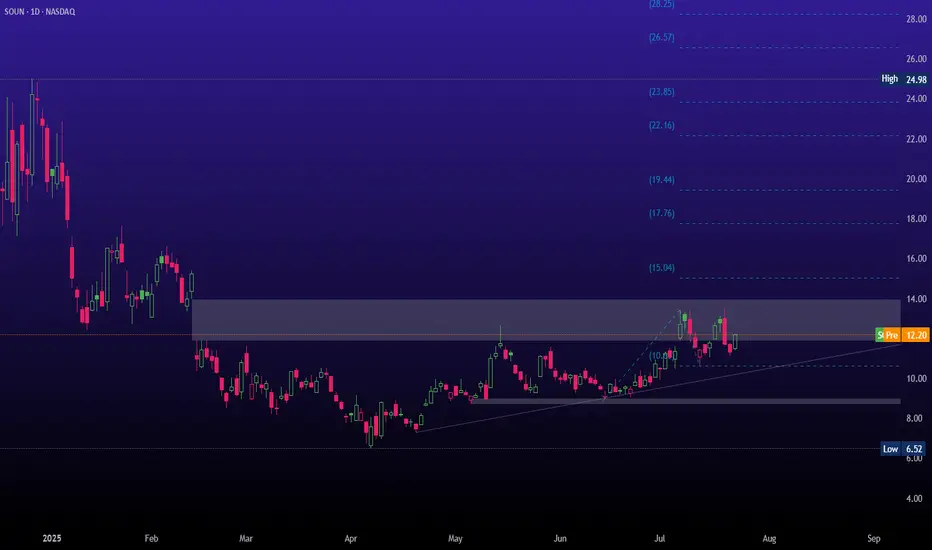
SOUN is about to enter the Wyckoff Markup phaseThis is a classic Wyckoff setup—accumulation, SOS, then a shallow pullback on dead volume.
Don’t miss this Move on LTBRLTBR forming a classic cup and handle with confluence in the timing of recent institutional exposure.
The chart speaks for itself

IBM Rebound Trade - Buying the Pullback at Key ConfluenceSetup:
IBM is setting up for a potential high-conviction long entry around the $245 level, a price zone marked by multiple layers of technical confluence and volume-based support. Over the last 18 months, IBM has seen two notable pullbacks—both in the 17–20% range, often around earnings events. The current drawdown is consistent with this historical behavior and may represent an opportunity rather than a breakdown.
Technicals & Indicators
Volume Profile Support:
Using a volume profile anchored from January 2024, a clear volume shelf exists between $245 and $265.
A second profile anchored 10 months ago confirms heavy volume at $260 and $245, indicating high institutional activity and potential support zones.
200-Day Moving Average:
IBM has consistently respected its 200-day MA over the past two years. The MA is now converging at $245, adding dynamic trendline support.
Fibonacci Retracement:
Applying retracements from the April 2025 lows to the recent ~ $300 highs, the $245 level aligns with the 61.8% Fibonacci level, a key zone for potential reversals.
GAP Fill:
Looking for the recent earnings gap to close within the next 2 months, as we see new opportunities for tech companies and rising demand. This overreaction created a gap that should be filled as investors digest the macro strength and re-enter long positions in IBM. Gap close ~ $280 level.
Candles & Buying Pressure:
Recent daily volume after earnings suggests strong buying pressure with a hammer/doji candle forming on the day after earnings. Investors are already buying back into this name.
Fundamentals & Business Operations:
Despite the post-earnings dip, IBM continues to display strong business fundamentals:
Free Cash Flow (TTM): ~$12.3B, supporting dividends and future investment.
FCF Margin: 19.1%
Gross Margin: ~58% | Operating Margin: ~ 17%
Forward P/E: ~22.45x | EV/EBITDA: ~19.85x
Dividend Yield: 2.6%
These metrics reflect operational efficiency, cash generation, and relative undervaluation compared to peers—especially given IBM’s AI and hybrid cloud positioning that remains strong. With margins that continue to be at the top of the industry, IBM also has the resources to execute on the tremendous opportunities arising in the tech world.
Macro & Industry Context:
We’re in the early stages of a long-term AI and data center growth cycle, and IBM, while not the most popular AI name, is deeply embedded in enterprise infrastructure, consulting, and mainframe compute. Their recent earnings beat didn’t change that narrative. Investor sentiment overreacted, giving patient traders a potential entry on weakness. Analysts still hold a buy on this name with price targets well above $270. This isn't a one-day trade, but in a few weeks, let's see where the market is at.
Price Targets & Risk/Reward:
Entry Zone: $245 (watch for confirmation & strength)
Target 1: $280 (resistance level with high volume in the range)
Optional Long-Term Hold: If the broader AI trend continues, IBM could break all-time highs and trend above $300 over time.
Strategy & Patience:
This is not a chase setup. I will wait for $245 to be reached and confirmed—a level backed by technical support, volume profile, and long-term valuation logic. If IBM holds and reverses with strength, this could be a strong swing trade or even a long-term position for investors who want value with AI exposure. I will be looking for a confirmation(maybe a candle pattern) before entering the trade, but if it gets there, I see good potential for a bounce.

A to 236 or B killing A to 420Tesla is one of those stocks that is heavily manipulated algorithmically. When we were in an uptrend and needed a little push, a large fractal was created that could break a previously formed structure which should have taken us to $236(A). Interestingly, a very strong symmetrical triangle has emerged, influencing this upward movement, and the final price—due to some mystical reason—seems to be $420(B). It’s also worth noting that this whole move is being influenced by another similar structure whose target is above $600. So, if we analyze everything that’s happening, a 12% drop in sales means nothing compared to what Tesla will gain from robots, restaurants, and robotaxis, which I call RRR

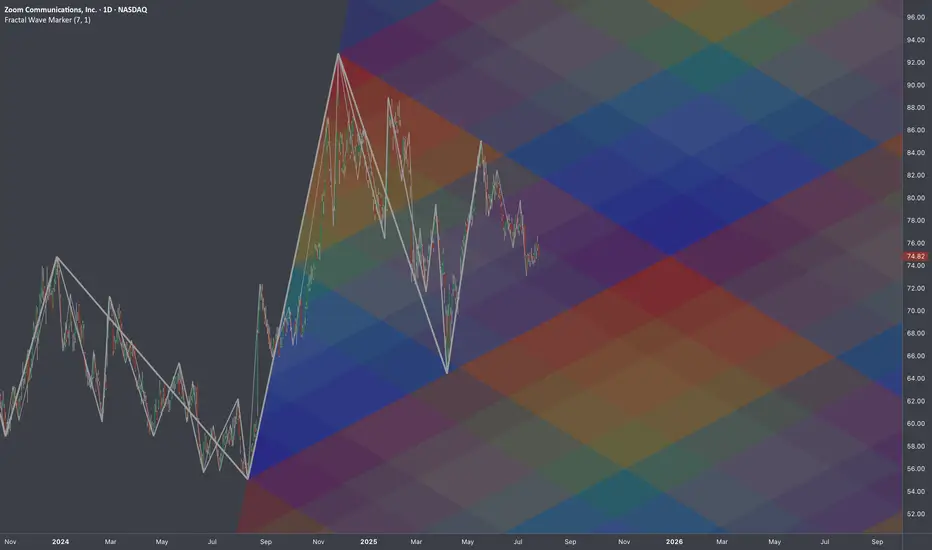
$ZM: Fibonacci Gradient 🏛️ Research Notes
Original Structure
Substitute for projection (TV's drawing tool)
I was thinking if using same 3 coordinates of cycle to cover future 2-polar expansions after breakout. That's why descending fibs would start with coldest (at breakout zone it would be relevant) and vise versa.
Same but with added counter-direction to produce gradient effect of decay.
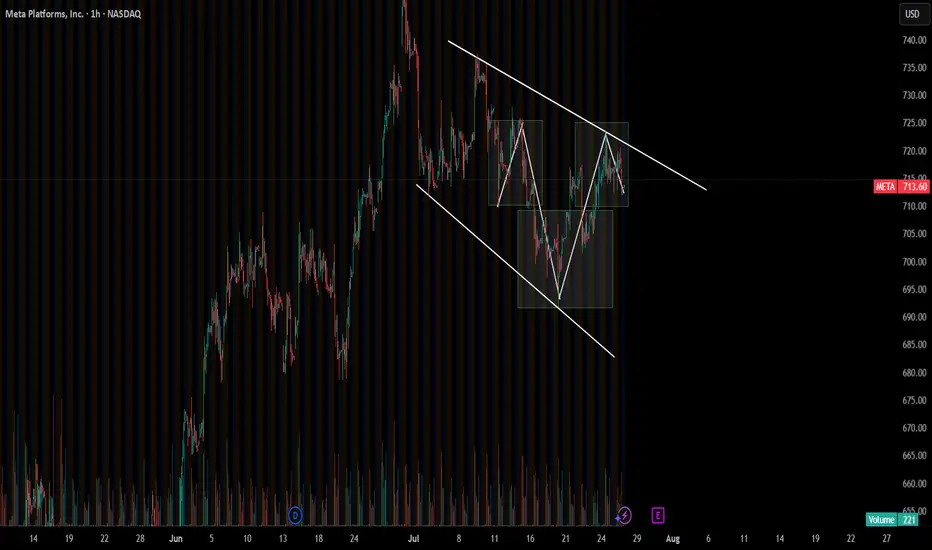
META CANT KEEP THE HULK DOWN!!!!META has been consolidating for a few weeks now, but it's still in this bull flag that looks like it might break out soon, hopefully before earnings on Wednesday, July 30. I love technical analysis on charts, and this inverse head and shoulders pattern has been effective on most semiconductor names lately. We will know for sure next week.