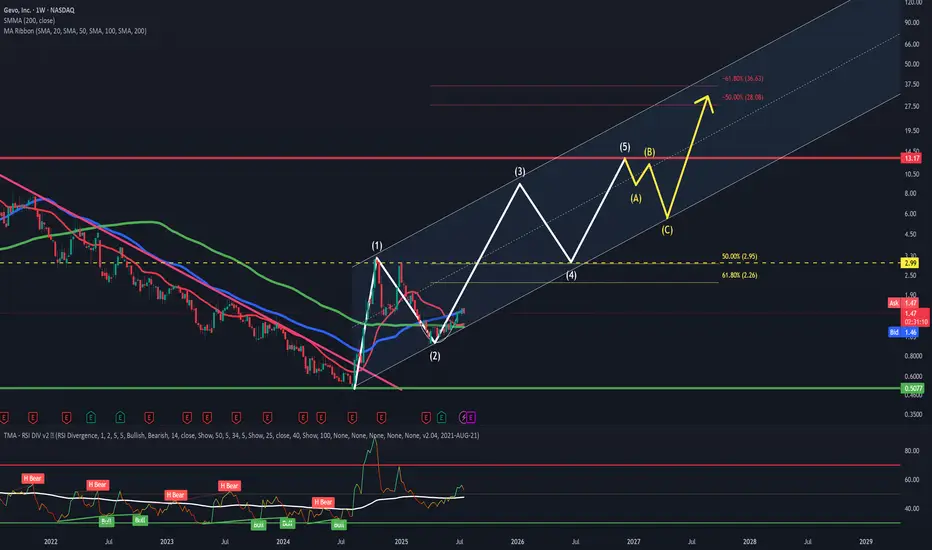
Looking goodAfter a clean breakout of the long lasting downtrend we suffered which ended on 3rd September 2024, we experienced explosive price action. This quickly got knocked off of it's feet due to it reaching 50.00% fib level, so a downtrend since then was expected given how extended we were.
Since the cool off, GEVO has found itself within a newly formed channel, along with testing the 100day SMA and 20day SMA and breaking past the RSI MA. With this, I'm expecting a move back up toward the resistance we'd rejected from prior, this being the yellow dashing lines. A minor retracement then a break above, along with a retest would be nice OR blowing straight past then a retest. This is what I'm looking for. With the retest, the next target will be the red line sitting at $13.17. Moving into an ABC retracement, then continuation later on.
(This is my first time trying EW)
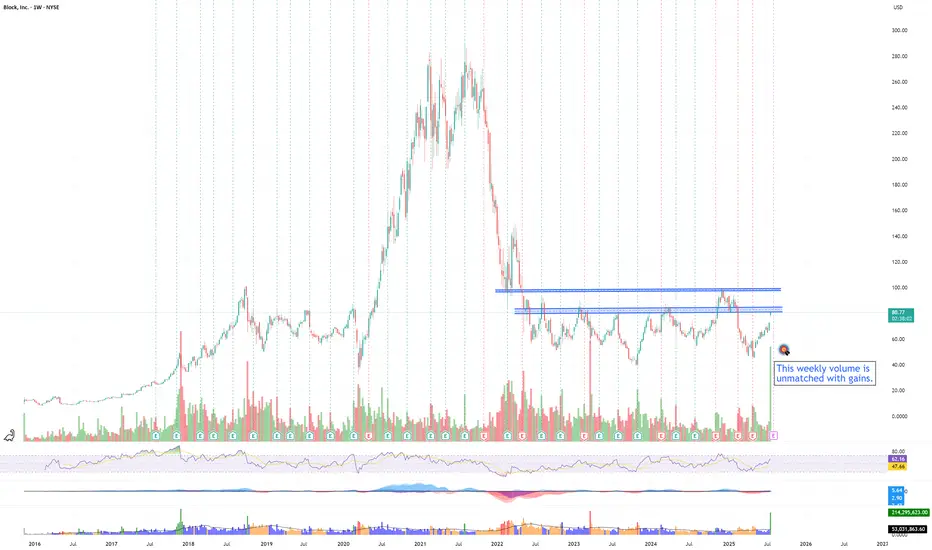
XYZ momentum is buildingXYZ positive weekly volume this week is a first in its history! Even though it has never had this much 'green' volume in its weekly history, there is plenty of resistance to be overcome for this stock
$81-85 will be challenging as sellers all the way from 2022 will begin dumping shares, especially when uncertain market conditions will be pushing them to sell. If it consolidates at 85, plan for a move to 98, where there will be another wave of sellers from Dec 2024 and 2022.
XYZ moves will parallel the BTC market with a lag. When BTC breathes, XYZ will breathe. With a BTC bull, expect XYZ to run.
Rating is neutral as this needs to break through resistance prior to accumulation, not the other way around.
SOMETHING SEEMS NOT RIGHT: INSIDE TRADING?In the early hrs of 07/25/2025, between 6-7 am, right before the earning, the stock plummeted 16.16%. Can you smell inside trading here? because I do. Then, magically, during the earning call, with the promise of a " better future", the stock recovered and gained 6%. If you look for the beginning of the month, when the stock collapsed almost 50% from $57 - $34 you can tell what an empty promise looks like.

Textbook Head & ShouldersThis looks like an epic wave 3 drop of a larger 5 wave crash, completing a textbook head and shoulders pattern. This is not a stock I'd be looking to be a bag carrier of, but it's peaked my interest as it has the potential of a 59% dead-cat-bounce to the upside. With these types of falling knives you must define your risk and cut your loss if support is lost.
Reasons it could find support - at $25 it has reached a support level from 2014, a whole 10 years ago. A confluence of the weekly level and 0.786 Fib. I must stress, I fully expect this to eventually fail and complete an epic Head & Shoulders pattern down to the Point of Control. We trade the same charts long and short.
Not financial advice, always do what's best for you.

Magnificent 7 buy signalMagnificent 7 buy signal. These stocks are trading above their moving averages on 3 hour candle chart which is bullish. This basket made on tradingview consists of the 7 stocks.
Right now there is break through the resistance level and further upside is expected.

Amazon Has a Mixed Technical Picture Heading Into EarningsNext week will see four of the "Magnificent Seven" stocks report quarterly earnings -- Apple NASDAQ:AAPL , Amazon NASDAQ:AMZN , Microsoft NASDAQ:MSFT and Meta Platforms NASDAQ:META . Let's check out AMZN ahead of its results.
Amazon's Fundamental Analysis
FactSet recently reported analysts' consensus view calls for S&P 500 companies to see 9.3% earnings growth for 2025 as a whole, of 9.3%, up from 9% in 2024.
But very interestingly, FactSet also said that earnings growth across the "Magnificent Seven" is projected at 14.1% year over year for just Q2 alone.
By contrast, analysts project just 3.4% y/y earnings gains for the S&P 500's other "Less Than Magnificent 493." That illustrates the Mag-7's impact on the broader market.
As for Amazon, analysts estimate that the e-commerce giant will see $1.32 in Q2 GAAP earnings per share on roughly $162 billion of revenue.
This would represent 4.8% y/y growth from Q2 2024's $1.26 in GAAP EPS, as well as a 9.5% y/y gain from the approximately $148 billion in revenues that AMZN saw in the same period last year.
This has become the norm for Amazon, as revenue growth has landed between 9% and 11% for each of the past four quarters (and is projected to print within that range for the next four quarters as well).
But significantly, of the 34 sell-side analysts that I can find that track AMZN, 27 have reduced their Q2 earnings estimates for the firm since the current quarter began. (The other seven swam upstream and actually boosted their forecasts.)
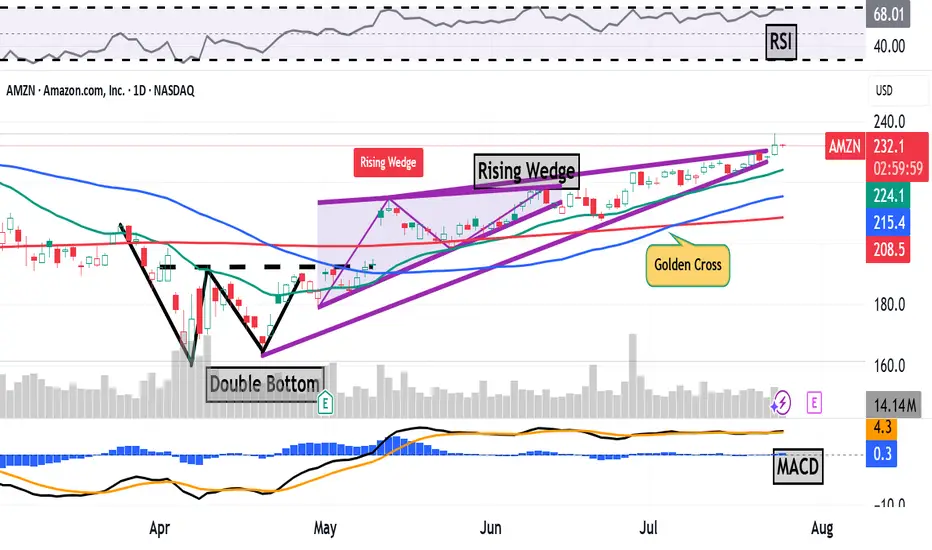
Amazon's Technical Analysis
Next, let's look at AMZN's chart going back some six months and running through Tuesday afternoon:
This is an interesting chart, with both positive and negative technical signals.
On the positive side, the stock saw a "double-bottom" pattern of bullish reversal that spanned the month of April, with a $193 pivot (marked "Double Bottom" at the above chart's left).
That produced an upside breakout that appeared to accelerate, with a "golden cross" occurring on July 7 (marked at the chart's right).
A golden cross is generally seen as a bullish technical pattern that occurs when a stock's 50-day Simple Moving Average (or "SMA," denoted with a blue line in the chart) crosses above a rising 200-day SMA (the red line).
There's a catch, though.
While breaking out higher in the chart above, AMZN appeared to develop a "rising-wedge" pattern of bearish reversal, marked with purple diagonal lines in the chart above.
Readers will note that this pattern actually began at the nadir of the double bottom's second bottom in late April. The rising wedge's upper trendline then kicked in on May 13, but the pattern's two lines appear to be closing.
When a wedge closes after two to three touches on each trendline (which we have here), the resultant move can be explosive.
However, it's not necessarily clear which way a stock will move from there -- up or down. A true closing pennant can explode violently in either direction, but as noted above, what we're seeing with Amazon is a pattern of bearish reversal.
This does give me pause about AMZN and makes me more cautious than I might otherwise be about getting involved with the stock ahead of earnings. (I don't currently own any AMZN shares.)
Meanwhile, Amazon's Relative Strength Index (the gray line at the chart's top) looks strong, but nowhere near being technically overbought.
That said, the stock's daily Moving Average Convergence Divergence indicator (or "MACD," marked with black and gold lines and blue bars at the chart's bottom) isn't telling us much at all.
The histogram of Amazon's 9-day Exponential Moving Average (or "EMA," marked with blue bars) is flat-lining right around the zero bound, while the 12-day EMA (black line) is running in line with the 26-day EMA (gold line).
While both lines are running above zero, it matters greatly which one ends up on top. For the short to medium term, the bulls will be rooting for the black line, while the bears will be hoping that the gold line can wind up on top.
(Moomoo Technologies Inc. Markets Commentator Stephen “Sarge” Guilfoyle had no position in AMZN at the time of writing this column.)
This article discusses technical analysis, other approaches, including fundamental analysis, may offer very different views. The examples provided are for illustrative purposes only and are not intended to be reflective of the results you can expect to achieve. Specific security charts used are for illustrative purposes only and are not a recommendation, offer to sell, or a solicitation of an offer to buy any security. Past investment performance does not indicate or guarantee future success. Returns will vary, and all investments carry risks, including loss of principal. This content is also not a research report and is not intended to serve as the basis for any investment decision. The information contained in this article does not purport to be a complete description of the securities, markets, or developments referred to in this material. Moomoo and its affiliates make no representation or warranty as to the article's adequacy, completeness, accuracy or timeliness for any particular purpose of the above content. Furthermore, there is no guarantee that any statements, estimates, price targets, opinions or forecasts provided herein will prove to be correct.
Moomoo is a financial information and trading app offered by Moomoo Technologies Inc. In the U.S., investment products and services on Moomoo are offered by Moomoo Financial Inc., Member FINRA/SIPC.
TradingView is an independent third party not affiliated with Moomoo Financial Inc., Moomoo Technologies Inc., or its affiliates. Moomoo Financial Inc. and its affiliates do not endorse, represent or warrant the completeness and accuracy of the data and information available on the TradingView platform and are not responsible for any services provided by the third-party platform.
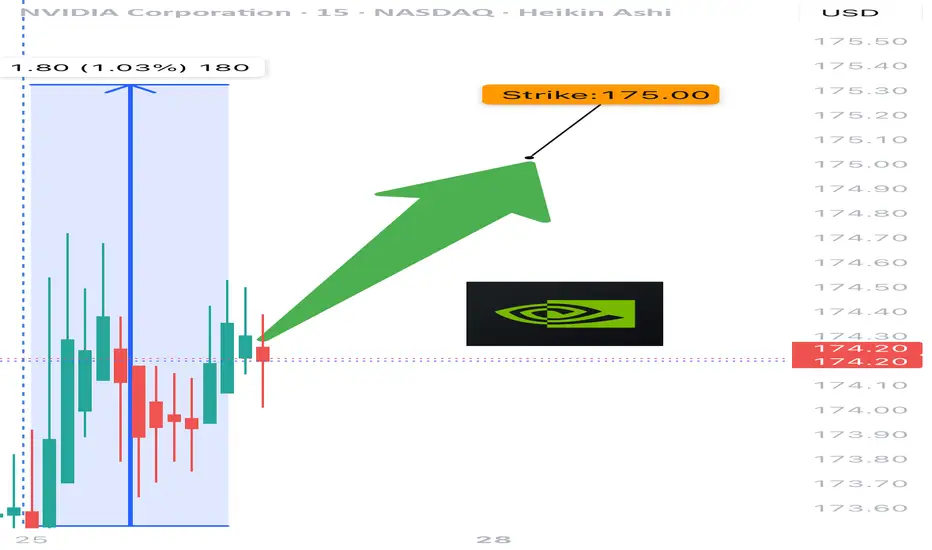
NVDA 0DTE TRADE SIGNAL – JULY 25, 2025
⚡ NVDA 0DTE TRADE SIGNAL – JULY 25, 2025 ⚡
🚀 Strong Bullish Momentum – But Friday Expiration = Gamma Trap?
⸻
📊 Market Stats:
• 💰 Call Volume: Strong
• 🔻 Weak Volume Overall
• ⚖️ Call/Put Ratio: Bullish
• 📈 RSI: Overbought but still pushing
• ⏳ Time Decay: Accelerating
• ☠️ Gamma Risk: 🔥 MAX today (0DTE)
⸻
🧠 Model Summary:
• Grok/xAI: 🔒 NO TRADE today – wait for Monday
• Claude: 🛑 Caution – avoid entries today
• DeepSeek: ⏸️ 4/5 Bullish, wait for cleaner setup
• Gemini: 💡 Suggests $180C next week
• Llama: ✅ Bullish bias, but gamma risk = no go for Friday
⸻
📌 TRADE IDEA: Wait for Monday
📍 Strike: $175 Call
📆 Expiry: Today (0DTE)
💵 Entry Price: $0.56
🎯 Target: $0.95
🛑 Stop: $0.30
📈 Confidence: 65%
🕒 Entry Timing: Monday open IF support holds
⸻
⚠️ Key Warning:
Don’t get trapped by 0DTE gamma swings. Momentum says yes, time decay says no…
✅ Best move? Watch NVDA closely, then strike on Monday if volume confirms.
⸻
👍 Like & save if you’re tracking NVDA.
🔁 Repost if you’re waiting for the perfect Monday setup!
#NVDA #OptionsTrading #0DTE #GammaRisk #BullishSetup #TradingView #TechStocks #WeeklyOptions
Trading stocks using Dr. Elder's "Three Screen Method"The first thing I do is check the weekly chart. Here I see excellent price divergence relative to the MACD indicator
Then I switched to the daily chart and saw the same excellent divergence as on the weekly chart.
The hourly chart also showed excellent divergence. placed a pending buy order above the candle marked with an arrow.
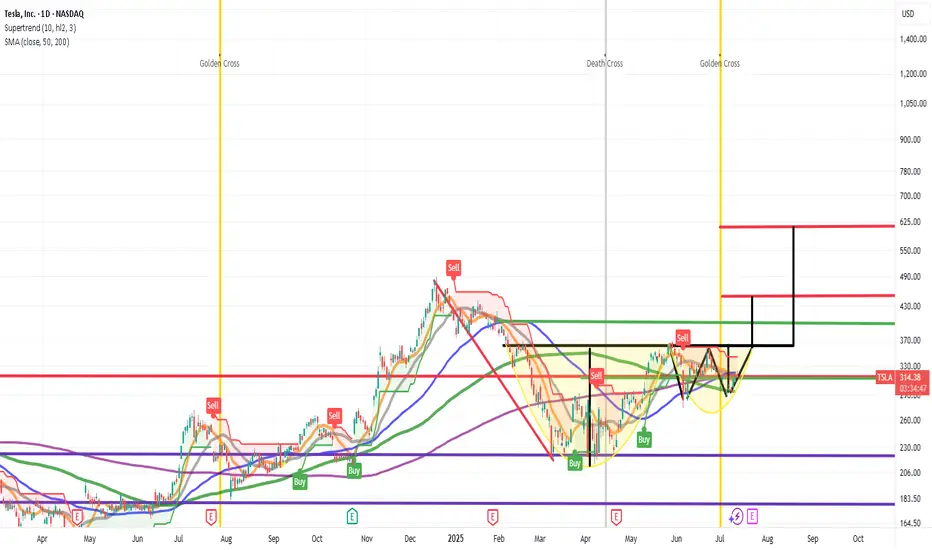
CUP AND HANDLE $TSLA TO $515 MINIMUMThe cup and handle is a bullish chart pattern commonly used by traders to spot potential buying opportunities. It features a rounded "cup" formation followed by a slight downward drift forming the "handle." This pattern typically signals a continuation of an upward trend once the handle completes its consolidation phase.
ROBOTAXI BOOM
BUY NOW NASDAQ:TSLL NASDAQ:TSLA
META WEEKLY TRADE SETUP – JULY 25, 2025
📈 META WEEKLY TRADE SETUP – JULY 25, 2025 📈
🔥 Institutional Bulls Are In Control — 3.05 C/P Ratio!
🚨 BUT — It’s 0DTE Friday, so don’t get caught in gamma fire.
⸻
🧠 Model Consensus:
✅ All Models = STRONG BULLISH
⚠️ Entry Timing: Monday preferred (due to gamma + time decay)
📉 Volume still weak = caution on conviction
⸻
🔍 META Flow Stats:
• 🟢 Calls: 65,379
• 🔴 Puts: 21,409
• 📊 C/P Ratio: 3.05 = Institutional bulls stepping in hard
⸻
✅ RECOMMENDED TRADE – PLAN FOR MONDAY
🎯 Instrument: META Call Option
🟢 Strike: $720
📅 Expiry: August 1, 2025
💵 Entry Price: $0.97
💰 Profit Target: $1.45
🛑 Stop Loss: $0.49
⚖️ Confidence: 75%
🕒 Entry Timing: Market open Monday
⸻
⚠️ TRADE NOTES:
• Don’t enter on Friday – too much gamma risk
• Wait for volume confirmation Monday morning
• Expect short-duration swing (hold 3–5 days max)
⸻
📊 Smart money is bullish, timing is everything.
👍 Like & Follow if META is on your radar!
#META #OptionsTrading #0DTE #GammaSqueeze #BullishSetup #TradingView #WeeklyOptions #TechStocks
Cup & HANDLE + Mini Double Bottom: $TSLA to $610 ScenarioI maintain a bullish stance on Tesla ( NASDAQ:TSLA ), supported by a compelling combination of technical patterns and strong fundamental drivers. The current chart setup reveals a Cup and Handle formation complemented by a Mini Double Bottom, both of which are classic bullish continuation patterns. These suggest a potential breakout scenario that could drive NASDAQ:TSLA to $610 by year-end.
Technical Roadmap:
Gap Fill to $408: Anticipated earnings momentum, particularly from the Robotaxi segment, is likely to propel the stock to fill the previous gap at $408.
Consolidation at $450: Following the gap fill, I expect a consolidation phase forming a “box” around the $450 level.
Breakout to $610: A decisive breakout above $450 could trigger a strong rally toward the $610 target.
***Current Key Catalysts Supporting the Bullish Thesis:
Robotaxi Expansion: Tesla’s autonomous driving initiative is gaining traction, with Robotaxi developments expected to significantly boost revenue and margins.
India Market Entry: Tesla’s upcoming launch in India opens access to one of the world’s largest and fastest-growing EV markets.
In-House Chip Development & Dojo 2 Expansion: Continued investment in AI infrastructure and custom silicon enhances Tesla’s competitive edge in autonomy and robotics.
Tesla Diner Launch: The near-completion of Tesla’s themed diner adds to brand visibility and customer engagement.
Global EV Adoption: Tesla continues to benefit from rising EV demand across multiple international markets.
Optimus Robot Hype: Growing interest in Tesla’s humanoid robot project could unlock new revenue streams and investor enthusiasm.
Favorable Macro Trends: A declining interest rate environment supports higher valuations for growth stocks like Tesla.
Institutional Accumulation: Recent trading activity suggests that institutional investors are accumulating shares within the current range.
Grok AI Integration: The integration of Grok AI into Tesla vehicles could enhance user experience and differentiate Tesla’s infotainment ecosystem.
Investment Strategy:
I recommend initiating or increasing exposure to NASDAQ:TSLL (leveraged Tesla ETF) ahead of the upcoming earnings report. This could offer amplified returns if the bullish scenario plays out. Consider accumulating further on any dips, particularly during the consolidation phase around $450.
BUY NOW NASDAQ:TSLA NASDAQ:TSLL
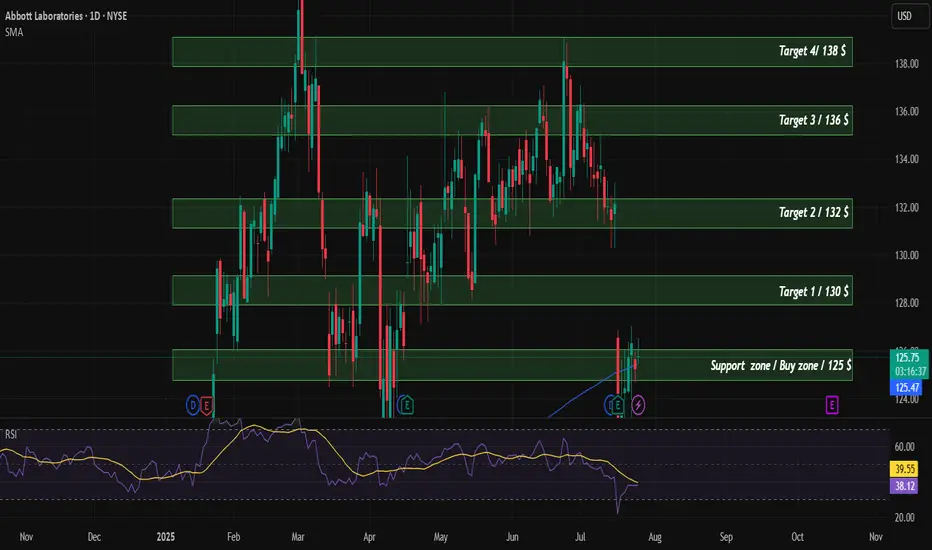
ABT Buy/LongTechnical analysis of the company. According to financial indicators, the company is currently undervalued and is supported by SMA200. The target price for the company is $142.
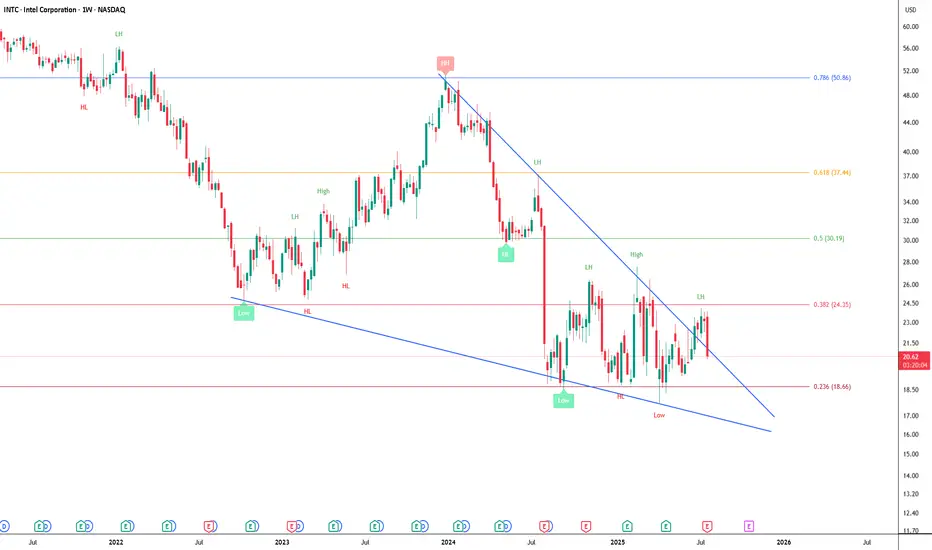
Intel Failed to Get Above the 0.382When the CEO says he is cost cutting across the whole board, but discloses no plan for growth you get the pullback.
Made a LH on the weekly, but the daily still has a HL.
If it fails here, we could see $18 dollars or lower.
Falling Wedge Pattern is still valid.
Next Volatility Period: Around August 21
Hello, traders.
Please "Follow" to get the latest information quickly.
Have a nice day today.
-------------------------------------
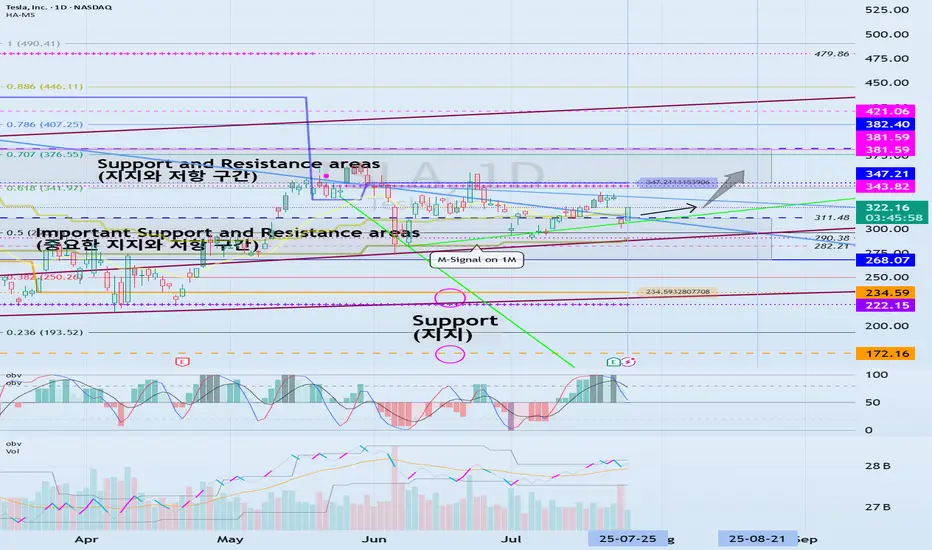
#TSLA
We need to see if it is rising along the rising channel.
The key is whether it can rise with support near 311.48 to break out of the downtrend line.
The key is whether it can rise along the short-term uptrend line and break through the short-term downtrend line after passing through this volatility period around July 25.
Therefore, we need to see whether it can rise above the 347.21-382.40 range with support near 311.48.
The next volatility period is expected to be around August 21.
-
The important thing is to maintain the price above the M-Signal indicator on the 1M chart.
If not, there is a possibility of a long-term downtrend.
Therefore, if it shows support in the 268.07-311.48 range, it is a time to buy.
-
Thank you for reading to the end.
I hope you have a successful trade.
--------------------------------------------------
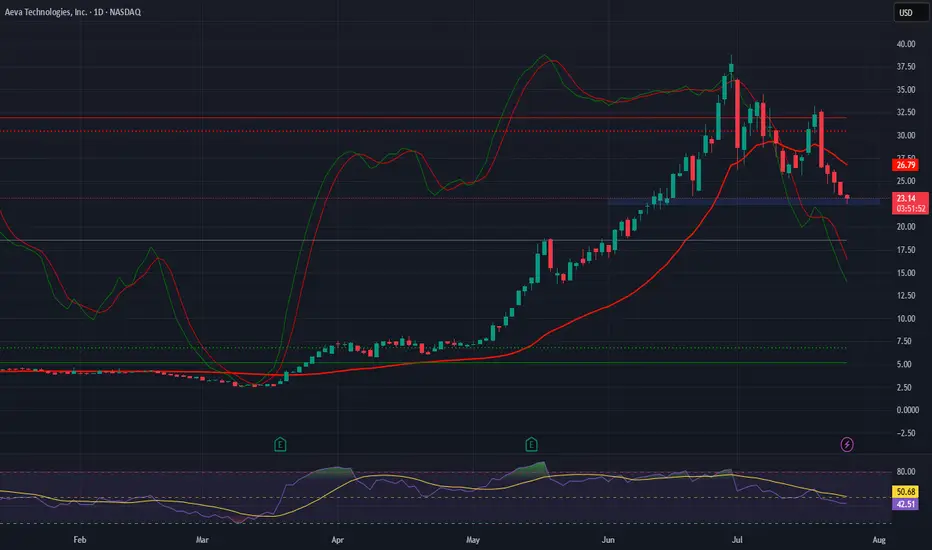
Aeva Technologies (AEVA) – Pioneering Next-Gen LiDAR Company Snapshot:
Aeva NASDAQ:AEVA is revolutionizing perception systems with 4D FMCW LiDAR—offering instant velocity detection, high precision, and long-range sensing, setting a new standard for autonomous systems.
Key Catalysts:
Breakthrough Technology
AEVA’s proprietary 4D Frequency Modulated Continuous Wave (FMCW) LiDAR provides real-time velocity and depth data, outperforming traditional Time-of-Flight systems in accuracy and safety.
Automotive OEM Traction 🚗
Strategic collaborations are translating into production-stage contracts, marking a key inflection from R&D to scalable revenue generation.
Multi-Sector Expansion 🌐
AEVA’s sensing tech is penetrating robotics, aerospace, and industrial automation, significantly broadening its TAM and diversifying revenue streams.
Government & Aerospace Validation
Recent contract wins with defense and aerospace clients underscore AEVA’s technological credibility and commercial viability.
Investment Outlook:
Bullish Entry Zone: Above $22.50–$23.00
Upside Target: $39.00–$40.00, supported by production scaling, cross-sector adoption, and deep-tech differentiation.
⚙️ AEVA stands at the forefront of smart sensing innovation with strong momentum into high-growth verticals.
#AEVA #LiDAR #AutonomousVehicles #Robotics #Aerospace #IndustrialTech #SensorRevolution #4DPerception #FMCW #TechStocks #Innovation #SmartMobility
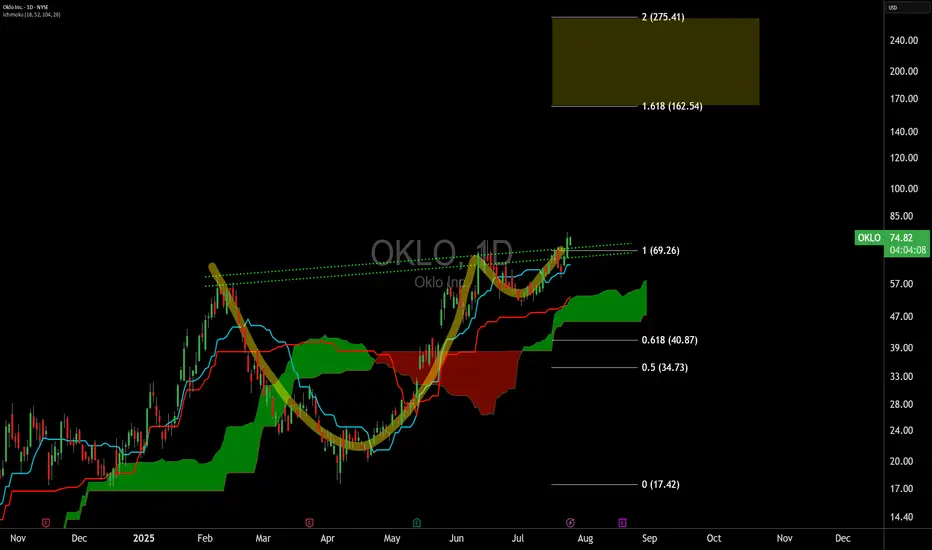
OKLO C&HC&H chart pattern in a hot sector seeing support by the US Government. The intersection of energy, uranium, nuclear, utilities, data centers, the grid, AI, etc.
SL = LL at 58
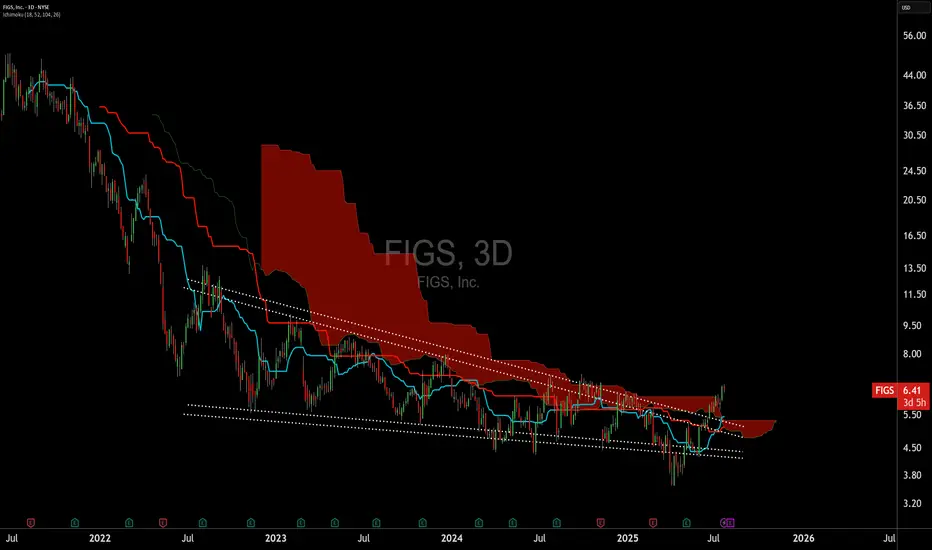
FIGS Approaching Trend ShiftFIGS has NEVER held above the high time frame cloud....until now. Probably at least a 3-6 month idea, gotta give this time to play out after being down only since IPO.
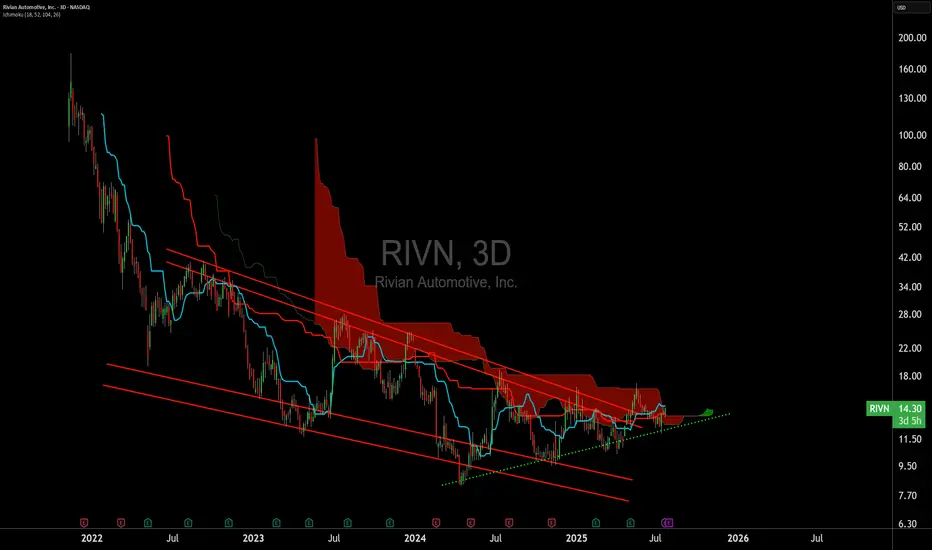
RIVN Approaching Trend ShiftRIVN has NEVER held above the high time frame cloud....until now. Probably at least a 3-6 month idea, gotta give this time to play out after being down only since IPO. Green diag is current SL.
SG Approaching a Potential Trend ShiftPotential trend flip on the SweetGreen Chart for the first time since December 2024. I use a default doubled cloud on the daily timeframe 18/52/104/26. I find this to be superior to the default cloud on both backtesting and forward testing over the past decade on any chart.
Ideal bullish entry conditions occur on the cloud system when all four conditions are met:
Price above cloud
Bullish cloud
Bullish tenkan and kijun cross (TK)
Lagging span above price and above cloud (LS)
The doubled cloud settings are meant to decrease noise and increase signal, because of this I ignore the lagging span entirely and have never used the lagging span for entry criteria. We are approaching sufficient EARLY entry conditions was price enters the daily cloud.
Additionally, SG has one of the cleanest active inverted head and shoulders patterns in the market at the moment.
The target zone is merely based on the 50% retracement of high to low of the multi-month down trend, see: Dow Theory. Additional upside can be seen if the trend remains intact. Trailing stop losses via Williams Fractals and keeping an eye out for bearish divergences are both key to position management for this strategy.
Stop loss considerations for this idea is a combination of price below cloud and new lower lows., in this case below 13. Be mindful of a poor earnings result on Aug 7th could easily trip this SL level.

MRNA Approaching Trend Shift After Multi-Month DeclinePotential trend flip on the Moderna Chart for the first time since May 2024. I use a default doubled cloud on the daily timeframe 18/52/104/26. I find this to be superior to the default cloud on both backtesting and forward testing over the past decade on any chart.
Ideal bullish entry conditions occur on the cloud system when all four conditions are met:
Price above cloud
Bullish cloud
Bullish tenkan and kijun cross (TK)
Lagging span above price and above cloud (LS)
The doubled cloud settings are meant to decrease noise and increase signal, because of this I ignore the lagging span entirely and have never used the lagging span for entry criteria. We are approaching sufficient entry conditions with a bullish kumo breakout (price above cloud) and kumo twist (bullish cloud).
The target zone is merely based on the 50% retracement of high to low of the multi-month down trend, see: Dow Theory. Additional upside can be seen if the trend remains intact. Trailing stop losses via Williams Fractals and keeping an eye out for bearish divergences are both key to position management for this strategy.
Stop loss considerations for this idea is a combination of price below cloud and new lower lows. There is not a strongly defined level here at the moment but 31, 27 and 25 would all be considerations for reduction or closing of the position.
Interesting that this TA setup occurs in the setting of heavy anti-vaccine rhetoric from the current administration as well as severe weakness in the healthcare sector generally.

99% of people buying $NVDA don't understand this:🚨99% of people buying NASDAQ:NVDA don't understand this:
NASDAQ:GOOGL : “We’re boosting AI capex by $10B.”
Wall Street: “Cool, that’s like $1B or 0.06 per share for $NVDA.”
So from $170.50 at the time of news to $170.56 right?
No.
NASDAQ:NVDA trades at 98× earnings. So that $0.06? Turns into $6.00
Why?
Because people are expecting that to be happening every single year for 98 years and they're paying All of it Today in Full amount.
So NASDAQ:NVDA will get $1B more per year. But NASDAQ:NVDA price per share already increased by $100B in past 2 days 😂
Then it crashes 40% and everyone is wondering why.
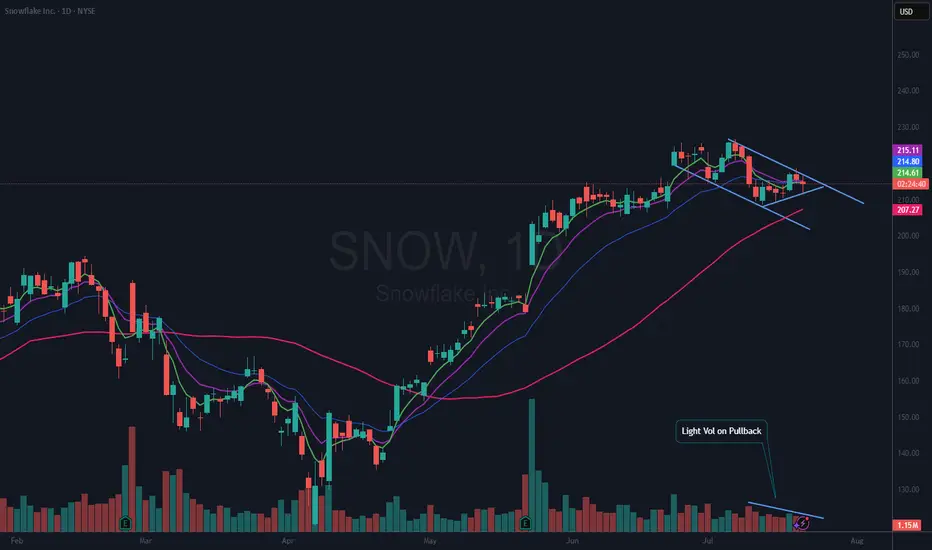
$SNOW Bull Flag?NYSE:SNOW has been and still may be one of the leaders in this market. It is forming a Bull Flag and within that flag is a nice wedging formation.
I am bullish with this name, so I have an alert set on the upper downtrend line. Should it break that, I will look for a good risk reward entry to open a position. It is possible if the market pulls back, that NYSE:SNOW could continue down to test the 50 DMA (red). All TBD.
If you like this idea, please make it your own and follow your trading plan. Remember, it is your money at risk.
In addition, Nvidia NASDAQ:NVDA and Snowflake NYSE:SNOW were among the investors that backed artificial intelligence company Reka's $110 million funding round, Reka said Tuesday.
Reka said the investment will accelerate its technical development efforts and will also scale its multimodal platforms.
The investment boosts the startup's valuation to more than $1 billion from the previous $300 million in a 2023 funding round, Bloomberg reported Tuesday.