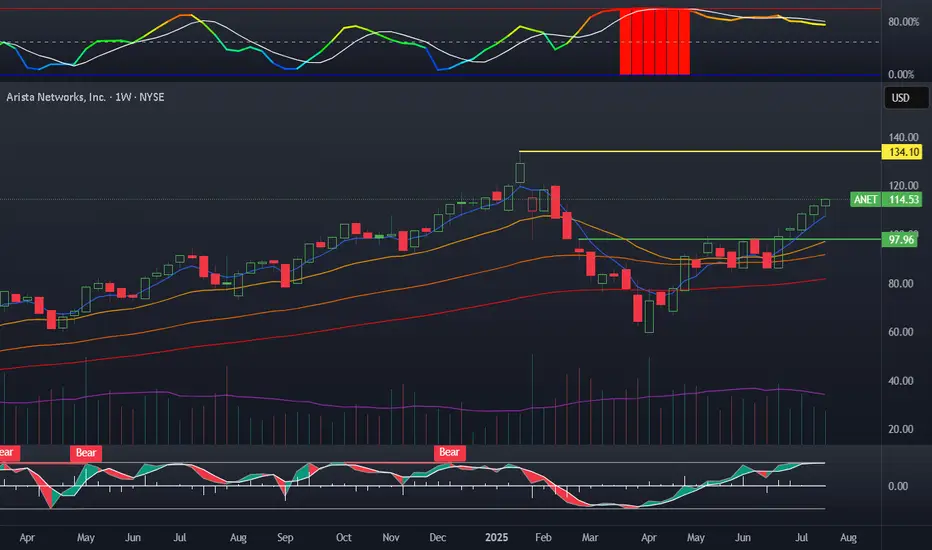
ANET new positionStarted a feeler position in ANET today with 110 shares. Sold a low delta covered call and added a CSP on the monthly a bit lower. I believe this will be the range of interest here. I wanted to slowly diversify a bit away from small caps as I have made a lot on the risk account the last two years. Arista is heavily positioned to benefit from energy, cloud, and Ai expansion and it has some of the best growth financials I have ever seen.
My plan:
Repeat covered calls at a lower delta to capture share appreciation.
Buy 100 more shares if it gets closer to 100 and continue to sell CSP
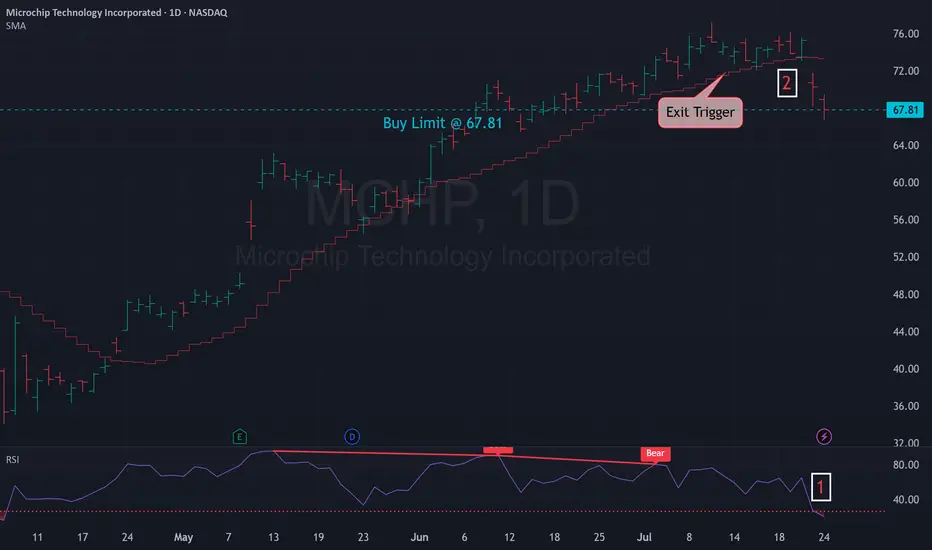
Mean Reversion Trade: MCHP1. RSI in oversold region
2. Price likely to rebound back the the mean
Trade Rules:
Entry Trigger - RSI has cross below oversold region, enter limit buy at close price
Exit Trigger - Close at market when close price cross above exit trigger (Red step line)
COIN 0DTE Trade Breakdown – July 25, 2025
📉 COIN 0DTE Trade Breakdown – July 25, 2025
Put Play or Pass? Let’s break it down 👇
📍 Price: $392.34
🧠 Sentiment: Neutral → Bearish
📊 Call/Put Ratio: 1.08 (Balanced flow)
⚠️ Gamma Risk: HIGH
⌛ Time Decay: Accelerating (0DTE!)
⸻
🎯 TRADE IDEA: 0DTE PUT
✅ Strike: $380.00
💵 Entry Price: $0.69
🎯 Profit Target: $1.00
🛑 Stop Loss: $0.37
📆 Expiration: Today (Jul 25)
📈 Confidence: 65%
📍 Entry Timing: At Open
⸻
⚠️ Why This Trade?
🔻 RSI trending down
🚫 Weak institutional volume
⚠️ High volatility expected from gamma squeeze
🕒 Tick. Tock. Time decay’s your biggest enemy here.
📌 Strategy:
➡️ Naked PUT (speculative short-term play)
⛳ Goal? Quick move → quick exit
⸻
🚨 Risk Warning:
❗ 0DTE = Massive swings
❗ One wrong move = rapid premium decay
❗ Stay nimble. Know your exit.
⸻
💬 Drop a 🔥 if you’re watching COIN today
#OptionsTrading #0DTE #COIN #DayTrading #PutOption #TradingView #StockTok #GammaRisk #TradeSetup

Plugged InIn looking at the money flow for NASDAQ:PLUG , I see the EMAs 8 day and 21 day crossing into a new uptrend. The RSI is still below the overbought territory. The weekly is down with volume pouring in to get ready for the next leg. Sellers are slowing with the MACD. Looking ahead the money in the past has flowed into PLUG in the winter, therefore winter contracts look well priced and primed for the future growth based upon today's information. Let's see where it goes.
Remember do your own due diligence and research. Past performance doesn't equal future performance.

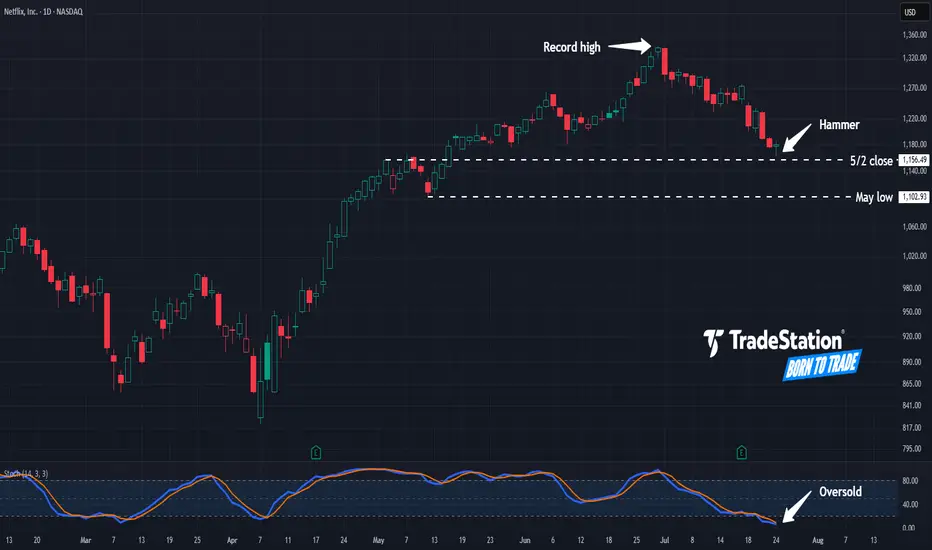
Hammer in NetflixNetflix has pulled back from record highs, and some traders may see potential opportunities in the streaming video giant.
The first pattern on today’s chart is the $1,156.49 level. It was a weekly close on May 2 and near the high the following week. NFLX is now showing signs of potential stabilization near that level. Is new support emerging?
Second, prices hit their lowest level in more than two months yesterday but rebounded. The resulting hammer candlestick pattern may be viewed as a bullish reversal pattern.
Third, stochastics have fallen to oversold territory.
Fourth, if the potential support at $1,156.49 breaks, traders may next eye the May low of $1,102.93.
TradeStation has, for decades, advanced the trading industry, providing access to stocks, options and futures. If you're born to trade, we could be for you. See our Overview for more.
Past performance, whether actual or indicated by historical tests of strategies, is no guarantee of future performance or success. There is a possibility that you may sustain a loss equal to or greater than your entire investment regardless of which asset class you trade (equities, options or futures); therefore, you should not invest or risk money that you cannot afford to lose. Online trading is not suitable for all investors. View the document titled Characteristics and Risks of Standardized Options at www.TradeStation.com . Before trading any asset class, customers must read the relevant risk disclosure statements on www.TradeStation.com . System access and trade placement and execution may be delayed or fail due to market volatility and volume, quote delays, system and software errors, Internet traffic, outages and other factors.
Securities and futures trading is offered to self-directed customers by TradeStation Securities, Inc., a broker-dealer registered with the Securities and Exchange Commission and a futures commission merchant licensed with the Commodity Futures Trading Commission). TradeStation Securities is a member of the Financial Industry Regulatory Authority, the National Futures Association, and a number of exchanges.
Options trading is not suitable for all investors. Your TradeStation Securities’ account application to trade options will be considered and approved or disapproved based on all relevant factors, including your trading experience. See www.TradeStation.com . Visit www.TradeStation.com for full details on the costs and fees associated with options.
Margin trading involves risks, and it is important that you fully understand those risks before trading on margin. The Margin Disclosure Statement outlines many of those risks, including that you can lose more funds than you deposit in your margin account; your brokerage firm can force the sale of securities in your account; your brokerage firm can sell your securities without contacting you; and you are not entitled to an extension of time on a margin call. Review the Margin Disclosure Statement at www.TradeStation.com .
TradeStation Securities, Inc. and TradeStation Technologies, Inc. are each wholly owned subsidiaries of TradeStation Group, Inc., both operating, and providing products and services, under the TradeStation brand and trademark. When applying for, or purchasing, accounts, subscriptions, products and services, it is important that you know which company you will be dealing with. Visit www.TradeStation.com for further important information explaining what this means.
COUR ready to launch?Incredible chart and breakout approaching,
Above $12 we can see $16 in a few months, This can be a great addition to the long term account!
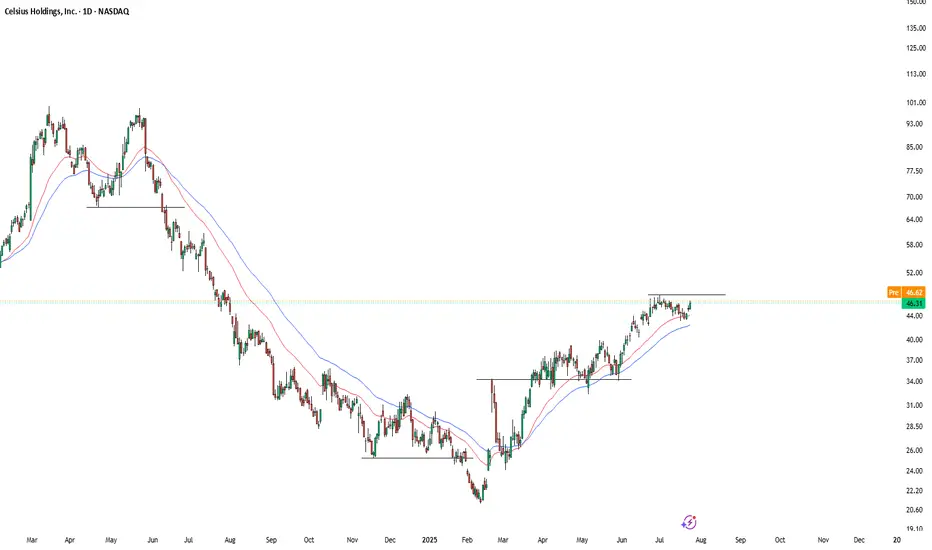
CELH Eyes Upside Momentum as Consolidation TightensCelsius Holdings, Inc. ( NASDAQ:CELH ) has shown a notable recovery from its early 2025 lows, steadily climbing and recently consolidating around the $46 level. The stock is currently trading above both the short-term (red) and mid-term (blue) moving averages, which are sloping upward—indicating bullish momentum.
The recent price action reveals a tight consolidation just below the previous local highs around $47–$48. If CELH can decisively break above this resistance zone with increased volume, it may trigger a short-term breakout and open room toward the $52–$55 range, even $60.
Conversely, if the stock fails to break above resistance and falls below the $43–$44 support area (near the moving averages), it could trigger a short pullback toward the $40 level.
Key Levels to Watch:
Resistance: $47.50–$48.00
Support: $43.00–$44.00
Breakout Target: $52.00–$55.00 / extended $60
Momentum remains positive, but confirmation through volume and follow-through price action is essential for any breakout to sustain.
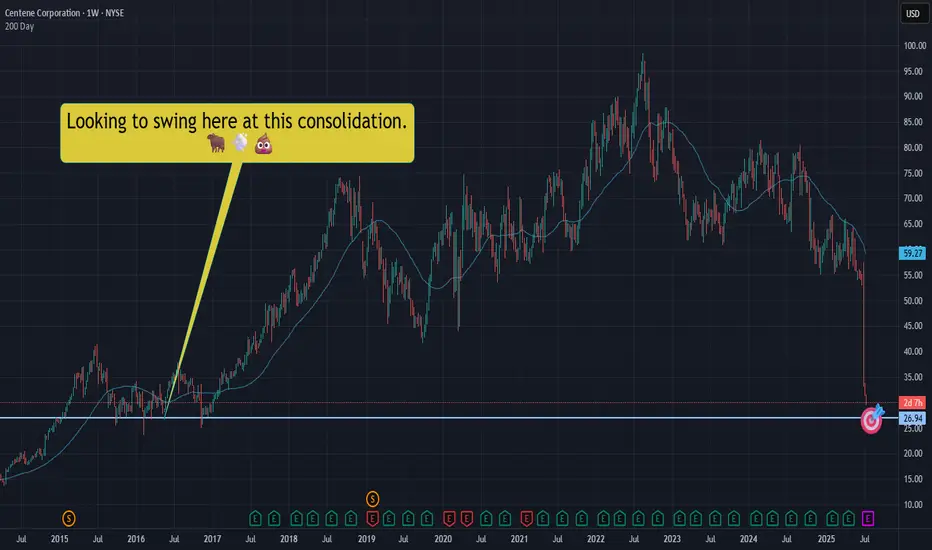
CNC|Let's take a swing at a falling dagger! NYSE:CNC slicing through the void, well.... like a falling dagger through a void.
Not trying to catch this bad boi, but we should expect a bounce at some point. Let's swing for a bounce in that $26.90ish area.
This is NOT a YOLO and I hope it's not an "oh no!" Let's keep our wits about us - starter position only. We can add if we need to, but let's just hope we sell and make some quick Christmas money.
THANK YOU FOR YOUR ATTENTION ON THIS MATTER
St. Joe Company (The) (JOE) Builds Florida CommunitiesSt. Joe Company (The) (JOE) is a real estate development and management firm focused on Northwest Florida. The company develops residential communities, commercial properties, resorts, and industrial parks, often in high-growth, coastal markets. St. Joe’s growth is driven by migration to Florida, rising housing demand, and its large land holdings that offer long-term development potential in desirable regions.
On the chart, a confirmation bar with rising volume indicates strong buying interest. The price has entered the momentum zone by moving above the .236 Fibonacci level. A trailing stop can be placed just below that level using the Fibonacci snap tool to manage risk while capturing continued upside.

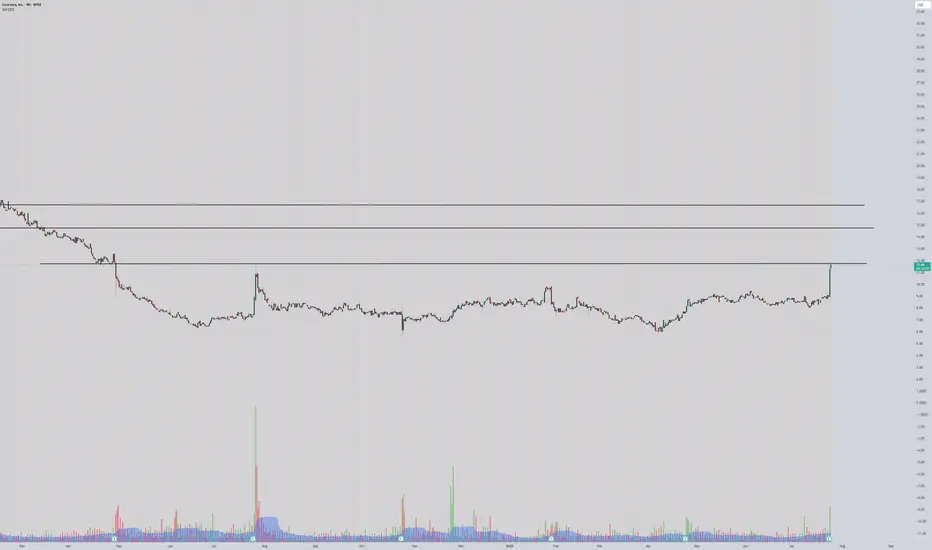
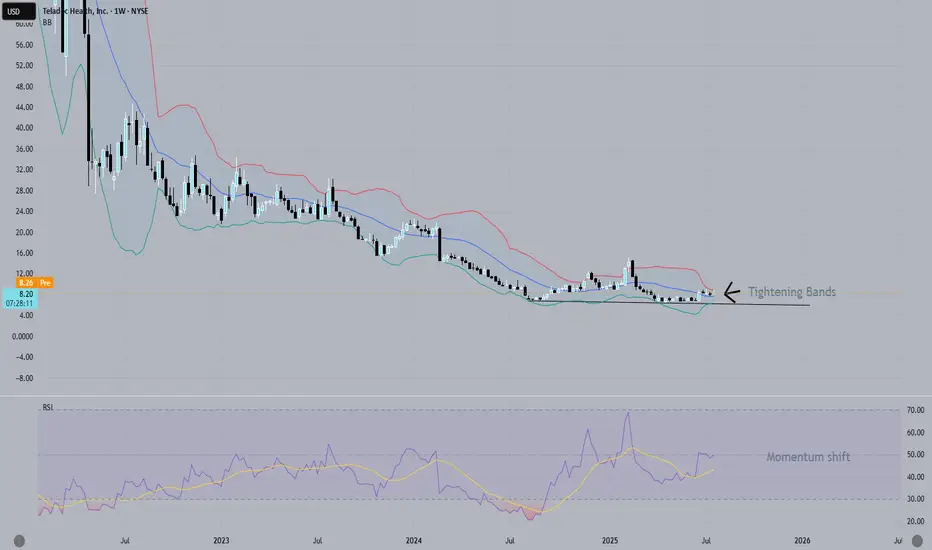
Buy z dips doctorTeladoc (TDOC) looks like a classic turnaround setup — high risk, but with meaningful upside if execution plays out. The stock is trading around $8 after a brutal drawdown, pricing in a lot of pessimism. But under new leadership, Teladoc is aggressively cutting costs, improving free cash flow, and refocusing on its Integrated Care segment while stabilizing the underperforming BetterHelp unit. Recent acquisitions (Catapult, UpLift) support this shift toward more integrated, network-based services.
Technically, the setup is compelling: Bollinger Bands are tightening and there’s a divergence forming — both early signals of a potential breakout or reversal. If the company can continue delivering on margin improvement and steadying revenue, the market may start to rerate the story. Execution is key, but at these levels, it could offer deep-value exposure to a recovering digital health player.
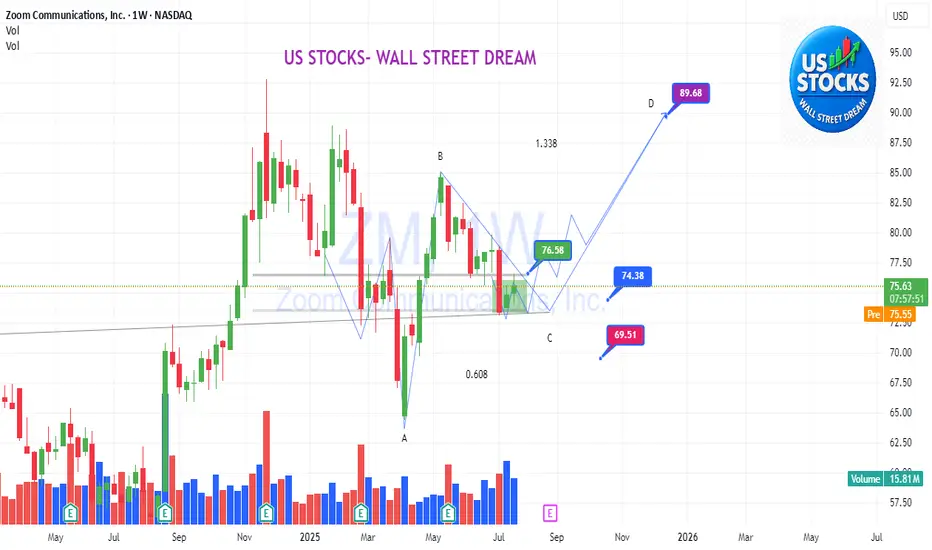
ZM: Right timing to enter the plan?Do you know the right timing to enter the plan?
.
Beautiful quasimodo accummulation pattern.
ACBD pattern.
Keep watching and timing when ZM will run?
.
US STOCKS- WALL STREET DREAM- LET' S THE MARKET SPEAK!
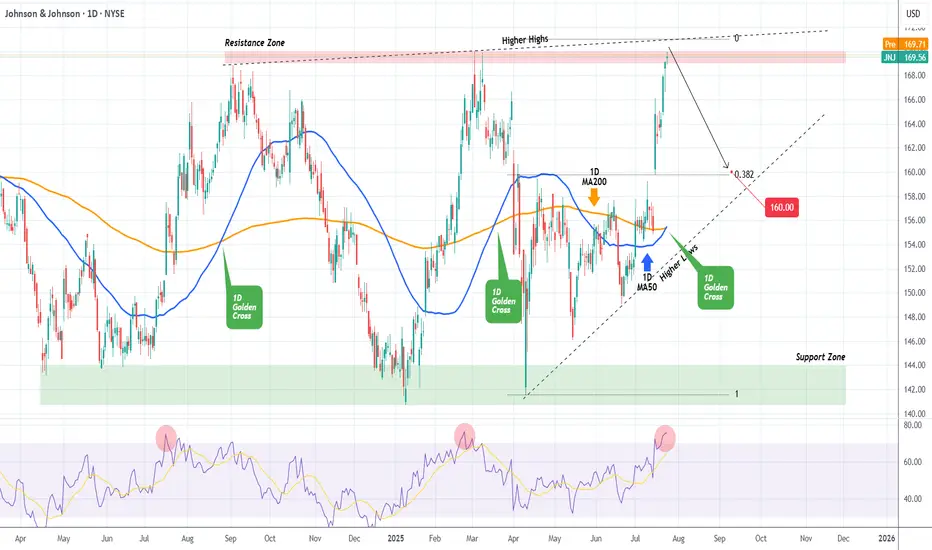
JOHNSON & JOHNSON Sell opportunity on a Double Resistance.It's been 9 months (October 11 2024, see chart below) since our last Johnson & Johnson (JNJ) analysis, where we gave a very timely sell signal that surgically hit our $141.00 Target:
The Channel Down has since broke to the upside and a new Higher Lows structure has emerged but with a clear Resistance Zone for the time being. At the same time, the price is also just below the Higher Highs trend-line that started on the September 04 2024 High.
With the 1D RSI overbought (same as on February 25 2025), we don't give the upside much room to go, so we turn bearish here, targeting the 0.382 Fibonacci extension and Higher Lows trend-line at $160.00.
-------------------------------------------------------------------------------
** Please LIKE 👍, FOLLOW ✅, SHARE 🙌 and COMMENT ✍ if you enjoy this idea! Also share your ideas and charts in the comments section below! This is best way to keep it relevant, support us, keep the content here free and allow the idea to reach as many people as possible. **
-------------------------------------------------------------------------------
💸💸💸💸💸💸
👇 👇 👇 👇 👇 👇
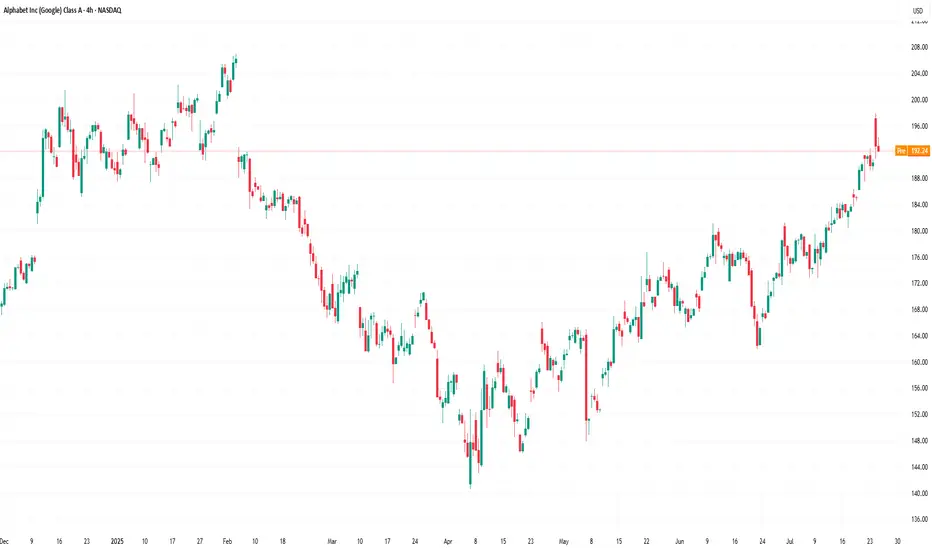
Alphabet (GOOGL) Stock Chart Analysis Following Earnings ReleaseAlphabet (GOOGL) Stock Chart Analysis Following Earnings Release
Earlier this week, we highlighted the prevailing bullish sentiment in the market ahead of Alphabet’s (GOOGL) earnings report, noting that:
→ an ascending channel had formed;
→ the psychological resistance level at $200 was of particular importance.
The earnings release confirmed the market’s optimism, as the company reported better-than-expected profits, driven by strong performance in both its advertising and cloud segments.
In his statement, CEO Sundar Pichai noted that AI is positively impacting all areas of the business, delivering strong momentum.
The company is expected to allocate $75 billion this year to expand its AI capabilities.
As a result, Alphabet (GOOGL) opened yesterday’s trading session with a bullish gap (as indicated by the arrow). However, as the session progressed, the price declined significantly, fully closing the gap.
This suggests that:
→ the bulls failed to consolidate their gains, allowing the bears to seize the initiative;
→ the ascending channel remains valid, with yesterday’s peak testing its upper boundary;
→ such price action near the $200 level reinforces expectations that this psychological mark will continue to act as resistance.
It is possible that the positive sentiment following the earnings report may weaken in the near term. Accordingly, traders may consider a scenario in which Alphabet’s (GOOGL) share price retraces deeper into the existing ascending channel. In this case, the former resistance levels at $180 and $184 may serve as a support zone.
This article represents the opinion of the Companies operating under the FXOpen brand only. It is not to be construed as an offer, solicitation, or recommendation with respect to products and services provided by the Companies operating under the FXOpen brand, nor is it to be considered financial advice.
Looking like an immediate buy on IBM! OptionsMastery:
🔉Sound on!🔉
📣Make sure to watch fullscreen!📣
Thank you as always for watching my videos. I hope that you learned something very educational! Please feel free to like, share, and comment on this post. Remember only risk what you are willing to lose. Trading is very risky but it can change your life!

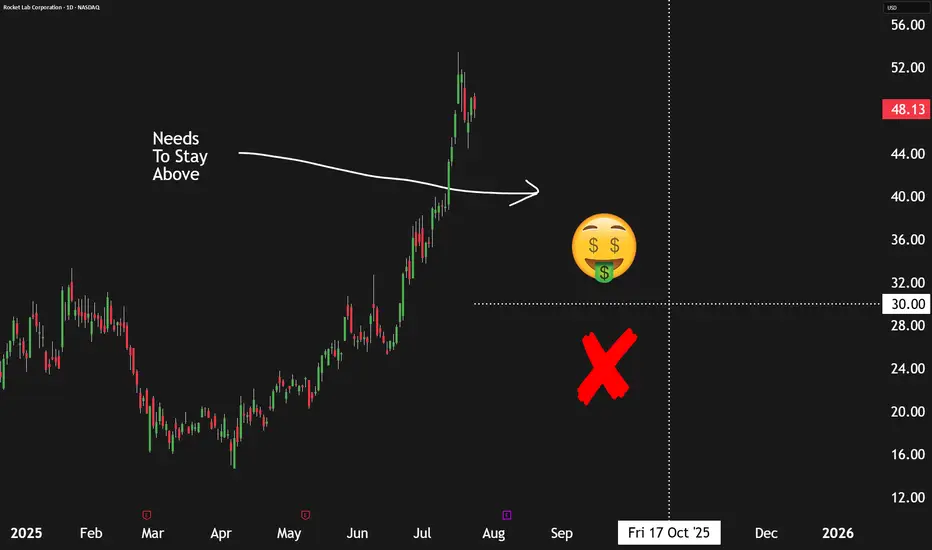
How We're Earning A 13%+ Yield Selling Puts On Rocket LabThe commercial space sector is booming, and Rocket Lab NASDAQ:RKLB stands out as one of the most promising players—not just another speculative startup or space tourism hype. But while the company is making strong operational strides, its stock valuation appears stretched, prompting a more strategic approach to investing.
📈 Strong Execution, Growing Opportunity
Rocket Lab continues to hit meaningful milestones. In Q1, the company:
Secured a U.S. Space Force contract for its upcoming Neutron heavy-lift rocket.
Won hypersonic-related contracts with the U.S. Air Force and the U.K. Ministry of Defense.
Successfully completed five Electron rocket launches and booked eight more.
Made a strategic acquisition for developing "Flatellites," enhancing vertical integration.
Revenue rose 32% year-over-year, with gross margins in the mid-30% range. Importantly, Rocket Lab has a $1 billion+ revenue backlog, with over half expected to convert in the next year, and a healthy mix of government and commercial clients across both its Launch and Space Systems divisions.
💰 Valuation: Big Potential, Bigger Price Tag
Rocket Lab's business is solid, but its valuation raises red flags. With a price-to-sales ratio near 55x (compared to SpaceX's ~14x), investors are paying a steep premium for future success. The company is still unprofitable, and the high valuation leaves little room for error. Simply put, the market may be rewarding Rocket Lab too early.
📊 The Smarter Move: Sell Put Options
Instead of buying shares at inflated levels, the better approach is to sell put options—a strategy that earns upfront cash and offers the opportunity to buy shares at a discount if the stock drops.
Recommended trade:
Sell October 17th $30 strike put options
Premium: ~$96 per contract
Required buying power: ~$2,904
Implied return: ~3.3% over 90 days, or ~13.4% annualized
This provides income now, while still giving investors potential exposure to Rocket Lab at a 40% discount to current prices.
⚠️ Risks to Consider
This isn’t risk-free. If Rocket Lab’s execution falters—especially with Neutron—shares could drop sharply. Selling puts means you may still be forced to buy at $30, even if the stock falls much lower. This strategy works best for investors comfortable owning RKLB long term at a lower entry price.
✅ Bottom Line
Rocket Lab is a strong business, but the stock looks overheated. Selling put options offers a more balanced way to participate in its growth story—earning income now while positioning to buy the stock later at a better value.
Rating: Buy (via options strategy)
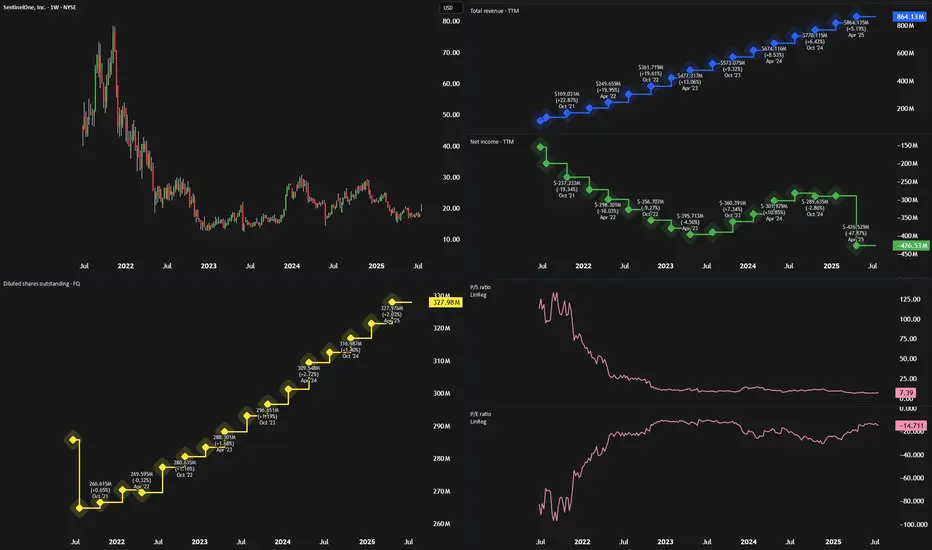
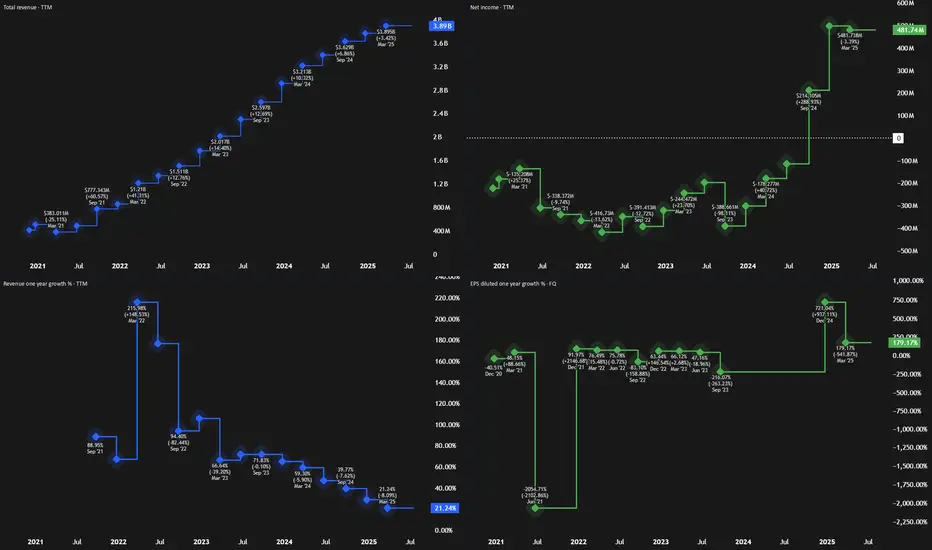
SentinelOne Looks Like Palantir Before The BreakoutIn every market cycle, some high-growth companies are misunderstood—until they aren’t. Palantir (PLTR) was one such stock, dismissed early for its lack of profitability and complex model, only to soar when its AI tools gained traction. Now, SentinelOne (NYSE: S) may be next in line.
🧠 What SentinelOne Does
SentinelOne is a top-tier cybersecurity firm offering an AI-powered endpoint protection platform called Singularity. Like Palantir, SentinelOne has faced criticism for:
Persistent losses
High stock-based compensation (SBC)
A misunderstood business model
Despite this, its technology is sticky, deeply embedded in client IT systems, and well-positioned to ride macro trends in AI and cybersecurity.
📈 Financials: Turning a Corner
While the stock hasn’t moved much in two years, trading around $18, SentinelOne’s fundamentals are improving:
Revenue Growth: Double-digit YoY revenue growth (23%+ in each of the last 10 quarters)
Free Cash Flow: $214 million in the past 12 months (~25% FCF margin)
Gross Margins: High and improving
Operating Expenses: Slowing, creating operating leverage
Adjusted Earnings: Near breakeven, signaling profitability is in reach
These trends mirror Palantir’s path before its breakout, particularly the shift from high OpEx to better margins and rising free cash flow.
💰 Valuation: Still Underrated
SentinelOne is trading at only 6x sales and 27x free cash flow, despite:
Strong 20%+ expected revenue growth
Analyst EPS estimates of ~$0.50 by 2028
A market cap under $6 billion
It’s significantly cheaper than peers like CrowdStrike and Palo Alto Networks—despite having similar growth and margin profiles.
⚠️ Risks to Consider
Fierce Competition: Cybersecurity is a crowded field. SentinelOne will have to keep innovating to stay relevant.
Market Sentiment: As a high-growth name, it may be hit hard in downturns.
Limited TAM vs. PLTR: The cybersecurity market isn’t as vast as AI data platforms.
🚀 Final Take
With strong recurring revenue, improving profitability, and an attractive valuation, SentinelOne looks poised for a re-rating. While it may not match Palantir’s scale or splash, the setup is strikingly similar.
Rating: Strong Buy
Why We See 100%+ Upside In SoFi Over The Next 3 YearsAfter soaring to nearly $28 per share during the SPAC-fueled fintech boom in 2021, SoFi Technologies (SOFI) crashed back to earth, trading under $5 as rising interest rates, regulatory headwinds, and lack of profitability dimmed investor optimism. But the tide has turned.
Over the past year, SoFi has reshaped its business and posted significant growth. Shares are now up 247% since our previous bullish call at $6. With the company now profitable and diversifying revenue, we'd argue there’s still upside ahead.
💼 A Stronger, Diversified Business
SoFi has evolved from a student loan-focused lender into a full-spectrum fintech platform. It now operates across:
Lending: $413M in Q1 revenue
Financial Services (consumer banking): $303M
Technology Platform (B2B): $103M
While lending still makes up the majority, the tech and services segments are growing fast—especially financial services, which doubled revenue YoY and tripled profit. SoFi's white-label platform also gives it a SaaS-like recurring revenue profile.
Q1 results showed:
Revenue: $770M (+33% YoY)
EPS: $0.06, with a $31M revenue beat
This business mix gives SoFi more stability and better scalability than many traditional financial firms.
💰 Valuation: Pricey vs. Banks, Cheap vs. Fintech
Critics point to SoFi’s rich valuation—trading at over 8x sales—as a concern. But when compared to other fintechs like NuBank (12x sales) and Robinhood (28x), SoFi looks much more reasonably priced.
On a forward earnings basis, SoFi trades at ~32x GAAP EPS, and if growth continues, this could drop below 30x. That’s appealing for a company expected to grow:
Revenue: ~25% annually
Net income: ~33% annually
By 2027, analysts project $1B in operating income, double today’s figure. If SoFi maintains current valuation multiples, this alone could double the stock in 3 years.
⚠️ Risks to Watch
Regulatory scrutiny in the financial sector
Cyclicality of consumer lending
Intense competition from firms like Robinhood, Chime, and Coinbase
Despite these challenges, SoFi’s expanding ecosystem and growing brand strength position it well.
✅ Final Take: Still a 'Strong Buy'
With accelerating revenue, expanding margins, and a scalable business model, SoFi has moved beyond its hype-fueled origins and is now a real fintech contender. Even after its rally, its valuation still leaves room for meaningful upside.
Rating: Strong Buy
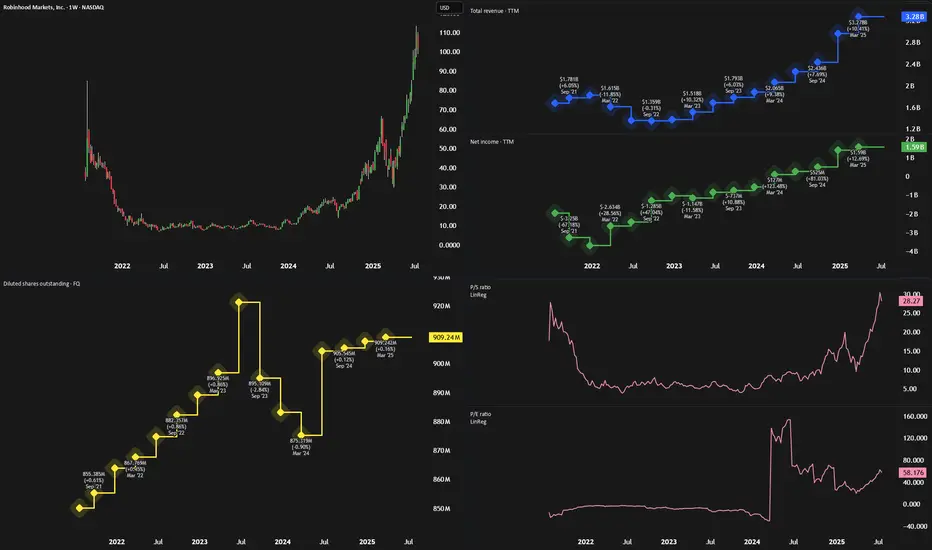
Everyone's Bullish On Robinhood - But Its Time To SellRobinhood NASDAQ:HOOD has seen an incredible rally over the past year, rising more than 500% since August 2023. Much of this surge has been driven by renewed crypto enthusiasm—sparked by Circle’s IPO—and Robinhood’s aggressive push into new products across fintech and crypto.
But despite strong financial performance, we now believe the stock has run too far, too fast.
💰 Strong Fundamentals, But Slowing Growth
Robinhood’s recent financials are undeniably impressive:
Trailing 12-month revenue: $3.27B (up ~60% YoY)
Net income: $1.59B
Operating income: $1.2B
Revenue from commissions and interest income has outpaced expenses, resulting in high margins. But looking ahead, earnings-per-share (EPS) growth is expected to slow. Analysts forecast mid-teens EPS growth in 2026 and 2027, with a potential dip this year as one-time tax benefits roll off.
Robinhood Gold, the company’s premium service, is growing steadily (ARR projected to top $250M this year), but it’s still a small slice of total revenue.
🛠️ Product Expansion or Strategy Drift?
Robinhood is launching a wide array of new offerings—from robo-advisors and AI tools to crypto products in Europe and futures trading in the U.S.
The issue? These launches feel disjointed. U.S. users get a full-featured experience with stocks, options, crypto, and banking tools. UK users are limited to U.S. stock trading, with balances held in USD. In Europe, Robinhood leans heavily into crypto.
While the company claims it’s building a “global financial ecosystem,” the rollout has been inconsistent and confusing. This scattered approach may dilute brand clarity and user trust.
📊 Valuation: Sky-High and Hard to Justify
At current prices, HOOD trades at:
26x revenue
54x trailing earnings
74x forward earnings
At over 45x FY3 earnings, higher than fintech peers like SoFi (29x), Etoro (20x), and Interactive Brokers (27x)
The only comparable valuation is Coinbase (COIN), which has a more dominant position in crypto and stronger institutional traction. Given that most of HOOD’s revenue still comes from traditional brokerage services, this crypto-fueled valuation seems overblown.
🚨 Bottom Line
Robinhood remains a promising long-term company, but its stock looks overheated. Slowing earnings growth, a scattered international strategy, and a sky-high valuation point to limited upside from here.
Verdict: Sell
Investors sitting on big gains may want to take some profits while the euphoria lasts.
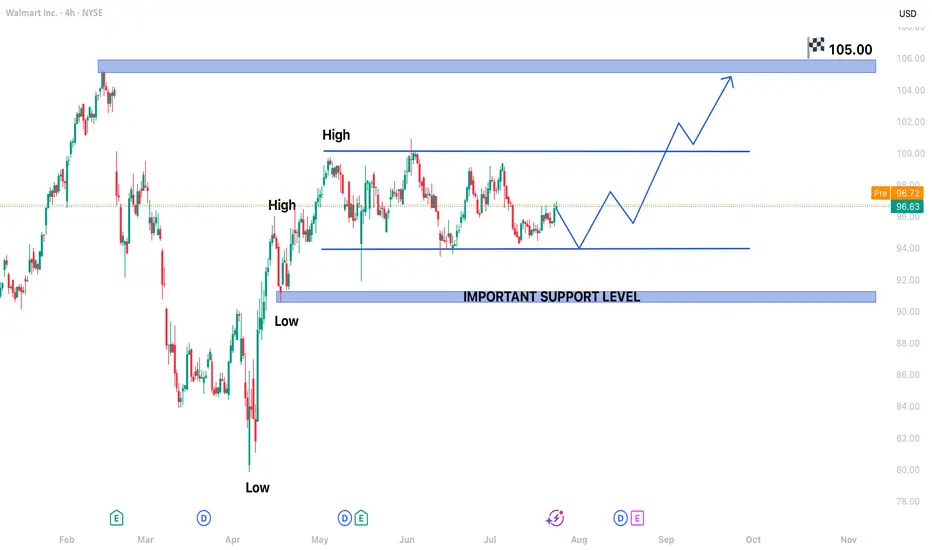
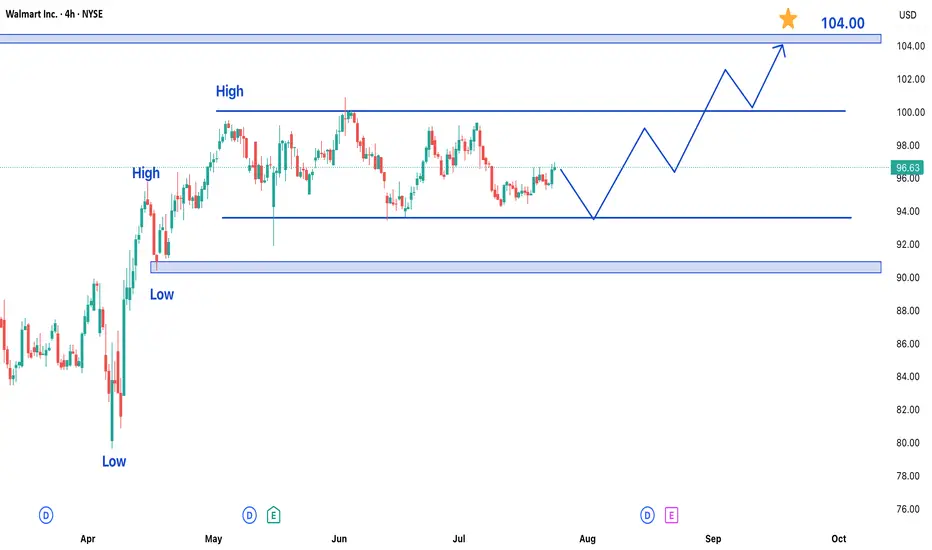
Walmart Stock Trading in Bullish Trend - Upside Potential AheadWalmart Inc. (WMT) shares are currently exhibiting a bullish trend, maintaining upward momentum over recent trading sessions. While the stock has been consolidating in a range over the past few days, the broader outlook remains positive, suggesting potential for further gains in upcoming sessions.
Key Observations:
- Established Uptrend: Walmart's price action reflects sustained buying interest, keeping the stock in a bullish phase.
- Range-Bound Consolidation: Recent sideways movement indicates a temporary pause, often a precursor to the next directional move.
- Strong Support & Resistance Levels: The stock has formed clear reference points for traders to watch.
Price Projections:
- Upside Target at $105: A breakout above the current range could propel WMT toward the $105 resistance level, representing a significant upside opportunity.
- Key Support at $90: On the downside, the $90 level has emerged as a strong support zone. Any pullback is likely to find buying interest near this area.
Market Implications:
1. Bullish Continuation Likely: The consolidation within an uptrend typically resolves in the direction of the prevailing trend—in this case, upward.
2. Breakout Potential: A decisive move above the recent range high could accelerate buying momentum toward $105.
3. Risk Management Consideration: While the bias is bullish, a drop below $90 would signal weakening momentum and potentially invalidate the near-term upside scenario.
Trading Strategy:
- Entry: Consider long positions on a confirmed breakout above the range, or on dips near $90 support.
- Stop Loss: A close below $90 would suggest a trend reversal, warranting exit from bullish positions.
- Target: $105 serves as the primary upside objective, with interim resistance levels to monitor along the way.
Final Thoughts:
Walmart’s stock appears poised for further gains, with $105 as the next key target. Traders should watch for a breakout from the current range while keeping an eye on the $90 support level for risk management. As always, confirmation through price action and volume will be crucial for validating the bullish thesis.
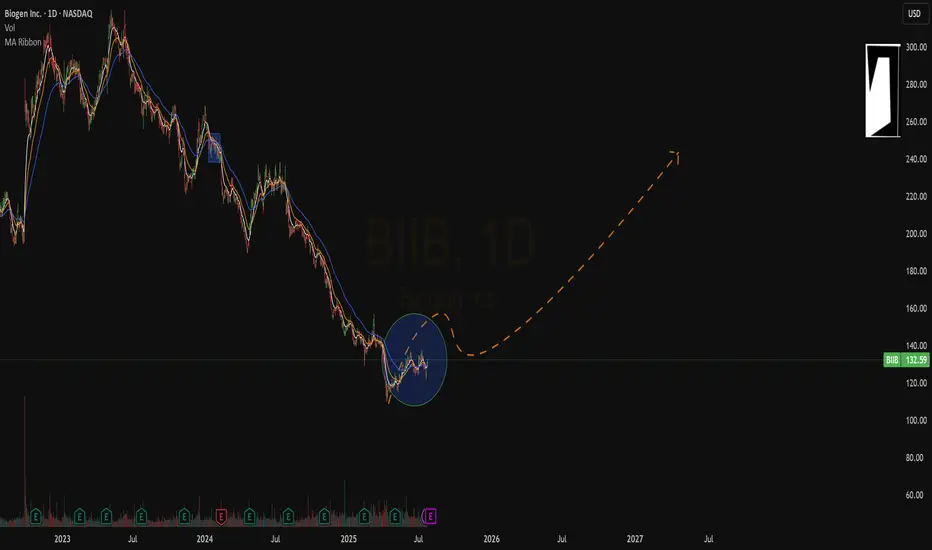
Quick View : $BIIBThe daily chart looks really good.
Another bullish alert at the end of this crazy downtrend.
Box on the go with flat EMAs.
Earnings coming that may work as catalyst.
Ready to Catch
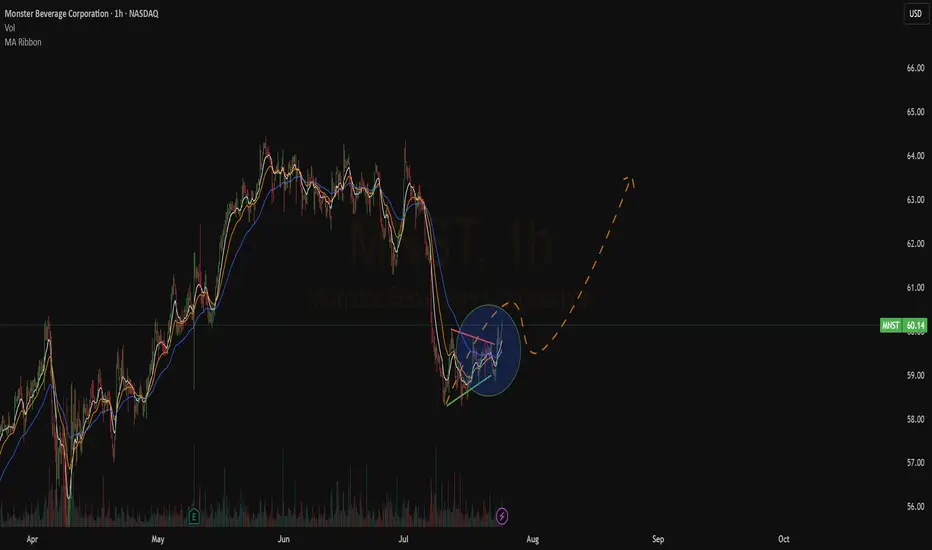
Quick View : MNSTThe hourly chart sees a very interesting Price-Action with the help of our Bullish ATR Breakout.
Bullish Crossover is confirmed, there is a huge space for a move upside
Ready To Catch It
Walmart Stock Trading in Bullish Trend – Upside Potential AheadWalmart Inc. (WMT) shares are currently exhibiting a bullish trend, maintaining upward momentum over recent trading sessions. While the stock has been consolidating in a range over the past few days, the broader outlook remains positive, suggesting potential for further gains in upcoming sessions.
Key Observations:
- Established Uptrend: Walmart's price action reflects sustained buying interest, keeping the stock in a bullish phase.
- Range-Bound Consolidation: Recent sideways movement indicates a temporary pause, often a precursor to the next directional move.
- Strong Support & Resistance Levels: The stock has formed clear reference points for traders to watch.
Price Projections:
- Upside Target at $105: A breakout above the current range could propel WMT toward the $105 resistance level, representing a significant upside opportunity.
- Key Support at $90: On the downside, the $90 level has emerged as a strong support zone. Any pullback is likely to find buying interest near this area.
Market Implications:
1. Bullish Continuation Likely: The consolidation within an uptrend typically resolves in the direction of the prevailing trend—in this case, upward.
2. Breakout Potential: A decisive move above the recent range high could accelerate buying momentum toward $105.
3. Risk Management Consideration: While the bias is bullish, a drop below $90 would signal weakening momentum and potentially invalidate the near-term upside scenario.
Trading Strategy:
- Entry: Consider long positions on a confirmed breakout above the range, or on dips near $90 support.
- Stop Loss: A close below $90 would suggest a trend reversal, warranting exit from bullish positions.
- Target: $105 serves as the primary upside objective, with interim resistance levels to monitor along the way.
Final Thoughts:
Walmart’s stock appears poised for further gains, with $105 as the next key target. Traders should watch for a breakout from the current range while keeping an eye on the $90 support level for risk management. As always, confirmation through price action and volume will be crucial for validating the bullish thesis.
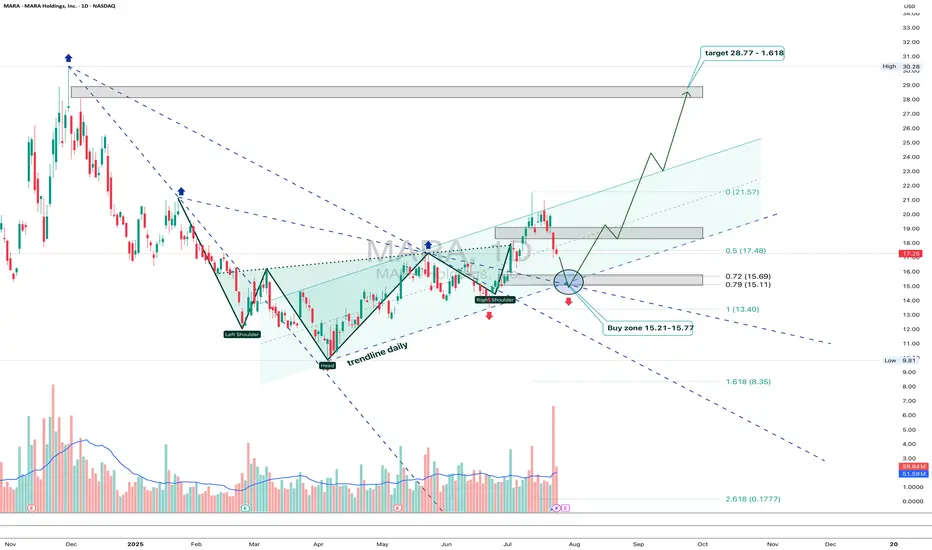
MARA: shoulders done, now walk toward the targetOn the daily chart, MARA completed a textbook inverse Head & Shoulders reversal with a clear breakout above the descending trendline. A corrective pullback followed, and the price is now heading into the key buy zone at 15.21–15.77 - aligning with the 0.72 and 0.79 Fibonacci retracements, and the upper boundary of the broken channel. This is the area to watch for a potential continuation of the bullish impulse.
Volume on the breakout was above average, confirming strong buyer interest. The EMAs are trending below the price, supporting the upward structure. The first target is located at 21.57 (previous resistance), with a potential extension to 28.77 (Fibonacci 1.618).
Fundamentally, MARA remains highly correlated with BTC and crypto sentiment. As interest returns to crypto-related assets due to ETF flows and possible Fed easing, mining stocks like MARA gain attention. Recent reports also show improved production efficiency and lowered costs - a tailwind for bulls.
Tactically, the best setup would be a confirmed reaction from the buy zone — whether a strong candlestick formation, volume surge, or reclaim of a key level. If that happens, aiming for 21.57 and 28.77 becomes a solid plan.
The pattern played out - now it's time for the market to walk the talk.