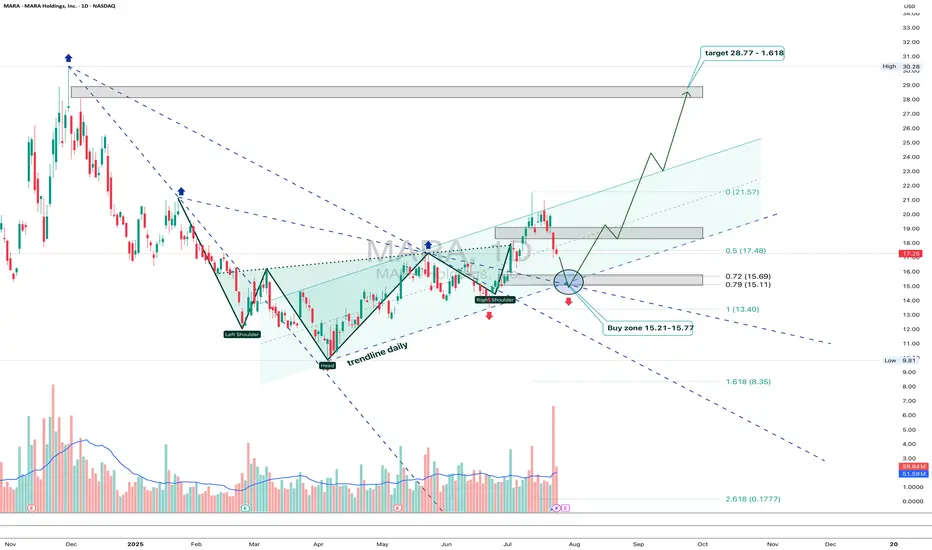
MARA: shoulders done, now walk toward the targetOn the daily chart, MARA completed a textbook inverse Head & Shoulders reversal with a clear breakout above the descending trendline. A corrective pullback followed, and the price is now heading into the key buy zone at 15.21–15.77 - aligning with the 0.72 and 0.79 Fibonacci retracements, and the upper boundary of the broken channel. This is the area to watch for a potential continuation of the bullish impulse.
Volume on the breakout was above average, confirming strong buyer interest. The EMAs are trending below the price, supporting the upward structure. The first target is located at 21.57 (previous resistance), with a potential extension to 28.77 (Fibonacci 1.618).
Fundamentally, MARA remains highly correlated with BTC and crypto sentiment. As interest returns to crypto-related assets due to ETF flows and possible Fed easing, mining stocks like MARA gain attention. Recent reports also show improved production efficiency and lowered costs - a tailwind for bulls.
Tactically, the best setup would be a confirmed reaction from the buy zone — whether a strong candlestick formation, volume surge, or reclaim of a key level. If that happens, aiming for 21.57 and 28.77 becomes a solid plan.
The pattern played out - now it's time for the market to walk the talk.
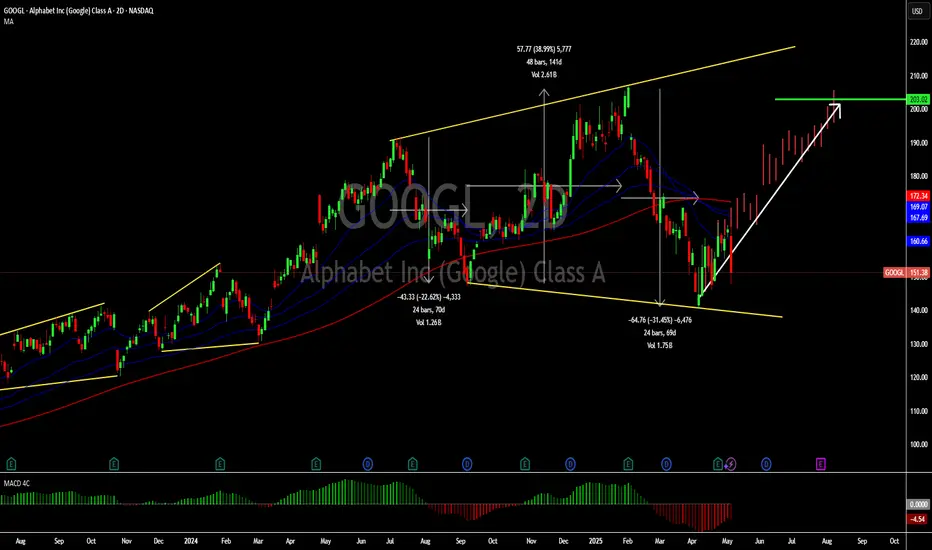
Google: A compelling buy at the current priceHello,
As Warren Buffett famously said, "Be fearful when others are greedy, and greedy when others are fearful." This mindset is particularly relevant right now with Alphabet Inc.
Despite being a company whose products we use daily—and will likely rely on even more in the future—Alphabet's stock recently declined following comments from Apple’s Eddie Cue regarding a drop in Safari search traffic. This has sparked concerns about Google's dominance in search and its ad revenue streams. Analysts are also highlighting growing competition from AI-driven platforms such as OpenAI, Grok, and Perplexity, raising questions about the future growth of Google Search.
While the headlines may seem discouraging, we remain confident in Google’s enduring leadership in the search space, underpinned by its unmatched scale, infrastructure, and user base. We also believe the market continues to underestimate how far ahead Google truly is in artificial intelligence.
In our view, this dip represents a strategic buying opportunity for long-term investors. Below is our in-depth analysis of Alphabet and why we believe it remains a strong investment.
Alphabet, Inc is a holding company, which engages in the business of acquisition and operation of different companies. Google Services includes products and services such as ads, Android, Chrome, devices, Google Maps, Google Play, Search, and YouTube. Google Services generates revenues primarily from advertising; fees received for consumer subscription-based products such as YouTube TV, YouTube Music and Premium, and NFL Sunday Ticket, as well as Google One; the sale of apps and in-app purchases and devices.
KEY NOTES FROM THE Q1 2025 EARNINGS CALL
Revenue up to $ 90.23 Billion (Q1 2024: $ 80.54 Billion)
Operating income for quarter one 2025 at $ 30.61 Billion (Q1 2024: $ 25.47 Billion)
Net income for quarter one 2025 at $ 34.54 Billion (Q1 2024: $ 23.66 Billion)
Diluted Earnings per share closed at $ 2.81 as at 31st March 2025 (2024: $ 1.89). Alphabet’s Board of Directors declared a quarterly cash dividend of $0.21 representing a 5% increase from the previous quarterly dividend of $0.20.
Cash and cash equivalents remained flat as of the end of March 31 2025 at $ 23.26 Billion (2024: $ 23.47 Billion)
Google advertising continues to do the heavy lifting for the alphabet business contributing $ 66.89 Billion of the total $90.23 Billion. Google Services includes products and services such as ads, Android, Chrome, devices, Google Maps, Google Play, Search, and YouTube. Of this amount, the breakdown is as below
•Google search & other: $ 50.70 Billion
•Youtube ads: $ 8.93 Billion
•Google Network: $ 7.26 Billion
Other services offered by the platforms contributed revenues as below
Google subscriptions, platforms & devices: $ 10.38 Billion
Google cloud: $ 12.26 Billion
Other bets: $ 450 million. Other Bets is a combination of multiple operating segments that are not individually material.
Hedging gains: $ 260 million
The company announced a share buyback program of up to $70 billion of its class A and class C shares. The buy backs will be executed through open market purchases or through privately negotiated transactions.
Business Opportunities/Strengths
Alphabet’s advertising business is firmly embedded in digital advertising budgets, allowing it to capitalize on the ongoing growth in digital ad spending.
The significant cash flows from advertising enable Alphabet to reinvest in growth areas like Google Cloud, AI-enhanced search, and innovative ventures such as Waymo. (Waymo is Alphabet's autonomous driving technology subsidiary, focused on developing self-driving cars and related technologies.)
With a strong foothold in the public cloud market, Alphabet has a substantial opportunity as a major provider for enterprises transitioning to digital platforms.
Risks to consider
Although Alphabet is working to diversify, text-based advertising remains its primary revenue source, presenting a concentration risk.
Ongoing investments in emerging, sometimes unproven technologies through its Other Bets segment continue to strain cash flows.
Increasing regulatory scrutiny of Alphabet's search dominance worldwide could lead to significant market disruptions through structural reforms.
Recommendation
We view Alphabet as a solid business with diverse solutions ranging from advertising, cloud business and driverless cars as well. While we acknowledge that the antitrust cases have continued to make headlines, we encourage investors to remain invested and focused on the business’s strengths. The business has unique products that will have the ability to remain leaders for a very long period of time. Android is the operating system for the majority of the world’s smartphones with more than two-thirds of all smartphones in the world running it. Virtually all smartphones, other than those manufactured by Apple, run on Android. We see this remaining as a google strength for a very long time. The Google Play Store’s unmatched ecosystem creates significant barriers for competing operating systems, limiting their access to critical applications. The recent correction on US technology companies provides us with a solid buying price for some of these great companies. Alphabet alone corrected by about 31% and has since bounced back.
We see the current price as a great entry price for long term investors based on both technical and fundamental analysis with a target price of $ 203.
To Frustration and Beyond! Welp... That Was That. And I Guess I Was Wrong.
(For now.)
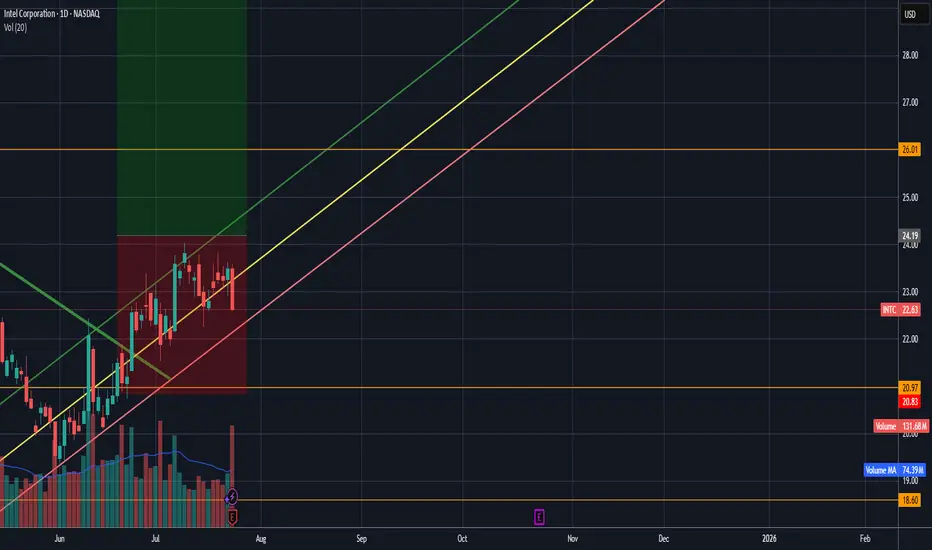
Bears gonna bear, bulls gonna bull, and Intel’s still out here quietly building the Death Star while everyone’s chasing squirrel stocks hitting all-time highs. Yeah, we’re not mooning yet, but I still believe INTC will outpace most of the market on a YTD basis 2–3 years from now. Why settle for 50–100% gains when there’s a potential 200–400% monster comeback on deck? Even a smooth double to $50/share would dunk on most “safe” tech plays.
Analysis (a.k.a. my hopium-fueled thesis):
I’m still convinced this setup mirrors Pat Gelsinger’s 2023 run — but this time, without the rug-pull. Intel’s trimming the fat, locking in on its foundry moonshot, and going full Dragon Ball Z with a “laser focus” on margins and product execution. When they finally deliver a quarter with positive GAAP and non-GAAP EPS and beat expectations? That’s your ignition point for the mother of all squeezes. Until then, they’re still checking boxes and marching toward the target.
This sell-off? Overcooked.
I’m still holding, still in my leaps, and I’m not even thinking about touching that sell button until we fly past $70+.
Remember when people clowned AMD before Lisa Su pulled off the Zen-volution?
Yeah. Intel’s setting up for their own comeback tour. And I’ve got front-row seats. 🧠🚀📈
I'm still in it. Shares + Leaps....
You know the drill...
Disclaimer:
I am not a licensed financial advisor. The information provided in this content is for entertainment and informational purposes only, and should not be construed as financial or investment advice. All investments carry risk, and you should do your own research or consult with a qualified professional before making any financial decisions. Past performance is not indicative of future results. I may hold positions in the securities discussed.
TSLA: 305.30
This idea is supported by entry price and institutional rebound.
Strong institutional breakout. Bullish Entry 2 — Institutional breakout + momentum.
Entrada: 310.00/317.00
SL: 308.00
TP1: 314.00
TP2: 316.00
Bearish Entry 2 — Strong institutional breakout
Entry: 300.00
SL: 302.00
TP1: 296.00
TP2: 292.00

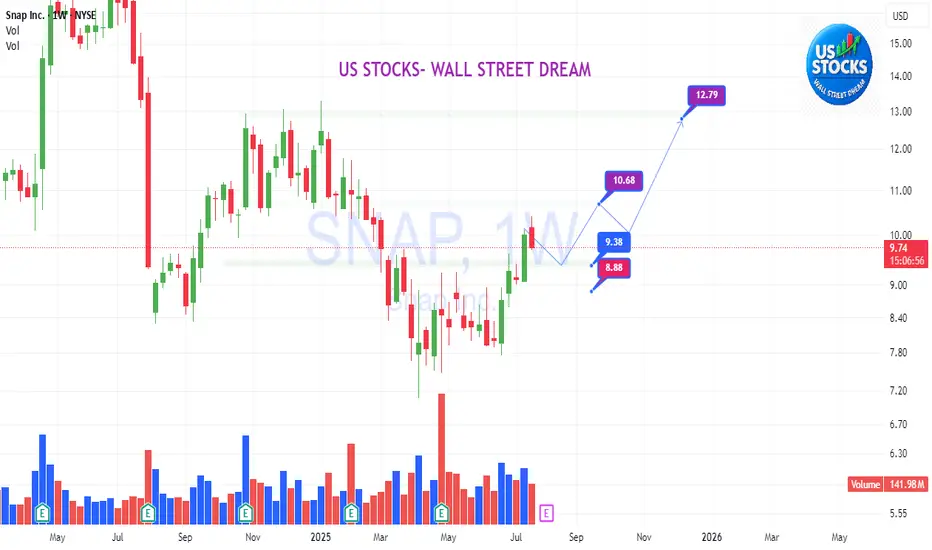
SNAP: Will you join plan with us?SNAP:
.
Will you join plan with us?
Do you want to ride a whole long-term wave that rises from the bottom?
.
US STOCKS- WALL STREET DREAM- LET'S THE MARKET SPEAK!
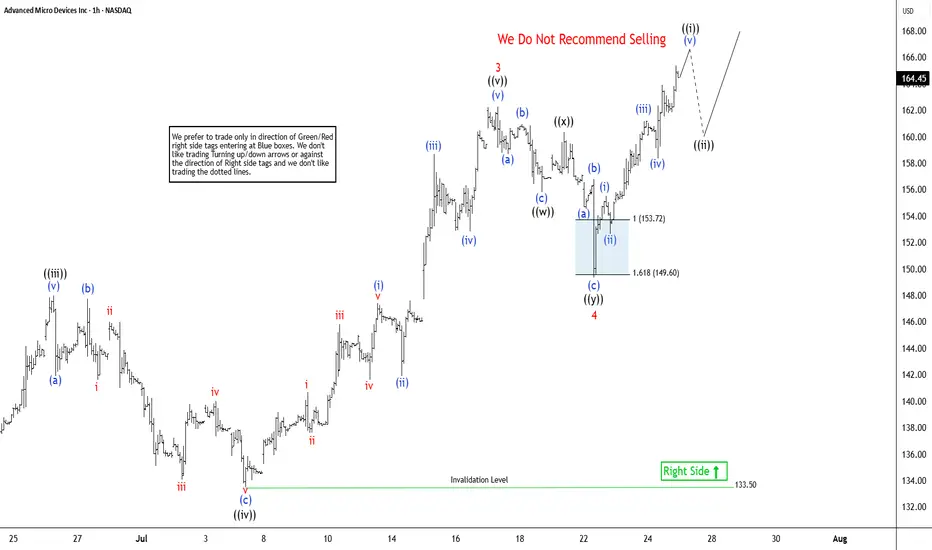
Elliott Wave Outlook: AMD Expects Pullback Soon Before RallyThe Advanced Micro Devices Inc., (AMD) favors rally in impulse Elliott Wave sequence from 4.09.2025 low & expect upside in to 168.36 – 190.36 to finish it. Impulse sequence unfolds in 5, 9, 13, 17…., swings & ends with momentum divergence. In daily, it ended pullback in 3 swings at 75.22 low in blue box area from March-2024 high. It is trading higher in nest & expect 13 swings to finish the impulse ((1)) before correcting next. Currently, it favors rally in 7th swing in daily & expect end soon in to 165.63 – 179.16 area before correcting in (4) as 8th swing. In 4-hour, it ended (1) of ((1)) at 97.91 high, (2) at 83.75 low in 4.21.2025 & favors rally in (3) as extended wave. Within (3), it placed 1 at 122.52 high, 2 at 107.09 low, 3 at 162.36 high, 4 at 149.34 low of 7.22.2025 & favors rally in 5. It is showing higher high since April-2025 low.
Below 3 high of 162.36, it ended 4 pullback in double three correction at 149.34 low. It ended ((w)) at 155.81 low, ((x)) at 160.34 high & ((y)) at 149.34 low. Above 4 low, it favors rally in ((i)) of 5 in to 165.44 – 170.43 before correcting next. Within ((i)), it ended (i) at 155.53 high, (ii) at 152.66 low, (iii) at 161.20 high, (iv) at 158.36 low & favor higher in (v). It appears three swings in (v) & expect pullback before final push above 161.52 low before correcting in ((ii)). Alternatively, the current cycle from 4 low can be 5 of (3) before it corrects in (4). In either the case, the next pullback should remain supported. In 4-hour, it is trading in 11th swing & expect pullback in 12th swings later before final rally. We like to buy the pullback in 3, 7 or 11 swings at extreme area for the upside in ((1)).
Two Trades to go Bullish on TSLAHello, I’m The Cafe Trader.
We’ve been tracking the MAG 7, and Tesla is the next focus for our short-term options or swing trade strategy.
I’m looking at two scenarios that are likely to play out with TSLA over the next few weeks.
For fundamental and long-term analysis, check my other article on TradingView.
⸻
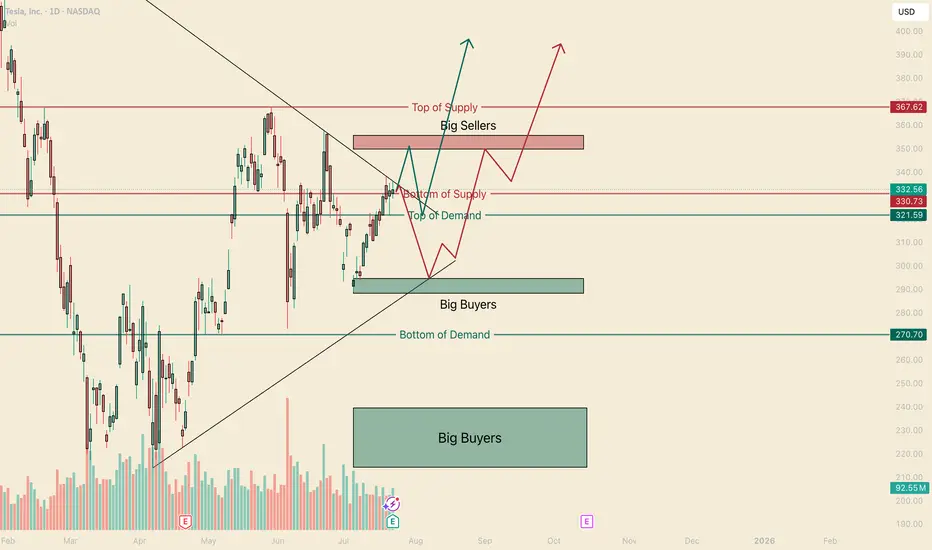
Even though we’re sitting near the middle, bulls have just pushed into a bearish liquidity level (marked “Bottom of Supply”). We don’t know how much supply is left here, but the fact that bulls are pressing in suggests the bears are losing steam. This doesn’t mean price won’t pull back—it just means bearish follow-through may be weaker.
With that in mind, here are the two main scenarios:
⸻
1. Green Arrow — Bullish Test of Sellers
– Stock
If bulls keep the pressure on, we may see a test of the “Big Sellers” zone. The reaction there will tell us a lot.
If we see a sharp rejection (a quick tag followed by a flush) or a fake breakout that reverses, I’d approach longs more cautiously.
However, an aggressive entry long around the “Top of Demand” (around $321) could make sense, especially considering how buyers have been stepping in. This setup is primed to retest highs.
– Options
Pricing will be key here—especially post-earnings (EOD).
I’d look 2 weeks out. If you can snag a 335C for $5.00–$7.00, that’s solid.
Target profit would be into the Big Sellers zone. If we get a strong move before then that nets 3R–5R, I’d take it.
⸻
2. Red Arrow — Bearish Reaction + Big Buyer Support
– Stock
If earnings disappoint, we could see a shift in momentum. That said, big buyers should step in around $295.
This is actually the more likely scenario in my view.
From there, I’d look for a swing back up into the 330–350 range.
We’ll need to see how sellers handle the drop—are they aggressive, or is it just a lack of buyer interest?
Either way, this could align well with long-term buy zones.
– Options
On a flush to $295, I’d look for 3–5 day expiration calls around the 305 strike. @ a price between $1.50–$1.70 (look for 2-3R)
After the bounce, I’d expect a pause or retest of the uptrend line.
Then I’d look 2–3 weeks out for the 325C or 330C, ideally between $3.00–$5.00.
I’ll keep an eye on option pricing and update if we reach that level.
⸻
That’s all for short-term TSLA.
Follow for more charting and trade ideas.
📲 @thecafetrader
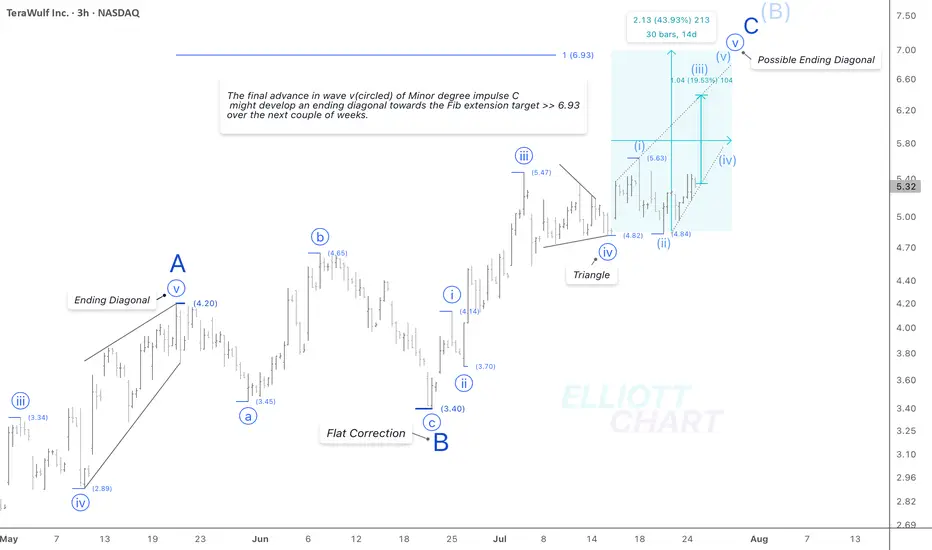
WULF / 3hWave Analysis >> While the current outlook on WULF remains consistent with previous analysis, the internal structure of wave v (circled) suggests the potential development of an ending diagonal in the final leg of Minor degree wave C.
Trend Analysis >> Upon completion of Minor degree wave C, the countertrend advance of Intermediate degree wave (B), which has been unfolding since April 9, is likely to give way to a decline in wave (C) of the same degree. This downtrend might begin in the coming days and potentially extend through the end of the year.
NASDAQ:WULF CRYPTOCAP:BTC BITSTAMP:BTCUSD MARKETSCOM:BITCOIN
#CryptoStocks #WULF #BTCMining #Bitcoin #BTC
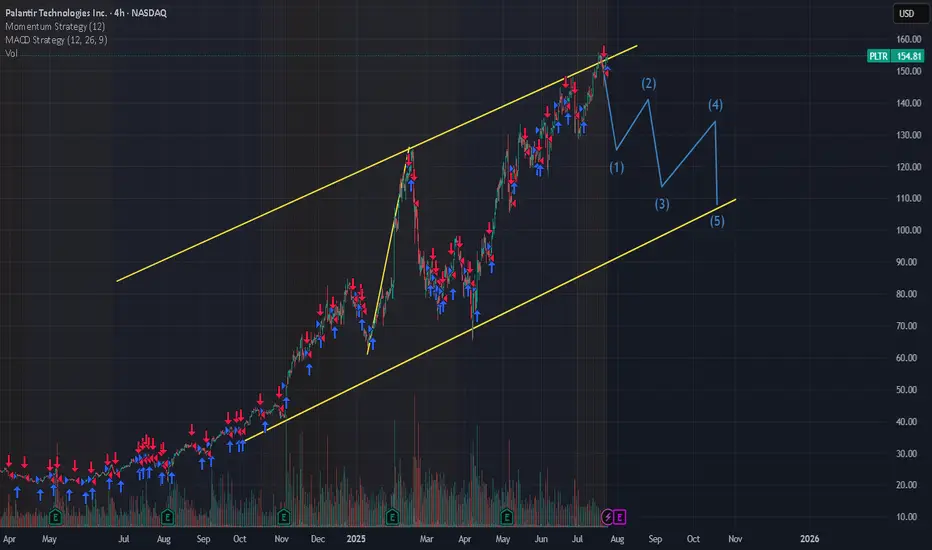
Guys take profit for PLN. A big correction coming soon.Guys take profit for PLN. A big correction coming soon. Based on technical, all the stock market over bull and a big correction coming with in a month. Pls be careful.
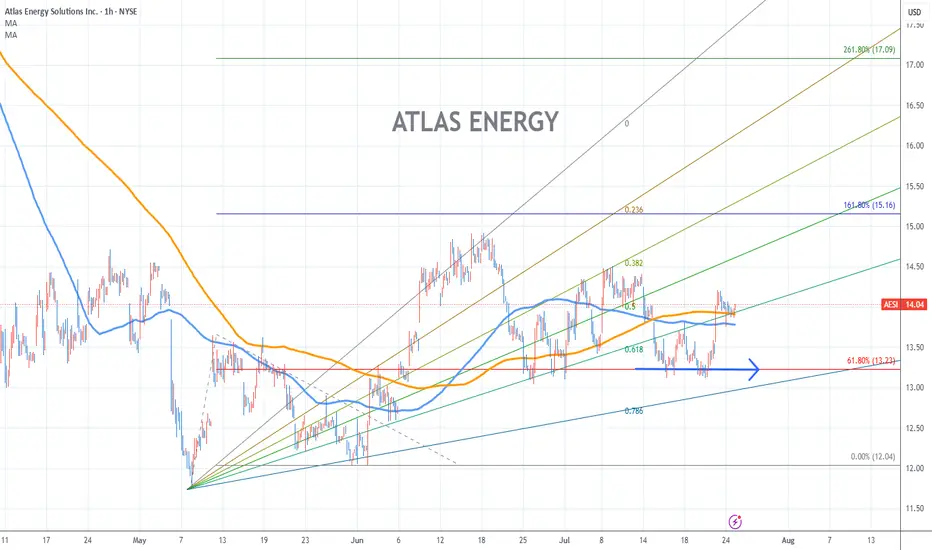
ATLAS ENERGY Stock Chart Fibonacci Analysis 072425Trading Idea
1) Find a FIBO slingshot
2) Check FIBO 61.80% level
3) Entry Point > 13.2/61.80%
Chart time frame:B
A) 15 min(1W-3M)
B) 1 hr(3M-6M)
C) 4 hr(6M-1year)
D) 1 day(1-3years)
Stock progress:C
A) Keep rising over 61.80% resistance
B) 61.80% resistance
C) 61.80% support
D) Hit the bottom
E) Hit the top
Stocks rise as they rise from support and fall from resistance. Our goal is to find a low support point and enter. It can be referred to as buying at the pullback point. The pullback point can be found with a Fibonacci extension of 61.80%. This is a step to find entry level. 1) Find a triangle (Fibonacci Speed Fan Line) that connects the high (resistance) and low (support) points of the stock in progress, where it is continuously expressed as a Slingshot, 2) and create a Fibonacci extension level for the first rising wave from the start point of slingshot pattern.
When the current price goes over 61.80% level , that can be a good entry point, especially if the SMA 100 and 200 curves are gathered together at 61.80%, it is a very good entry point.
As a great help, tradingview provides these Fibonacci speed fan lines and extension levels with ease. So if you use the Fibonacci fan line, the extension level, and the SMA 100/200 curve well, you can find an entry point for the stock market. At least you have to enter at this low point to avoid trading failure, and if you are skilled at entering this low point, with fibonacci6180 technique, your reading skill to chart will be greatly improved.
If you want to do day trading, please set the time frame to 5 minutes or 15 minutes, and you will see many of the low point of rising stocks.
If want to prefer long term range trading, you can set the time frame to 1 hr or 1 day.
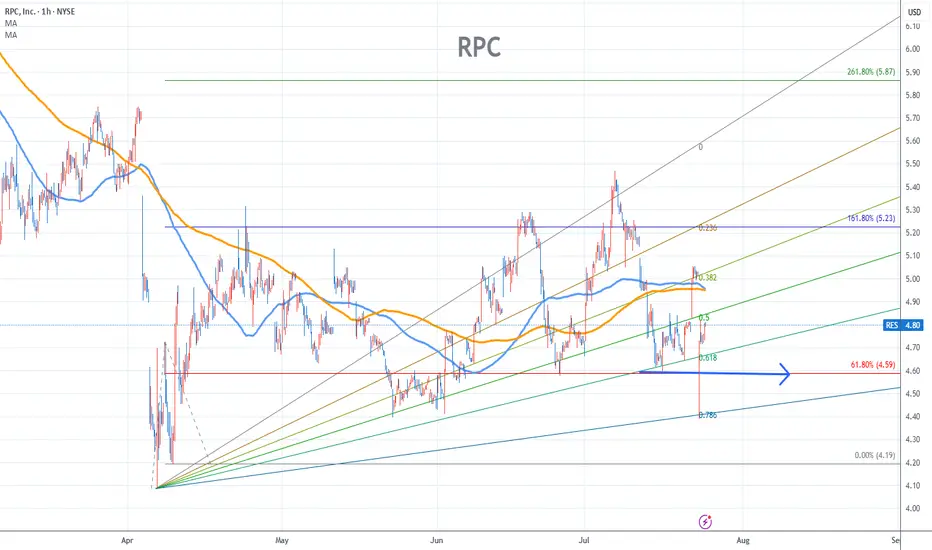
RPC Stock Chart Fibonacci Analysis 072425Trading Idea
1) Find a FIBO slingshot
2) Check FIBO 61.80% level
3) Entry Point > 4.6/61.80%
Chart time frame:B
A) 15 min(1W-3M)
B) 1 hr(3M-6M)
C) 4 hr(6M-1year)
D) 1 day(1-3years)
Stock progress:A
A) Keep rising over 61.80% resistance
B) 61.80% resistance
C) 61.80% support
D) Hit the bottom
E) Hit the top
Stocks rise as they rise from support and fall from resistance. Our goal is to find a low support point and enter. It can be referred to as buying at the pullback point. The pullback point can be found with a Fibonacci extension of 61.80%. This is a step to find entry level. 1) Find a triangle (Fibonacci Speed Fan Line) that connects the high (resistance) and low (support) points of the stock in progress, where it is continuously expressed as a Slingshot, 2) and create a Fibonacci extension level for the first rising wave from the start point of slingshot pattern.
When the current price goes over 61.80% level , that can be a good entry point, especially if the SMA 100 and 200 curves are gathered together at 61.80%, it is a very good entry point.
As a great help, tradingview provides these Fibonacci speed fan lines and extension levels with ease. So if you use the Fibonacci fan line, the extension level, and the SMA 100/200 curve well, you can find an entry point for the stock market. At least you have to enter at this low point to avoid trading failure, and if you are skilled at entering this low point, with fibonacci6180 technique, your reading skill to chart will be greatly improved.
If you want to do day trading, please set the time frame to 5 minutes or 15 minutes, and you will see many of the low point of rising stocks.
If want to prefer long term range trading, you can set the time frame to 1 hr or 1 day.
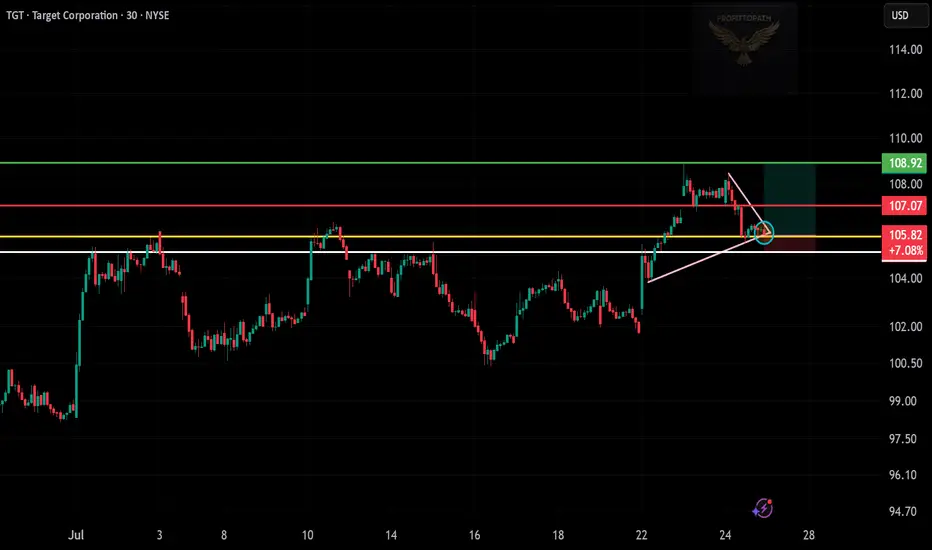
“TGT Pullback Entry – Clean Breakout Setup!Pattern: Breakout and retest of wedge
Entry Zone: Around $105.82
Stop Loss: Below $105.00 (white support line)
Target: $108.92 (green resistance zone)
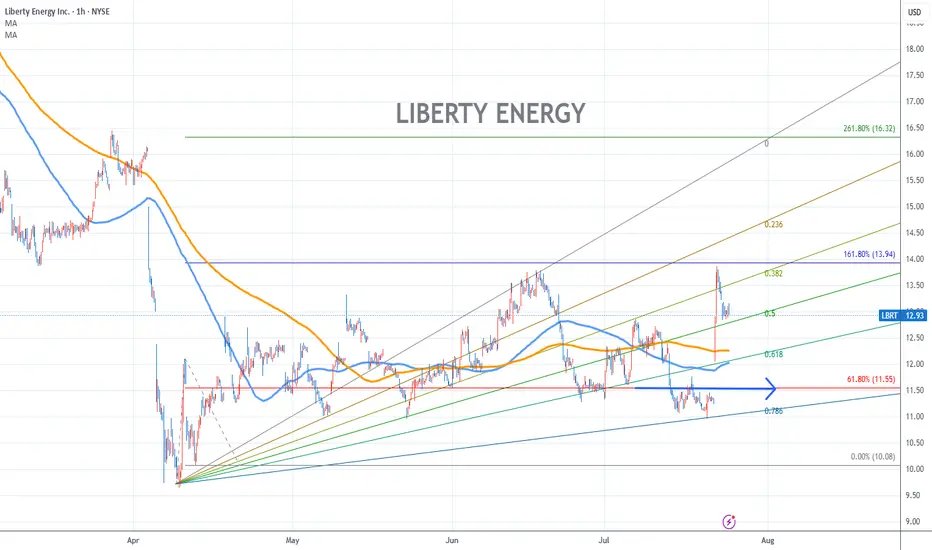
LIBERTY ENERGY Stock Chart Fibonacci Analysis 072425Trading Idea
1) Find a FIBO slingshot
2) Check FIBO 61.80% level
3) Entry Point > 11.6/61.80%
Chart time frame:B
A) 15 min(1W-3M)
B) 1 hr(3M-6M)
C) 4 hr(6M-1year)
D) 1 day(1-3years)
Stock progress:A
A) Keep rising over 61.80% resistance
B) 61.80% resistance
C) 61.80% support
D) Hit the bottom
E) Hit the top
Stocks rise as they rise from support and fall from resistance. Our goal is to find a low support point and enter. It can be referred to as buying at the pullback point. The pullback point can be found with a Fibonacci extension of 61.80%. This is a step to find entry level. 1) Find a triangle (Fibonacci Speed Fan Line) that connects the high (resistance) and low (support) points of the stock in progress, where it is continuously expressed as a Slingshot, 2) and create a Fibonacci extension level for the first rising wave from the start point of slingshot pattern.
When the current price goes over 61.80% level , that can be a good entry point, especially if the SMA 100 and 200 curves are gathered together at 61.80%, it is a very good entry point.
As a great help, tradingview provides these Fibonacci speed fan lines and extension levels with ease. So if you use the Fibonacci fan line, the extension level, and the SMA 100/200 curve well, you can find an entry point for the stock market. At least you have to enter at this low point to avoid trading failure, and if you are skilled at entering this low point, with fibonacci6180 technique, your reading skill to chart will be greatly improved.
If you want to do day trading, please set the time frame to 5 minutes or 15 minutes, and you will see many of the low point of rising stocks.
If want to prefer long term range trading, you can set the time frame to 1 hr or 1 day.
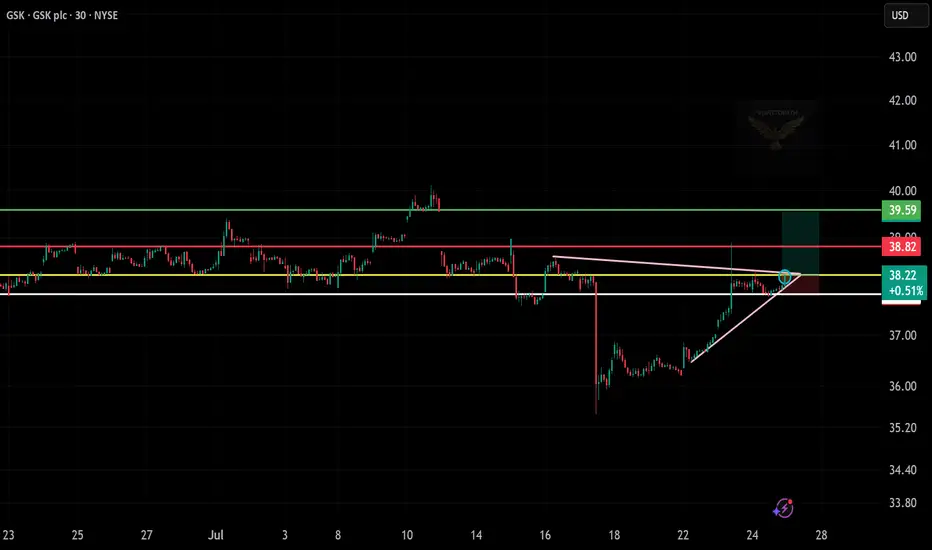
GSK Breakout Trade – Clean Setup AheadPattern: Bullish breakout from descending wedge
Entry Zone: Around $4.83–$4.97
Stop Loss: Just below $4.70 (trendline + horizontal support)
Target: $5.18 (green resistance level)
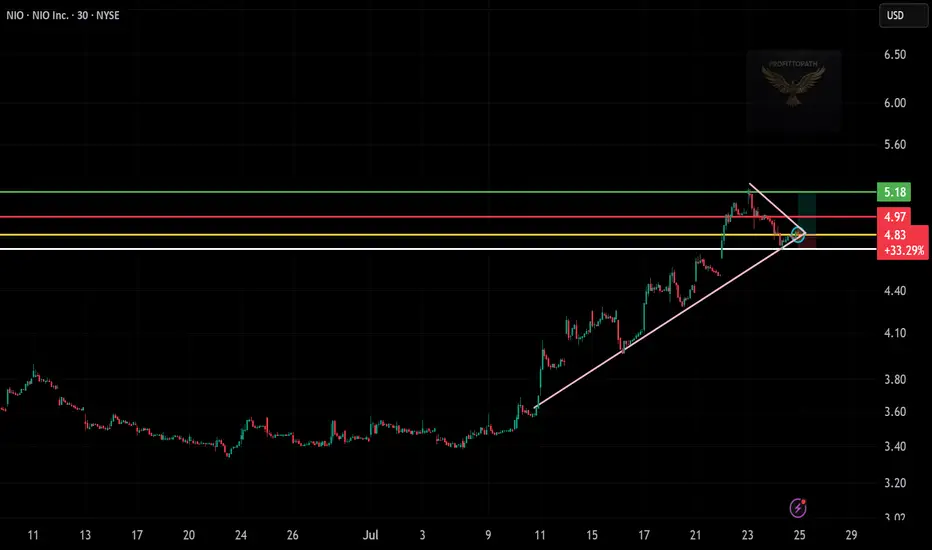
NIO Setup Looks Strong – Watch This Move!
Pattern: Bullish breakout from descending wedge
Entry Zone: Around $4.83–$4.97
Stop Loss: Just below $4.70 (trendline + horizontal support)
Target: $5.18 (green resistance level)
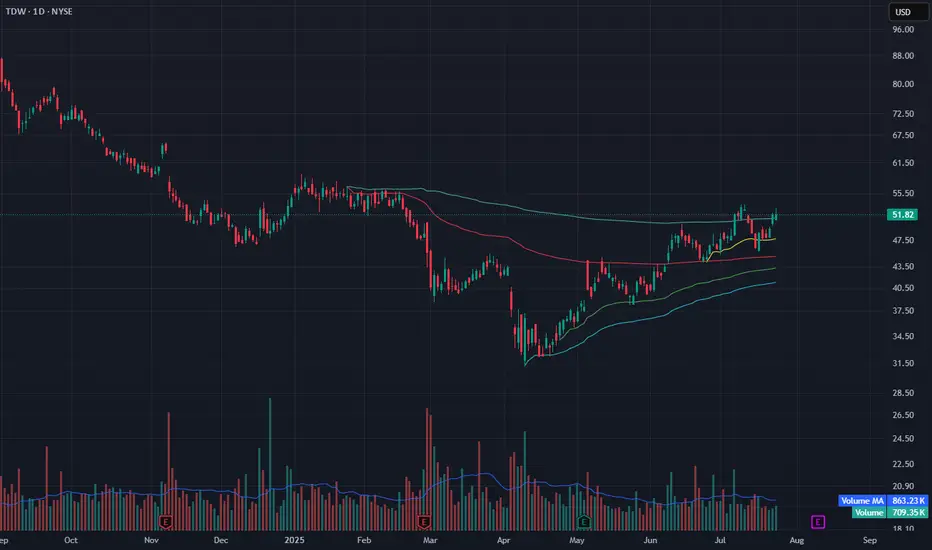
TDW Breaks Out from VWAP Stack – Testing Long-Term ResistanceTDW has broken out from a clean VWAP stack structure and is now testing long-term resistance near $52. Price has made a strong recovery since April and is currently holding above the yellow and red VWAP levels with a higher low pattern.
Today’s close at $51.82 keeps it right at resistance, and a break above $52 could open room toward $55+. Volume is slightly below average (709K vs. 863K MA), but the structure remains bullish as long as it holds above $48.50.
Indicators used:
Anchored VWAP (multi-tier support)
Volume + Volume MA (momentum context)
Price structure (higher lows, breakout test)
Entry idea: Breakout above $52
Target: $55–56.50
Stop: Below $48.50 or red VWAP
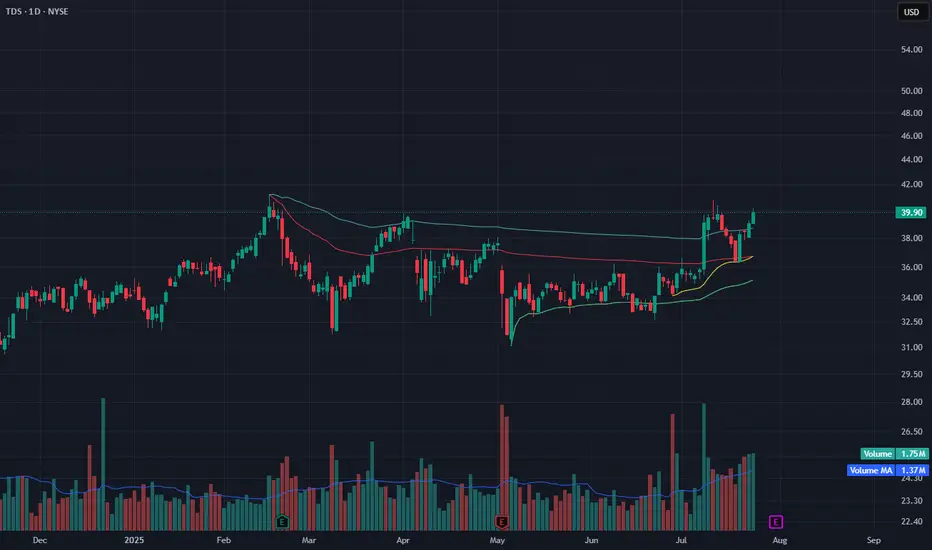
TDS Breaks Out with Volume – Riding Anchored VWAP SupportTDS is making a clean breakout with strong follow-through, gaining over 2% today and closing near the session highs at $39.90. Price is trading above all key anchored VWAP levels (yellow, green, and blue), with the most recent bounce holding firmly above the yellow VWAP.
Volume confirms strength — today's 1.75M is well above the 1.37M average, reinforcing buyer interest. A move through $40.50 could clear the way toward the next resistance zone near $43–44.
Indicators used:
Anchored VWAP (trend support structure)
Volume + Volume MA (confirmation of breakout strength)
Trend structure (bullish higher highs and higher lows)
Entry idea: Break and hold above $40
Target: $43–44
Stop: Below $37.50 or yellow VWAP
SMTC Testing Key Resistance – Holding Above All VWAPsSMTC is consolidating just below a major resistance level around $53. Price has been riding above all key anchored VWAPs, with the yellow VWAP offering recent support throughout the move.
Today’s +1.70% gain comes as the stock holds the breakout zone and volume stays stable at 1.49M (just under the 2.07M MA). If price breaks and holds above $53.50, a continuation move toward $57–59 is likely, retesting the January breakdown zone.
Trend remains bullish while above $49.50.
Indicators used:
Anchored VWAP (multiple layers of support)
Volume + Volume MA (momentum gauge)
Resistance retest setup
Entry idea: Break above $53.50
Target: $57–59
Stop: Below $49.50 or rising yellow VWAP

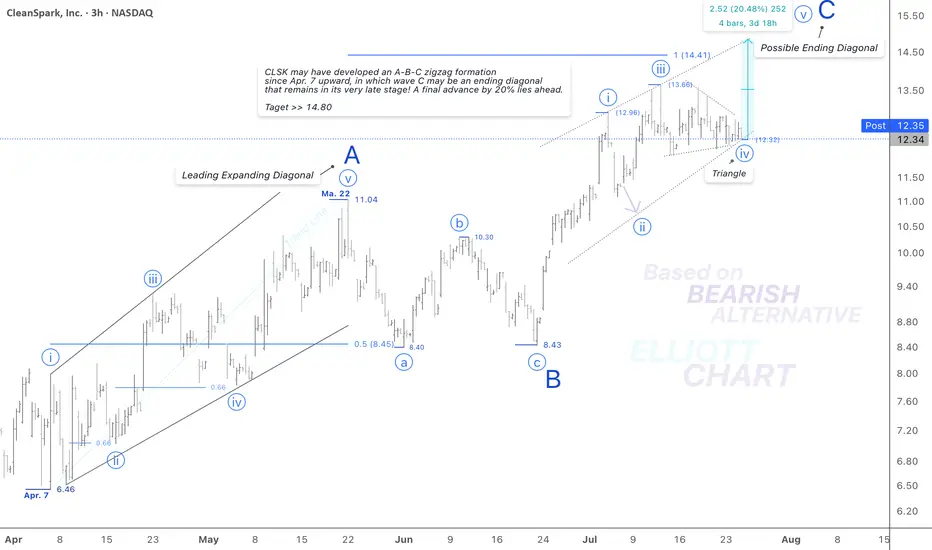
$CLSK / 3hNASDAQ:CLSK
According to the bearish alternative in my weekly frame(not posted!), I'd analyzed the rising tide since April 7 as an A-B-C zigzag formation in a correction of the Intermediate degree wave (B) <<. Not shown in this 3h frame.
Wave Analysis >> As illustrated in the 3h-frame above, the Minor degree wave C as the last part of the correction upward in wave (B) may thoroughly develop in an ending diagonal, which remains in its very late stage; after a triangle correction in Minute degree wave iv(circled) now a final advance in the same degree wave v(circled) is anticipated to follow very soon to conclude the ending diagonal wave C of the countertrend advance of wave (B).
Trend Analysis >> After completion of the possible ending diagonal as Minor degree wave C, the trend will soon turn downward in an ultimate decline in Intermediate degree wave (C), which will likely last until the end of the year!!
#CryptoStocks #CLSK #BTCMining #Bitcoin #BTC
NASDAQ:CLSK CRYPTOCAP:BTC BITSTAMP:BTCUSD MARKETSCOM:BITCOIN
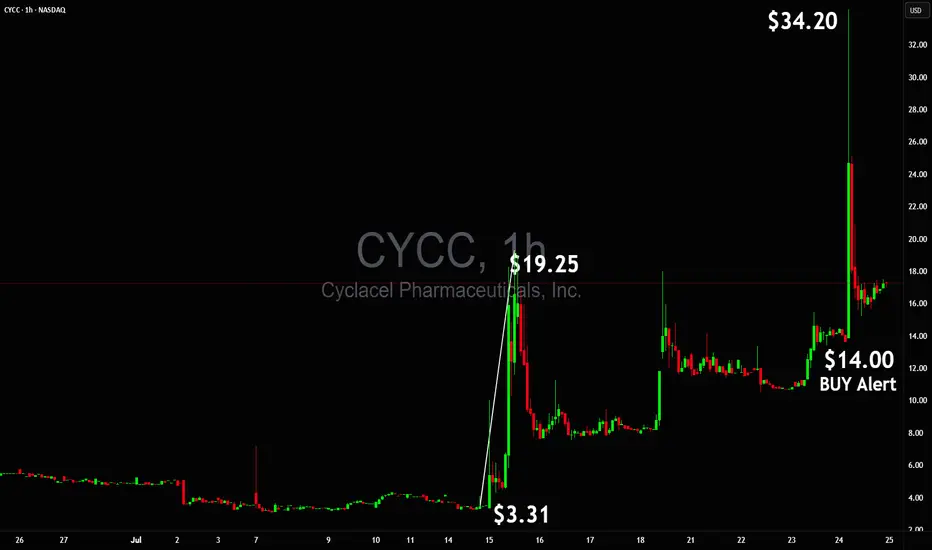
Buy Alert at $14, woke up to $34 $CYCC After missing the previous run because of no safe setup I made sure think time everyone who followed gets paid 🚀 Buy Alert $14, woke up to $34 NASDAQ:CYCC best stock of the day, got paid in a BIG WAY 🙌🏻
MOH PUT TRADE ALERT (07/24)
🚨 MOH PUT TRADE ALERT (07/24) 🚨
📉 Extreme Oversold. Institutional Selling. Setup is Real.
🧠 Key Stats:
• RSI: 13.2 = insanely oversold
• Volume: 🔺2.6x last week = institutions dumping
• Put/Call Ratio: 0.33 → heavy bearish bets
• VIX: Low → IV still cheap 💰
🔥 TRADE IDEA
🔻 Buy MOH $150 PUT exp 8/15
💰 Entry: $4.20
🎯 Target: $8.40
🛑 Stop: $2.50
📈 Confidence: 75%
📊 Why this works:
• Everyone’s selling, and the chart confirms it
• IV still low → great R/R for puts
• Only risk? Dead-cat bounce — use stop.
🧨 Execute at open — momentum is accelerating.
#MOH #PutOptions #BearishSetup #OversoldRSI #UnusualOptionsActivity #TradingView #InstitutionalSelling #SmartMoney #SwingTrade #WeeklyOptions #ShortTheBounce

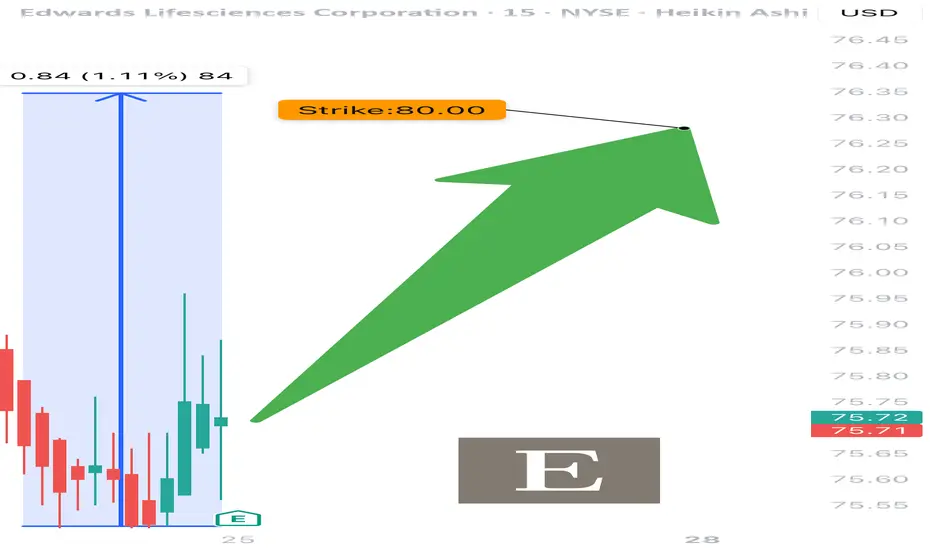
EW EARNINGS TRADE SETUP
📈 EW EARNINGS TRADE SETUP (07/24) 📈
💥 Quiet stock, loud opportunity. Fundamentals strong. Market asleep. We’re not.
🧠 Quick Read:
• Beat rate: 88% over 8 quarters
• Margins elite (OP Margin: 29%, Net: 75.7%)
• RSI 43 → Neutral setup with room to run
• Big OI at $80 calls (6.7k+) 💪
• IV not bloated → low crush risk ✅
🎯 TRADE IDEA
🟢 Buy EW $80 Call exp 8/15
💰 Entry: $1.55
🎯 Target: $4.65
🛑 Stop: $0.77
📈 Confidence: 70%
📊 Why it works:
• Medical device demand + aging population = macro tailwind
• Market ignoring it = opportunity
• Risk-on tape + IV sweet spot
#EW #OptionsAlert #MedicalTechStocks #EarningsSetup #LongCall #RiskReward #OptionsTrading #StockAlert #SwingTrade #TradingView #SmartMoneyFlow
HCA EARNINGS TRADE (07/24)
🚨 HCA EARNINGS TRADE (07/24) 🚨
🏥 Healthcare with earnings tonight after close — high-upside setup brewing.
🧠 Quick Breakdown:
• 📊 Revenue Growth: +5.7% (stable, defensive sector)
• 💸 Margins: Operating 15.6%, EBITDA 19.9% = efficient and strong
• 🧠 Beat Rate: 75% with 6.7% avg surprise → credible upside
• 📉 RSI: 22.5 → OVERSOLD and primed for bounce
• 💬 Whisper sentiment strong from sector peers (e.g., Tenet)
• 🔥 Analysts target: $391.54 → 13.8% upside
💥 TRADE SETUP
🟢 Buy HCA $375 Call exp 8/15
💰 Entry: $3.90
🎯 Target: $11.70 (200–300%)
🛑 Stop: $1.95
📈 Confidence: 73%
⏰ Entry: Before Close Today (Pre-Earnings)
📆 Earnings: Today After Market (AMC)
📊 IV Rank: 0.60 → fair pricing
📉 Expected Move: ~5%
⚠️ RSI this low + sector strength = earnings bounce candidate. Watch the $375 breakout zone. 🎯
#HCA #EarningsPlay #OptionsTrading #HealthcareStocks #UnusualOptionsActivity #CallOptions #TradingView #DayTrading #OversoldBounce #EarningsSeason
