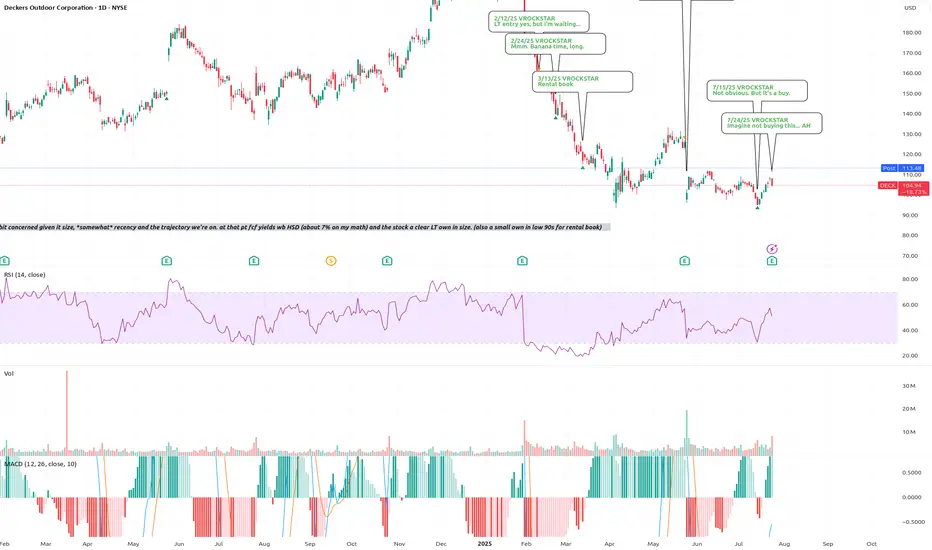
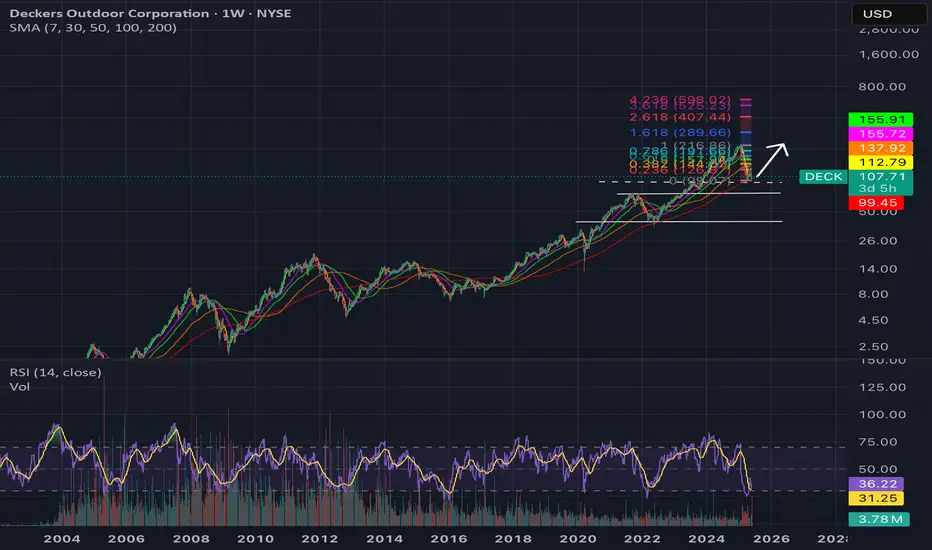
7/24/25 - $deck - Imagine not buying this... AH7/24/25 :: VROCKSTAR :: NYSE:DECK
Imagine not buying this... AH
- amazing to listen to the mental degradation of "sell side analysts".
- the quarterly ritual when real shareholders must endure management answering the room temperature IQ questions from these "research" providers is a circus
- right now there's a sell side "analyst" demanding an explanation for how 1 + 1 = 2. "put some meat on the bone" he says
- then he interrupts
- it's really amazing the way Elon handles these retards, i wish more mgmt teams would simply tell these folks the truth
- but alas
results is a smash. forget the minutia
- big revenue beat
- key brands growing (lol NYSE:NKE is not even growing and trades 2x multiples)
- buying back shares
- DTC is a tailwind
so weird AH action to see +15-20% then retrace to +2%
i'll be sizing this up and will respond tmr/ what i'm deciding. will be taking the 6x leverage on 1% 6mo ITM leverage to probably 2-3x leverage on 18 mo (jan '27) expires and targeting a gross of ~10%.
be well. enjoy.
V
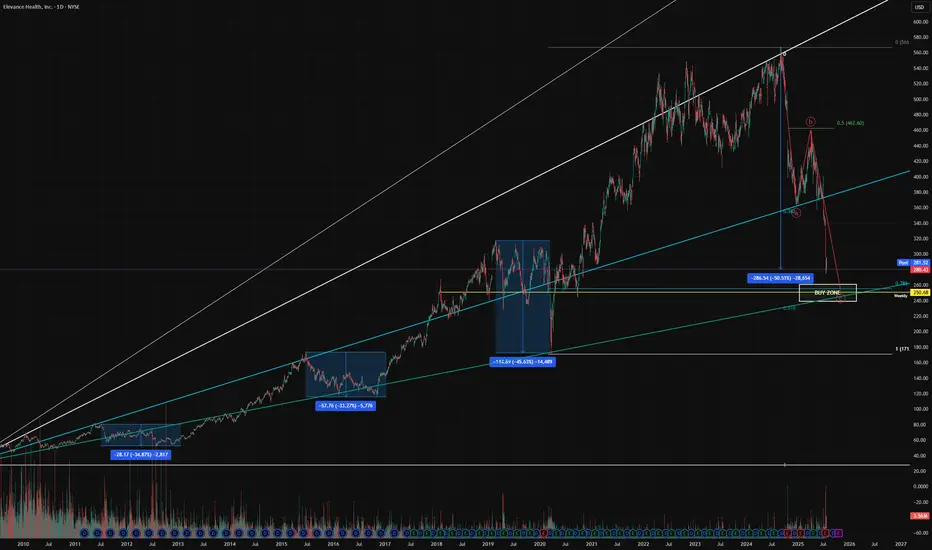
Support Levels approaching$250 could potentially be a good opportunity to pick up Elevance. We are moving towards that level and I will be patient here as the downtrend is strong. The stock is representing deep value here and insiders agree as the CEO is been acquiring shares.
The stock has dropped 50% since it's recent highs. The sector is under extreme pressure, this is the time to be looking for opportunities. We are close to hitting a Fibonacci support trendline which has held up since 2009.
I'm keeping a close eye on this one.
$47 for Mr. 47th himself? TA aside, fundamentally its a no brainer. No matter how much you hate him, there is no reason a stock that has half of its market cap ($2 Billion) in CRYPTOCAP:BTC should stay at the market cap of $5 Billion.
Next time there is a pump rally in Bitcoin, this thing will join in on the fun.
$47 is not unrealistic. That would set the stock at around a $10-$15 Billion Market Cap value.

NovoCure Limited (NVCR) to rally 100% ??** short term forecast, days and weeks ahead **
On the above 10 day chart price action has crashed 95% since support failed. Today sellers are trying to push that correction to 100%, are they right?
Unlikely.
1) Price action (not visible on LOG) and RSI resistance breakouts.
2) Support on past resistance confirms.
3) Trend reversal. Higher lows print.
4) Bull flag confirmation forecasting a 100% move to mid 30’s.
Is it possible price action corrects further? Sure.
Is it probable? No.
Ww
Type: trade
Risk: you decide
Timeframe for long: Yesterday
Return: 100%
Stop loss: Will say elsewhere

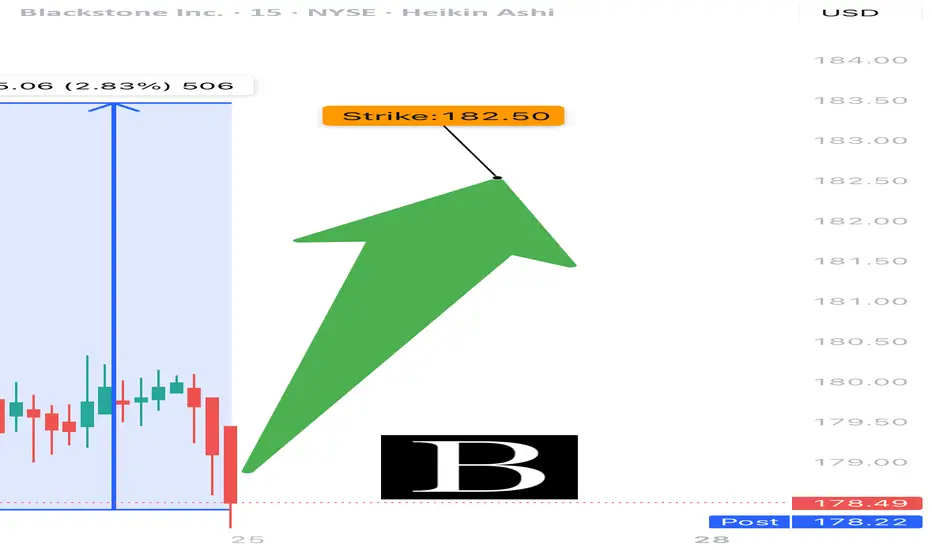
BX EARNINGS TRADE (07/24)
🚨 BX EARNINGS TRADE (07/24) 🚨
💼 Blackstone drops earnings after close — setup looks 🔥 bullish
🧠 Key Insights:
• 📉 TTM Revenue: -8.2%, but Q2 bounce back = $764M profit
• 💰 Margins: Strong → 45.3% operating, 20.6% net
• 📈 RSI: 73.88 = HOT momentum
• 🧠 AUM: $1.2 Trillion = 🐘 heavyweight
• 🔥 Options Flow: Call skew at $182.50 = institutional bullish bets
• 🧮 Expected move: ~5% post-earnings
💥 TRADE SETUP
🟢 Buy BX $182.50 Call exp 7/25
💰 Entry: $0.69
🎯 Target: $1.38–$2.07 (200–300%)
🛑 Stop: $0.34
📈 Confidence: 85%
⏰ Entry: Before Close Today (Pre-Earnings)
📊 IV Rank: 0.75 → options decently priced
⚠️ Watch resistance at $185 — breakout = 🚀
Tight risk, big reward. Pure earnings momentum play.
#BX #EarningsPlay #OptionsTrading #Blackstone #UnusualOptionsActivity #CallOption #TradingView #FinanceStock #InstitutionalFlow #OptionsAlert
Bitcoin, SPX, Ethereum, Tesla: Whats Next? BTC appears to be showing distribution signs.
I do believe BTC local top is in, but alt coins like Ethereum can still push a bit higher.
Ethereum short around 3900-4000 looks promising
Tesla fell sharply on the back of cash flow burn and expenditures.
Investors are also fearful of sales decline and loss of EV credits.
SPX hit major long term resistance today. Coupling this with a depressed Vix we are likely setting up for a pullback in the market.
Small caps saw distribution today on the back of rising yields. A failed breakout observed on IWM chart.

Long $DECK - NYSE:DECK is the only growth story I'm comfortable buying. This was wall street darling for many years. I believe sell off was overdone.
- It has lot of room to run. It is getting traction and NYSE:NKE because of law of large number is not growing much in %age.
- However, NYSE:DECK has lot of road ahead and it can grow for many years to come. Global expansion is also not out of the question.
- I strongly believe NYSE:DECK will make an all time high when this tariff narrative takes a backseat.
- Another bullish thing for NYSE:DECK is that Trump doesn't plan to bring back shoes or clothing manufacturing back in US.
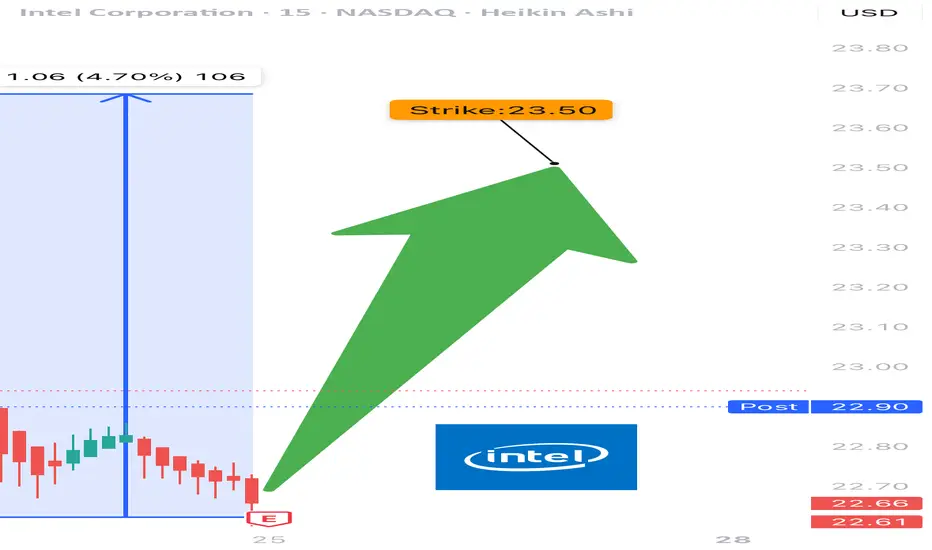
INTC EARNINGS TRADE (07/24)
🚨 INTC EARNINGS TRADE (07/24) 🚨
🎧 Earnings drop after close — here’s the high-conviction setup 📊
🧠 Key Highlights:
• 💥 Surprise Beat Rate: 88%, avg surprise = 419%
• 📉 Margins: Ugly (-36% net margin) but improving sentiment
• 📈 Volume Surge + $24 resistance test = pre-earnings drift 🚀
• 🔎 Mixed options flow → cautious bulls leaning in
• 🎯 Sector: SEMI = 🔀 rotating hard, competition vs AMD/NVDA rising
💥 TRADE SETUP
🟢 Buy INTC $23.50 Call exp 7/25
💰 Entry: $0.59
🎯 Target: $1.18
🛑 Stop: $0.29
📈 Confidence: 75%
⏰ Entry: Before Earnings (Close 07/24)
📆 Earnings: Today After Market (AMC)
📊 Expected Move: 5%
⚠️ Play the earnings drift → gap up = profit. Miss = cut fast. Risk = defined. Reward = explosive.
#INTC #EarningsPlay #OptionsTrading #IntelEarnings #UnusualOptionsActivity #TechStocks #Semiconductors #TradingView #EarningsSeason #DayTrading #CallOptions
BIIB Bounces from VWAP ClusterBIIB is climbing after bouncing off a VWAP cluster (yellow and green zones) and reclaiming key levels. Price held support near $125 and is now pushing toward the upper range near $134.
Volume is slightly above average (1.23M vs. 1.21M MA), and price structure looks constructive with a clean higher low in place. The red VWAP still acts as overhead resistance, but if cleared, a move toward $136–138 could follow.
Indicators used:
Anchored VWAPs (support confluence and resistance setup)
Volume and Volume MA
Trend structure (higher low + bullish follow-through)
Entry idea: Above $133 or on dip to $130
Target: $136–138
Stop: Below $127 or VWAP cluster

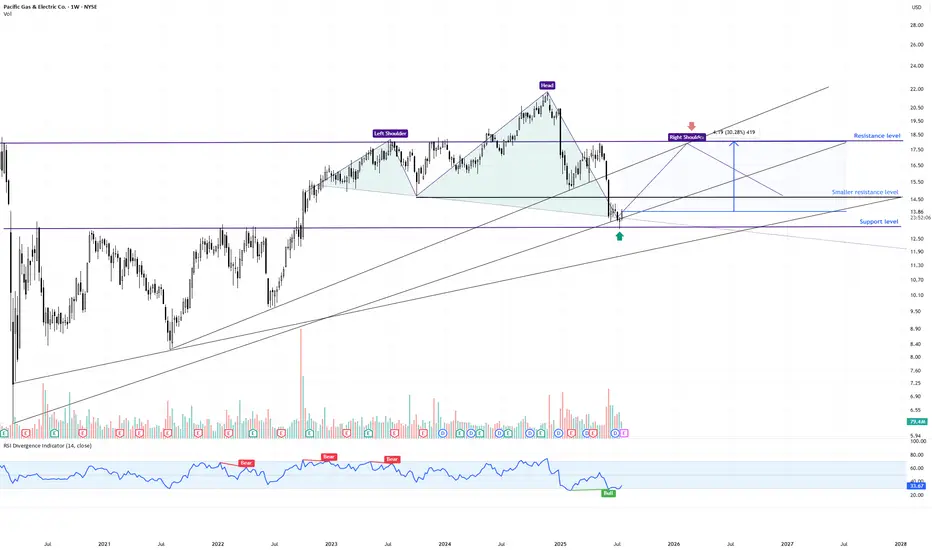
PCG Weekly Swing Trade | High-Probability Reversal Zone📍 Ticker: PCG (Pacific Gas & Electric Co.)
📆 Timeframe: 1W (Weekly)
💡 Pattern: Head & Shoulders Formation – Testing Neckline & Long-Term Support
📉 Price: $13.87 (current weekly level)
📊 Volume: 78M
📉 RSI: 33.7 → oversold zone brewing
🔍 What the Chart is Showing
PCG is in the late stages of a Head & Shoulders pattern, but the right shoulder is still developing. Price is now pressing into a critical confluence area where multiple factors intersect:
✅ Neckline zone from the potential H&S structure
✅ Multi-year ascending trendline support (2020 origin)
✅ Horizontal support cluster from 2022–2023 consolidation
✅ Weekly RSI hovering near oversold, hinting at possible bullish divergence
Importantly, the H&S is not yet confirmed – it would require a decisive weekly close below the neckline to trigger a textbook breakdown.
🧠 Swing Trade Scenarios
➡️ Bullish Reversal Scenario (Failed Breakdown)
🟢 Entry Zone: $13.60–$14.00
🎯 Target 1: $14.62 (initial resistance pivot) - close 30-70% of the position
🎯 Target 2: $17.80–$18.50 (major resistance) - close the another 30-70% of the position.
⛔️ Stop-Loss 1: Close below $13.20 (neckline break confirmation)
➡️ Bearish Breakdown Scenario (Pattern Confirmation)
❌ If PCG closes below $13.20 on the weekly, it confirms the H&S → opens downside toward $11.50 (the lowest trendline support)
⚠️ What Makes This Week Critical
📌 A hammer-like candle is forming – but needs a strong weekly close to indicate buyer absorption
📌 A close above $14.00 would weaken the H&S formation, hinting at a failed pattern
📌 A close below $13.20 would confirm the bearish continuation
This is a decision zone: either the right shoulder fails, triggering a deeper swing lower, or buyers defend and negate the pattern.
💬 Will PCG confirm the weekly H&S breakdown or trap bears with a failed pattern bounce?
✅ This week’s close will define the next major swing move!
LIKE & FOLLOW for more professional swing setups with clean risk/reward.
#PCG #SwingTrade #Utilities #TargetTraders #TechnicalAnalysis #HeadAndShoulders
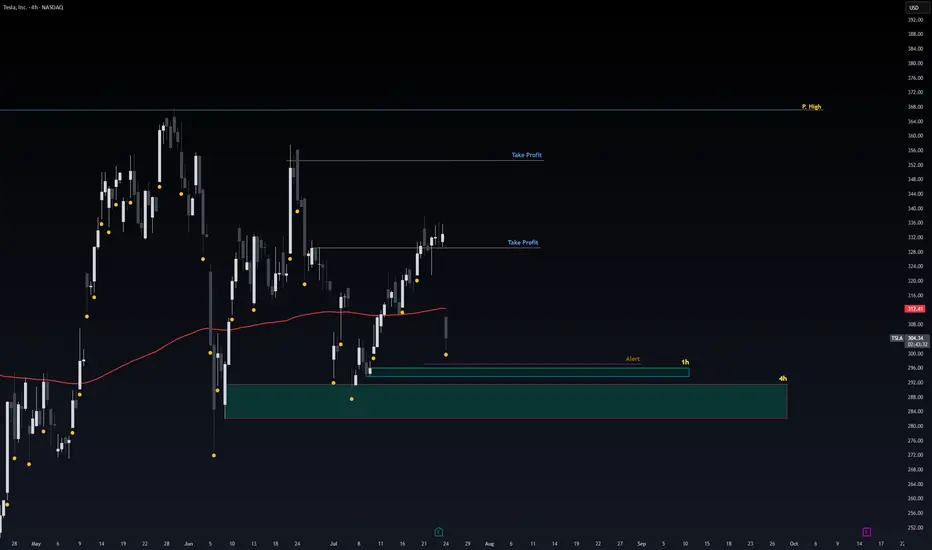
Safe Entry Tesla1h & 4h Green Zones are safest entry Zones.
Stop loss Below.
Note: 1- Potentional of Strong Buying Zone:
We have two scenarios must happen at The Mentioned Zone:
Scenarios One: strong buying volume with reversal Candle.
Scenarios Two: Fake Break-Out of The Buying Zone.
Both indicate buyers stepping in strongly. NEVER Join in unless one showed up.
2- How to Buy Stock (safe way):
On 1H TF when Marubozu/Doji Candle show up which indicate strong buyers stepping-in.
Buy on 0.5 Fibo Level of the Marubozu/Doji Candle, because price will always and always re-test the
Jumia Technologies (JMIA) has formed a Golden Cross on the dailyNYSE:JMIA just printed a Golden Cross on the daily chart (50MA > 200MA) — often a signal of trend reversal.
✅ RSI ~62 = momentum building
✅ MACD flipped bullish
📊 Volume rising — breakout setup forming
🔼 Next resistance: $5.50 → $6.20
🛡️ Support: $4.50–$4.60 (MA zone)
Chart looks bullish — watching for a push above $5.50 to confirm.
#JMIA #GoldenCross #BullishSetup #MomentumStocks #SwingTrade #BreakoutWatch

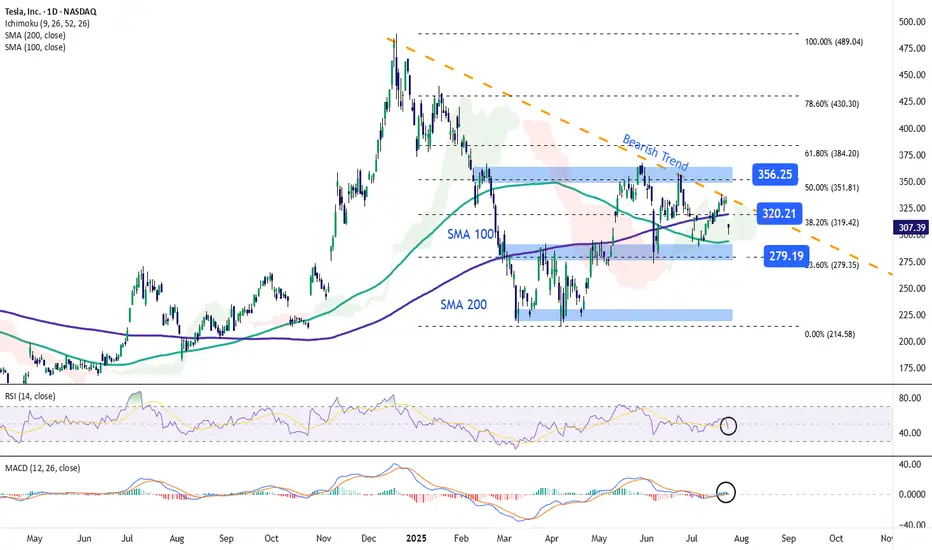
Tesla Stock Returns to the $300 ZoneShortly after reporting earnings, Tesla stock fell more than 9% in the final hours of trading. This new bearish move is mainly due to the company’s earnings per share (EPS) of $0.40, which missed expectations of $0.43, and revenue of $22.5 billion, below the projected $22.74 billion. These figures indicate that Tesla failed to meet market expectations, triggering a sustained downward trend in the stock. This move could extend further unless new catalysts emerge to restore investor confidence.
Downtrend Remains Intact
Recent price action has been clearly bearish and continues to reinforce a downtrend that began forming in late December. So far, there has been no significant bullish correction to challenge this structure, making the bearish pattern the dominant technical setup in the short term.
Technical Indicators
RSI: The indicator remains below the neutral 50 level, suggesting that selling momentum continues to build. If the downward path persists, bearish pressure may grow stronger in upcoming sessions.
MACD: The MACD histogram is currently hovering around the zero line, showing signs of technical indecision. However, if it crosses clearly below zero, it would confirm a more sustained bearish momentum.
Key Levels to Watch:
$356 – Major Resistance:
This level corresponds to the 50% Fibonacci retracement. A break above this zone could threaten the current downtrend.
$320 – Nearby Resistance:
Aligned with the 200-period simple moving average and the 38.2% Fibonacci level, a close above this point could reignite bullish sentiment and trigger a short-term upward move.
$280 – Key Support:
This is a critical support level, aligned with the 23.6% Fibonacci retracement. A breakdown here could extend the ongoing bearish trend.
Written by Julian Pineda, CFA – Market Analyst
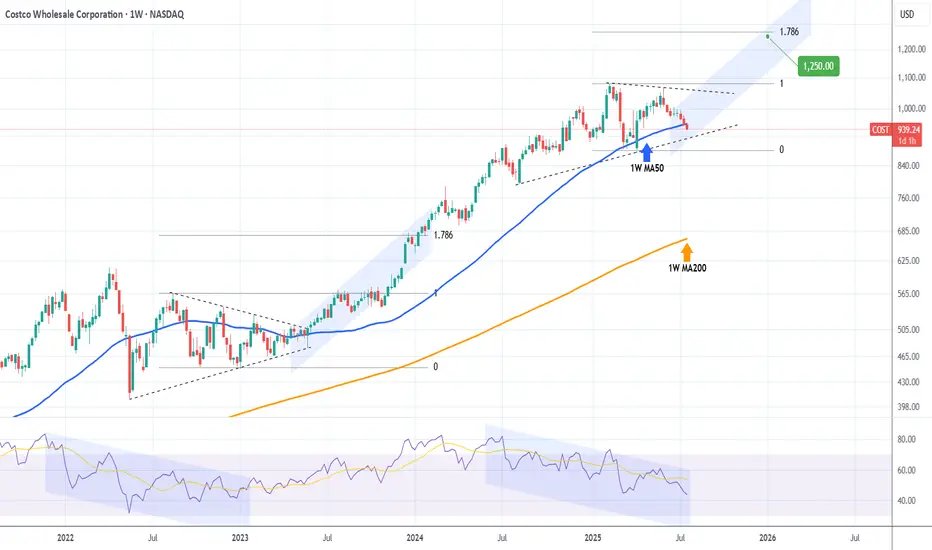
COSTCO Looking for a bottom to fuel rally to $1250.Last time we looked at Costco (COST) was 6 months ago (January 21) when we gave the most optimal buy signal exactly at the bottom of the Channel Up at the time, easily hitting our $1045 Target:
Since then, the stock has entered a new Accumulation Phase in the form of a Triangle and this week broke below its 1W MA50 (blue trend-line), which is where its previous bottom (Higher Low) was formed.
The last similar Triangle pattern was formed straight after the May 16 2022 market bottom and once it broke upwards it led to a massive rally. Even the 1W RSI sequences between the two fractals are similar.
Our Target is $1250, just below the 1.786 Fibonacci extension.
-------------------------------------------------------------------------------
** Please LIKE 👍, FOLLOW ✅, SHARE 🙌 and COMMENT ✍ if you enjoy this idea! Also share your ideas and charts in the comments section below! This is best way to keep it relevant, support us, keep the content here free and allow the idea to reach as many people as possible. **
-------------------------------------------------------------------------------
💸💸💸💸💸💸
👇 👇 👇 👇 👇 👇
RCAT about to blastRCAT looking good at cmp for swing.. it's going to benefit from new Drone policies

Nike - This is the bottom!💉Nike ( NYSE:NKE ) creates the bottom now:
🔎Analysis summary:
More than four years ago, Nike created its previous all time high. We have been witnessing a downtrend ever since and a correction of about -70%. But with the recent retest of an important horizontal structure and bullish confirmation, Nike is about to create a potential bottom.
📝Levels to watch:
$65, $80
🙏🏻#LONGTERMVISION
Philip - Swing Trader

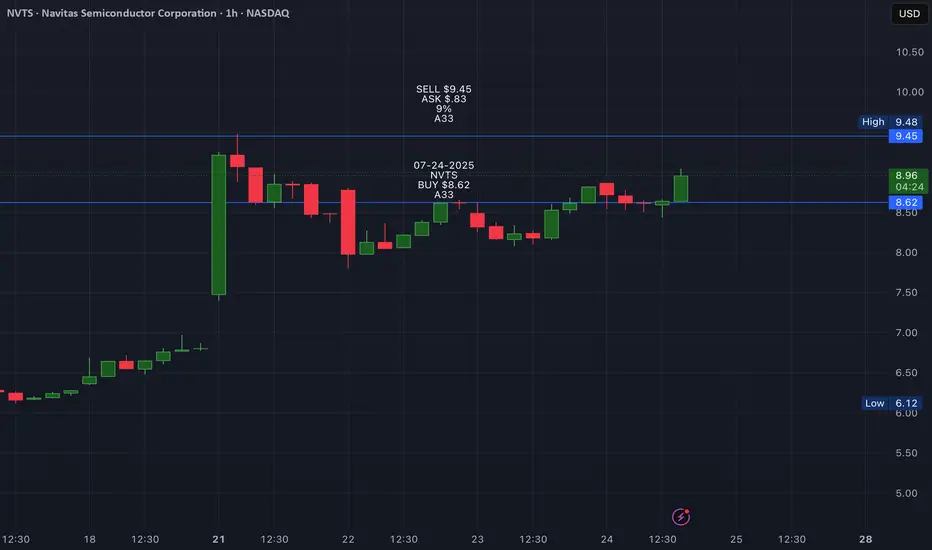
07-24-2025 BUY NVTS Navitas Semiconductor (NVTS) Surges 24.7%: Is This an Indication of Further Gains?
BUY $8.62
SELL$9.45
ASK $0.83
9%
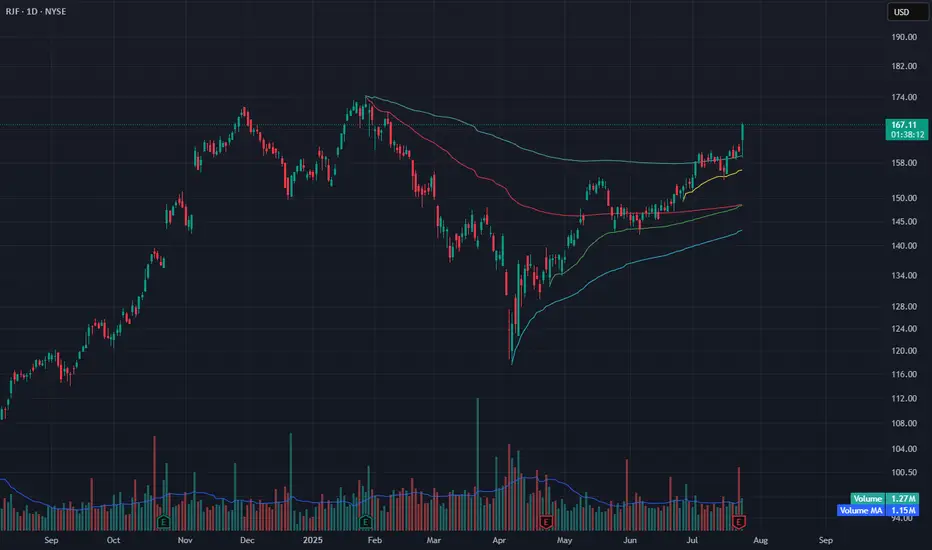
RJF Breaks Out Above Range – Fresh High on Anchored VWAP SupportRJF broke out with a strong +3.88% candle, clearing the previous range and reclaiming its upper VWAP zone. Price is now trading above all key anchored VWAP levels, with the yellow VWAP acting as near-term support.
Volume came in above average (1.27M vs. 1.15M MA), confirming demand. The breakout clears a long consolidation zone that started in February.
A sustained move above $166 opens the door for continuation toward the $172–174 zone, which lines up with the pre-breakdown highs from late 2023.
Indicators used:
Anchored VWAP (all major zones reclaimed)
Volume & Volume MA (breakout confirmation)
Trend structure
Entry idea: Hold above $166 or breakout continuation above $168
Target: $172–174
Stop: Below $158 or below yellow VWAP
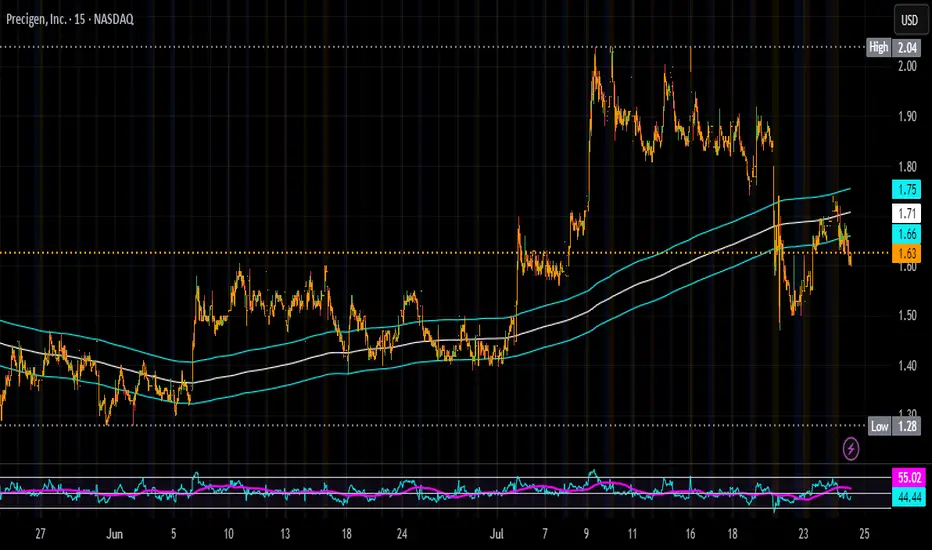
Buying More PGEN on all DipsThe market is overreacting to the NASDAQ:REPL news, and I think it’s a mistake to lump NASDAQ:PGEN in with it. Yes, PRGN-2012 is also a single-arm gene therapy trial, but it’s for an ultra-rare disease—not a broad indication like cancer. The FDA’s tougher stance seems to be focused on common diseases (like NASDAQ:REPL ’s melanoma drug), not niche, high-unmet-need therapies like Precigen’s.
Here’s why I’m loading up on this pullback:
PRGN-2012 has incredible data: 51% complete response rate, 86% reduction in surgeries (from 4 per year to zero). These patients suffer through painful, repeated procedures—this drug could be life-changing.
FDA loves it: Breakthrough Therapy, Orphan Drug, Fast Track, and Priority Review with a PDUFA date of August 27, 2025. If approved, it’ll be the first-ever treatment for RRP.
Commercial upside: Rare disease drugs have high margins, and there’s zero competition.
The sell-off is shortsighted. I’m treating this as a fire sale and buying more before the August 2025 catalyst. NASDAQ:PGEN is a high-conviction play for me.
SANA long idea SANA looks super bullish.
Im still waitinf SANA to breaking out from the main trendline. On daily it happened, and started retesting.
I think it could going much higher, till 0.618 fibo then a bit retracement till 0.382 or 0.236 but it can go straight ahead till 1.0
On the next week it could retesting the weekly candle, that is the point where I want to buy.
Or i start buying with tight SL but, i much more like if more confirmation than gambling :)
What do u think?
NFA

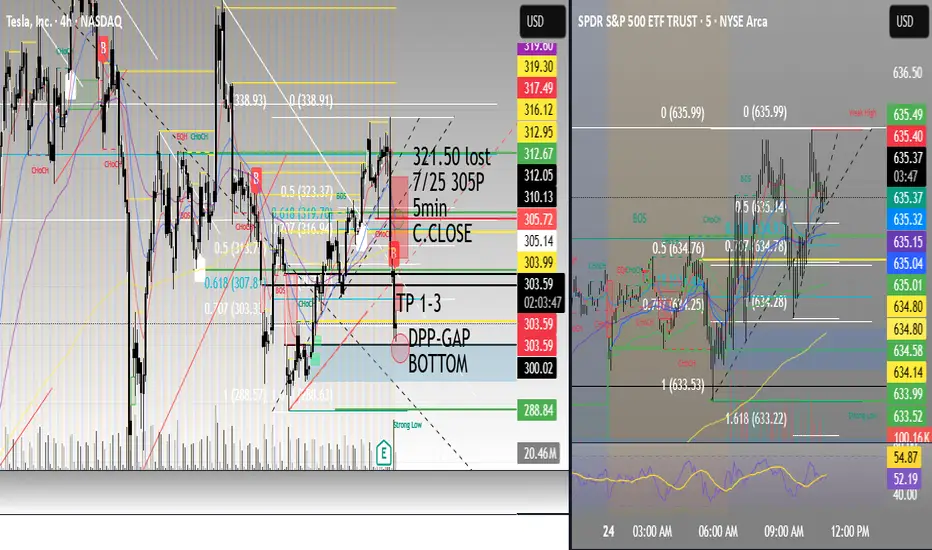
TSLA, revenue decline/textbook technical setup.TSLA, revenue decline/textbook technical setup.
Confluence of major levels, how to take a well defined short trade with puts.
Clean as it gets.
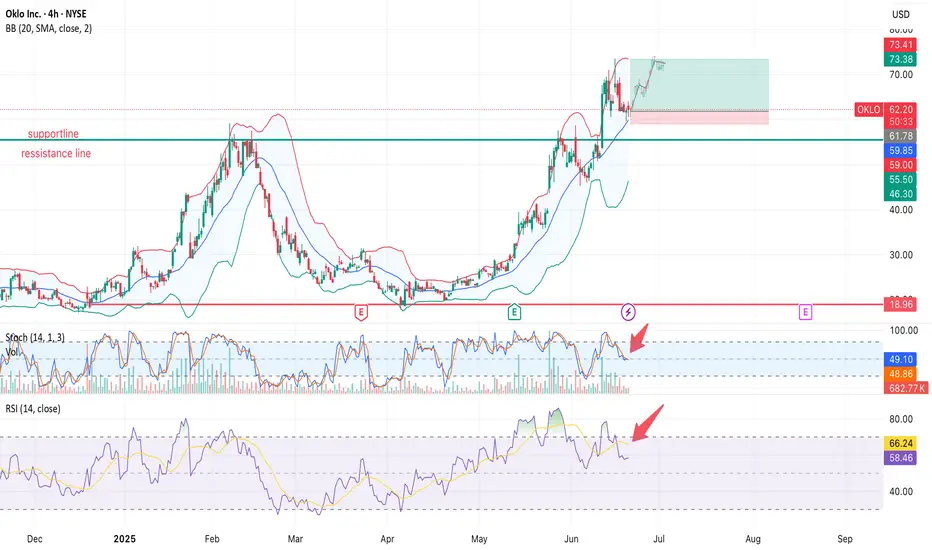
OKLO ($OKLO) — Consolidation After a Powerful Run: What’s Next?NYSE:OKLO After a +180% breakout earlier this year and a strong return above the $60–62 resistance zone, OKLO is now consolidating under $73.40. Let’s break it down 👇🔍 Technical Overview (4H chart)
• Breakout above key resistance ($59–62), which now acts as support.
• Price is consolidating in a bullish flag formation.
• Bollinger Bands are tightening — potential volatility ahead.
• Volume declining — market in a wait-and-see mode.
📉 Indicators:
• Stochastic Oscillator: curling down from 80+ zone — short-term exhaustion
• RSI: rolling over below 60 after peaking near 70 — momentum is fading
• Price Action: Still holding above support, but losing bullish strength📰 What drove the price to $55 (Feb 2025)?
• ✅ Wedbush sets $55 target, highlighting AI data center energy demand
• ✅ Q1 earnings: net loss narrowed to $0.07/share from $4.79/share
• ✅ Regulatory optimism: fast-track support for SMRs by U.S. government
📉 The following correction was largely technical (profit-taking after overextension).🚀 Why OKLO surged again to $73+ (June 2025)
• 🛡 $100M DoD contract for Aurora reactor on Eielson Air Force Base
• 💸 New capital round ($460M), backed by Bill Gates and Nvidia Ventures
• 📈 Wedbush upgrades target to $75, citing defense + AI synergy📐 What I’m Watching Now
Price remains above key support (~$61.8), but both RSI and Stoch are weakening. A breakdown below support may open the way for deeper correction — but volume will be the trigger.
📌 Break above $73.40 on strong volume could mark the next bullish leg
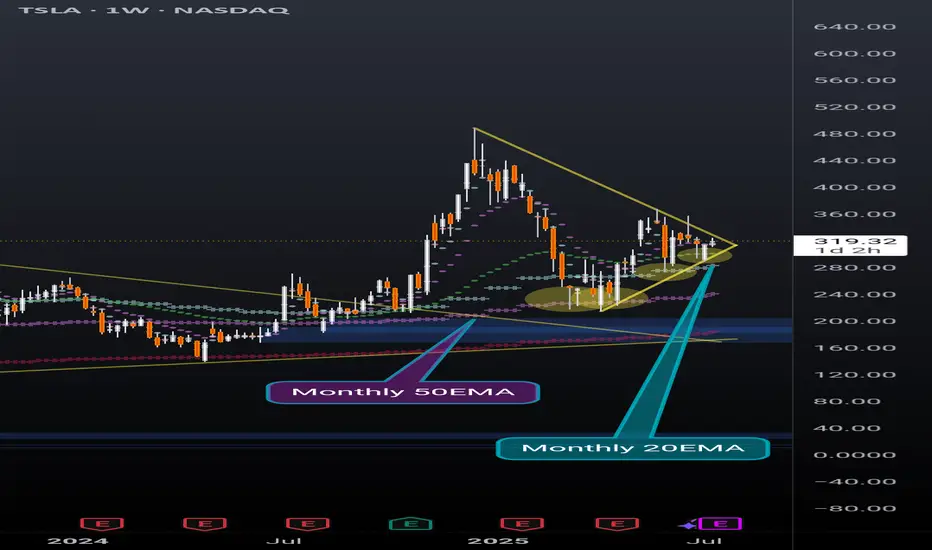
TSLA weekly coiling into something powerfulNever doubt the power of TSLA. Recently broke out of a huge pennant, and now nearing the end of another pennant while simultaneously holding support above the daily 20EMA(overlayed on this weekly chart).
Also recently found support off of the monthly 20EMA (overlayed on this weekly chart) and took 2 direct hits on the monthly 50EMA (overlayed on this weekly chart) before that and rallied up. It will take a lot to crush this setup but anything can happen. Possibly a longer pennant formation.
I'm just a cat not a financial advisor.