Don't Short MSFT. 2 long scenarios. Hi, I’m The Cafe Trader.
Today we’re diving into the heart of this very bullish run on MSFT. One of the key lessons I’ve learned:
Never get in the way of a strong bull trend — especially just after a breakout.
⸻
🔍 Price Action Overview:
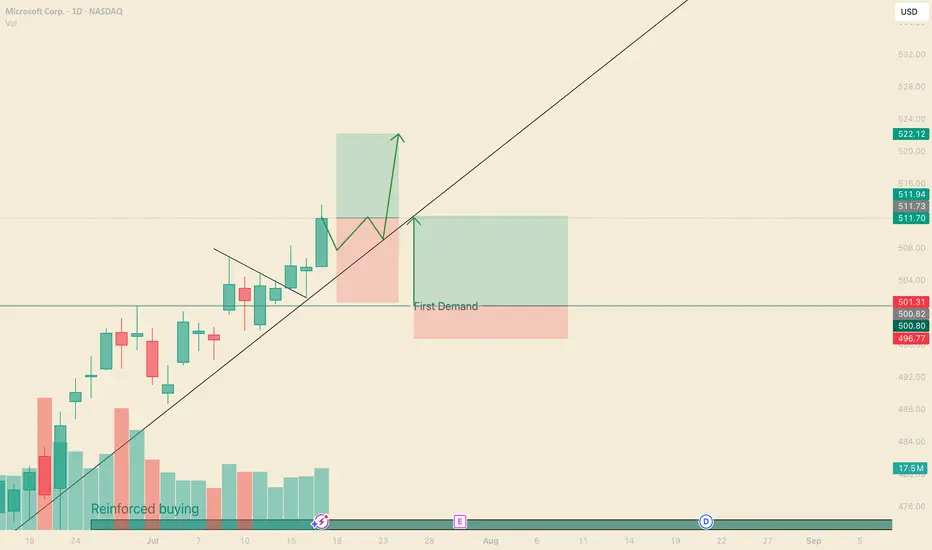
MSFT has been respecting a strong trendline since its initial gap-up.
This has created multiple breakout trade opportunities — and we’ve just spotted another one. I’ve also outlined a secondary setup worth watching.
We recently completed a 3-bar break.
Combine that with rising volume, and this suggests a potential move to $522.23.
⏳ I’m expecting a brief consolidation (2–3 trading days) before the next leg up.
⸻
🟢 Trade Setup:
• Entry: $511.70
• Risk Level: Trade remains valid until a daily close below $500
• Reward: TP at $522.23
• Risk-to-Reward: 1:1 at entry; improves with any dip before breakout
⸻
💡 Optional Trade: Swing Trading Options
Options are about two things: price and timing.
Right now, timing looks great — but option pricing is a bit high.
The key is to go from out-of-the-money to in-the-money, and to give yourself at least 5 days on your contracts.
Here are some strike prices I’m watching (assumes expiration 7/25 or later):
• $515 Call — Entry: $2.00 or less → TP: $6.00+
• $517.5 Call — Entry: $1.30 or less → TP: $3.90+
• $520 Call — Entry: $0.70 or less → TP: $2.10+
These levels give you a strong RR if you can catch the right pullback.
⸻
🔁 Secondary Trade Idea: Bounce at $500
The $500 level is both a psychological number and a reinforced demand zone.
While it overlaps with the stop on our main setup, this trade assumes MSFT pushes higher first, then retraces to $500 for a fresh leg up.
This area will likely play a key role in future price action.
If we see a pullback into this zone with contextual selling pressure, it could offer a clean high-probability bounce.
Take profit levels would depend on how price behaves as it sells into this level — but keep this area marked.
⸻
Thanks for reading — be sure to check out my other MAG 7 analysis.
@thecafetrader
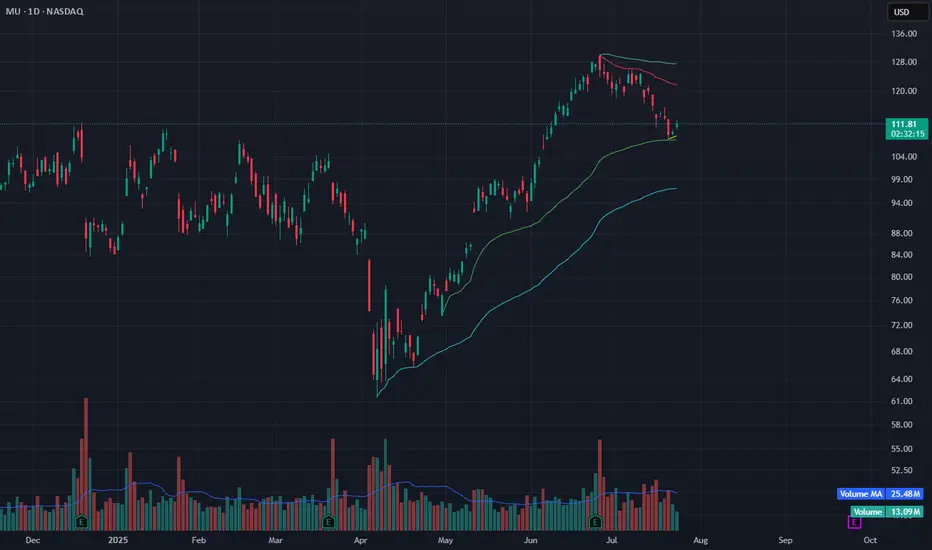
MU Bounce at VWAP Support – Eyeing Relief Toward $118MU is showing signs of a potential reversal after a multi-week pullback. Price held the anchored VWAP zone (green line) near $109 and bounced today with a +1.83% move on 13M volume.
This level also aligns with the lower Bollinger Band — a common mean-reversion setup after extended downside. A short-term bounce toward $118–120 could be in play if the move gains momentum.
Volume is below average but stabilizing. Price must stay above $109 for this bounce to hold.
Indicators used:
Anchored VWAP (support zone)
Bollinger Bands (oversold structure)
Volume + Volume MA (momentum context)
Entry idea: Bounce confirmation above $112
Target: $118–120
Stop: Below $109
RZLV formed round bottomBusiness Model: AI SaaS for retail—mobile-first, gen‑AI conversational commerce and checkout.
Financials: Very low revenue base, heavily loss-making, but building enterprise footprint and usage.
Balance Sheet: Strengthened via equity conversions, debt facility, and capital raises; dilution risk remains.
Traction: Growing client deployments across major brands; usage and GMV accelerating in 2025.
Leadership: Experienced team, led by a founder-CEO and a seasoned global CTO/product head drawn from tech‑commerce backgrounds.
Despite minimal current revenue, Rezolve AI is betting on rapid scaling through partnerships with Microsoft, Google, and enterprise clients. Execution and monetization in 2025 will be pivotal to its valuation trajectory.

GOOGL TRADE IDEA (07/24)
🚨 GOOGL TRADE IDEA (07/24) 🚨
💥 Big institutional flow. 1 DTE. High gamma = high reward (⚠️ high risk too)
🧠 Quick Breakdown:
• Call/Put Ratio: 2.44 → ultra bullish
• Weekly RSI climbing (67.3) 📈
• Daily RSI falling from 77.5 → 🔻 short-term pullback risk
• Reports split: trade or wait? We’re in.
💥 TRADE SETUP
🟢 Buy GOOGL $200 Call exp 7/25
💰 Entry: $2.09
🎯 Target: $3.14–$4.18 (50–100%)
🛑 Stop: $1.25
📈 Confidence: 70%
⚠️ Expiry in 1 day = tight execution needed. Gamma can cut both ways. Watch it like a hawk. 👀
#GOOGL #OptionsFlow #CallOption #GammaSqueeze #TechStocks #UnusualOptionsActivity #TradingView #StockAlerts #BigMoneyMoves #DayTrading #OptionsTrading

Nano Nuclear (NNE) –Powering the Future of Clean U.S. Energy 🇺sCompany Snapshot:
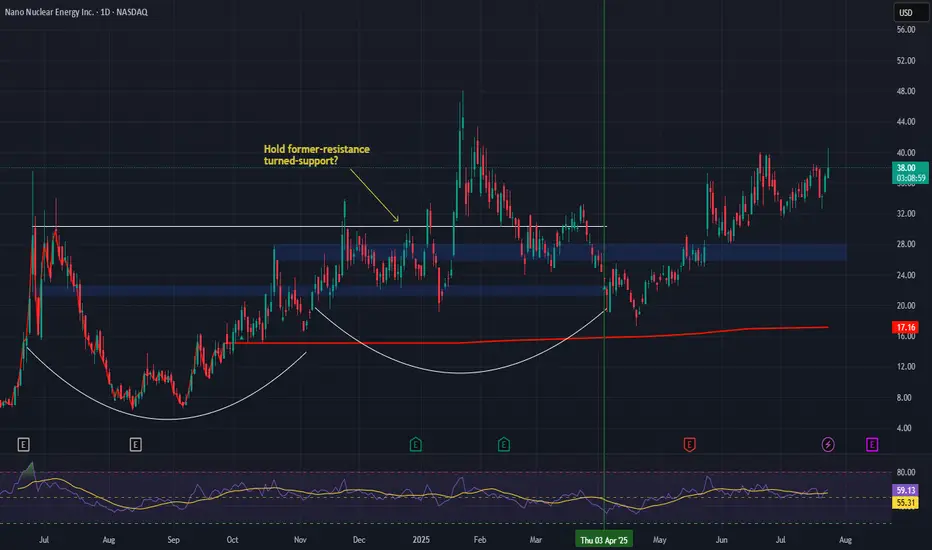
Nano Nuclear Energy NASDAQ:NNE is a pioneering U.S.-based microreactor company developing compact, modular nuclear power solutions for defense, medical, and national grid applications.
Key Catalysts:
Nuclear Innovation Meets Energy Independence 🔌
NNE is at the forefront of advanced nuclear tech, supporting America’s push toward energy resilience and decarbonization.
Its microreactors are designed for fast deployment, critical for defense bases, hospitals, and remote power needs.
Strong Market Momentum 📈
Since our initial entry on April 3rd, NNE has surged 74%, reflecting rising investor interest in nuclear solutions.
After printing a higher high, the stock is pulling back toward a key support zone.
Policy & Investor Tailwinds 📊
U.S. energy policy is increasingly focused on nuclear as a clean base-load source, giving NNE a strategic edge.
Growing institutional attention on microreactors as scalable, next-gen energy infrastructure.
Investment Outlook:
Bullish Entry Zone: $26.00–$27.00
Upside Target: $58.00–$60.00, supported by innovation, policy alignment, and long-term energy demand.
🔆 NNE is shaping up as a high-conviction play on America’s nuclear energy future.
#NNE #NuclearEnergy #Microreactor #CleanEnergy #EnergySecurity #DefenseTech #GridStability #Innovation #GreenEnergy #NextGenPower #EnergyIndependence
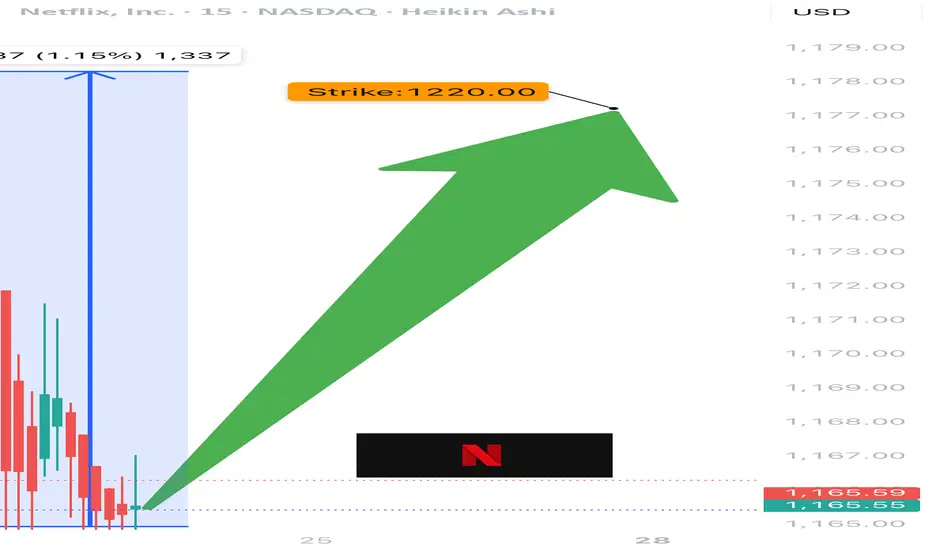
NFLX TRADE IDEA (07/24)
🚨 NFLX TRADE IDEA (07/24) 🚨
⚔️ Bulls vs. Bears… but calls are winning 🐂📈
🧠 Quick Breakdown:
• Call/Put Ratio: 1.27 → bullish edge
• RSI < 45 = 🔻oversold territory
• VIX favorable = room to run
• High gamma = big moves incoming ⚡️
• Expiry: TOMORROW = 🔥 time decay risk
💥 TRADE SETUP
🟢 Buy NFLX $1220 Call exp 7/25
💰 Entry: $0.50
🎯 Target: $0.90
🛑 Stop: $0.30
📈 Confidence: 65%
⚠️ Watch volatility closely. Fast exit = smart exit.
#NFLX #OptionsFlow #OptionsAlert #BullishPlay #DayTradeSetup #NetflixStock #TechOptions #UnusualOptionsActivity #TradingView #GammaSqueeze
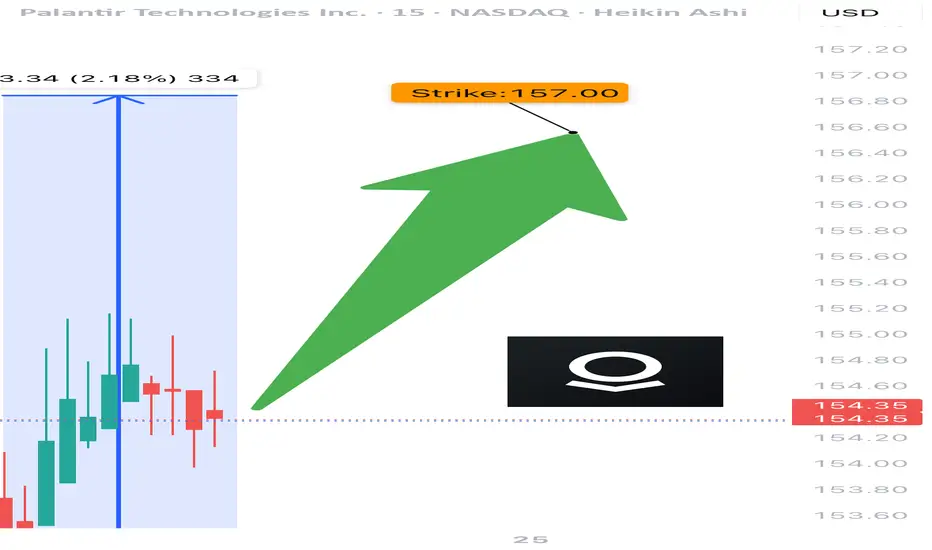
PLTR TRADE SIGNAL (07/24)
🚨 PLTR TRADE SIGNAL (07/24) 🚨
💥 Expiry in 1 day = HIGH GAMMA risk = BIG MOVES coming
🧠 Key Highlights:
• Call/Put Ratio: 1.40 → bullish options flow
• Strong institutional positioning 📈
• RSI cooling off = ⚠️ watch momentum
• Volume concerns → cautiously bullish
💥 TRADE SETUP
🟢 Buy PLTR $157.50 Call exp 7/25
💰 Entry: $0.59
🎯 Target: $0.89 (50%+)
🛑 Stop: $0.24
📈 Confidence: 65%
⚠️ Gamma + Time Decay = explosive but risky. Tight execution needed.
#PLTR #OptionsAlert #OptionsFlow #UnusualOptionsActivity #TechStocks #DayTrading #GammaSqueeze #TradingView #BullishSetup #CallOption
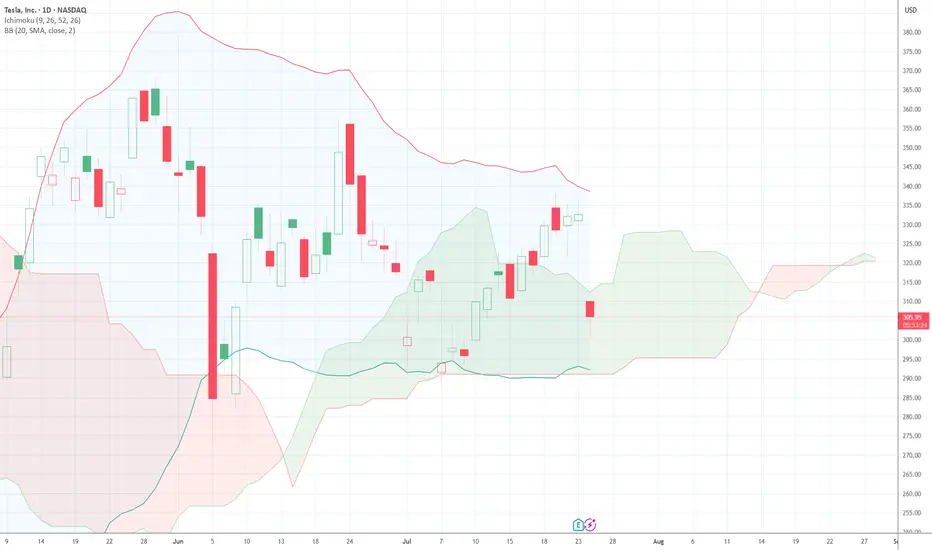
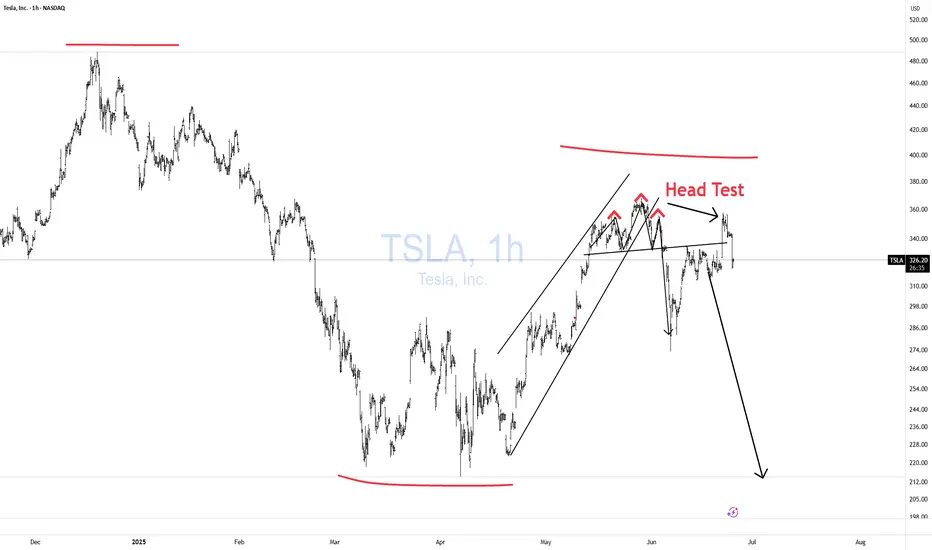
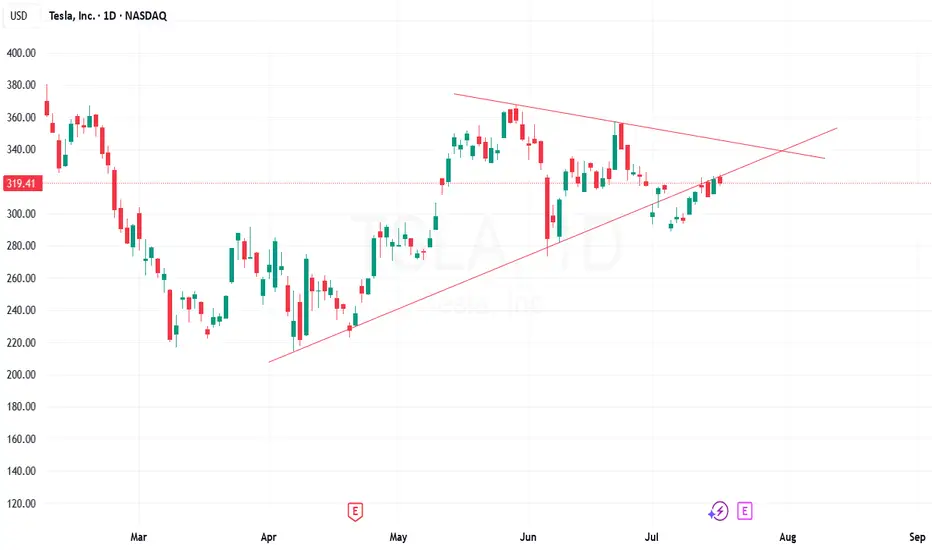
TSLA Honey Ticking Bull Trap! UPDATE 1This is an updated chart, as I keep being prompted to reach "My Target" by TV.
No matter how bad things get for Elona and TSLA, there are always people who are willing to pile in and buy at any price. The problem is the chart is showing lower highs, as TSLA no longer attracts the people needed to boost price, just like TSLA the brand. As a result, people keep getting honey ticked.
Don't Get HONEY TICKED!
As I always say, never EVER!! Invest in toxic people like Elona. They always blow themselves up in the end. It's in their nature!
Click Boost, Follow, subscribe, and let's reach 5,000 followers. ;)
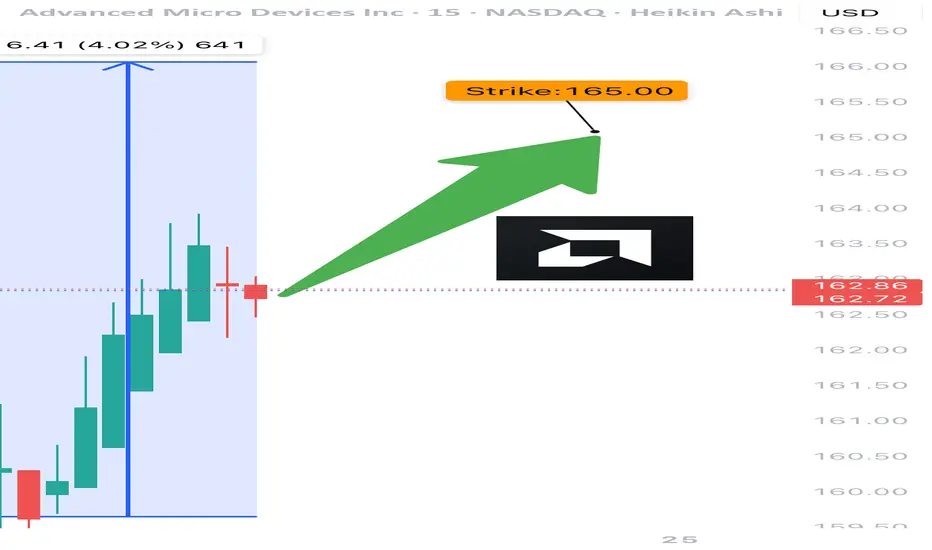
AMD TRADE ALERT (07/24)
🚨 AMD TRADE ALERT (07/24) 🚨
Options flow is screaming bullish 📈
🧠 Key Insights:
• Call/Put Ratio: 1.80 (🔥 heavy call bias)
• RSI: Daily 75.5 / Weekly 77.2 = strong momentum
• Volume = weak ⚠️ but sentiment remains bullish
• High gamma risk = explosive potential near expiry
💥 TRADE IDEA
🟢 Buy AMD $165 Call exp 7/25
💰 Entry: $0.80
🎯 Target: $1.60
🛑 Stop: $0.48
📊 Confidence: 75%
⚠️ Quick expiry = fast moves. Monitor closely.
#AMD #OptionsFlow #UnusualOptionsActivity #TradingView #OptionsTrading #BullishSetup #TechStocks #DayTrading #GammaSqueeze #OptionAlerts
Expected to go in Bearish Mode - Keep watchDaily candle clearly says, retracement from the triangle breakout line completed. It showing as reversal.

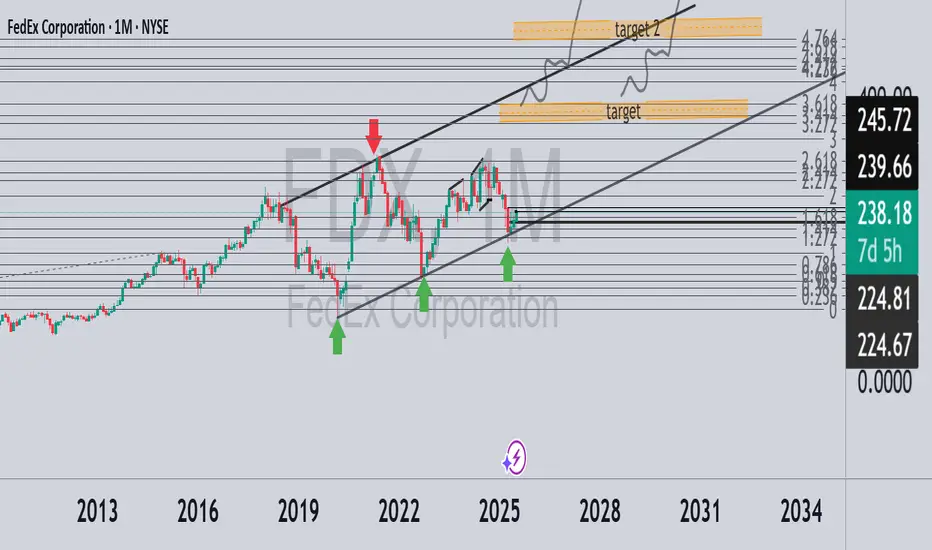
FedEx - Is the recovery process here yet? FDX The monthly chart of FedEx (symbol: FDX) shows a classic ascending channel pattern, with the price touching the bottom of the channel several times and finding support (green arrows), and on the other hand stopping several times at the upper resistance line (red arrow).
In July, we received a strong monthly candle with a jump of almost 5%, right on the central support line - which indicates the beginning of a new upward move.
🎯 Two main targets in the medium term:
Target 1: Around the 3.618 Fibonacci levels - a significant resistance area from the past. If we manage to break through it, we will continue to...
Target 2: Level 4.764 - the wider target according to the channel pattern.
✅ A clear similarity to what happened with CRWD stock in the past: there too we received a decline to support with a green monthly candle - which led to a strong breakout later.
👀 Reddit also noticed this as early as July 18, exactly at the moment when the positive deviation from the lower channel began – the first hint of a change in trend.
BYRN again looks good at cmp1. Company Profile
Byrna Technologies Inc., headquartered in Andover, Massachusetts, is a technology company within the Aerospace & Defense sector. Founded in 2005 (originally named Security Devices International), it rebranded to Byrna Technologies in March 2020
It develops, manufactures, and sells less-lethal personal security solutions, serving both consumers and professional security clients across the U.S., South America, Europe, Asia, Canada, and South Africa
2. Core Products & Innovation
Flagship Launchers:
Byrna SD: A handheld, CO₂-powered launcher with patented "first-shot pull-pierce" technology to prevent gas leakage over time.
Byrna CL (Compact Launcher): Launched in FY 2025, 38% smaller than the SD version, but still delivers comparable force. Now available via Amazon and featured prominently during Prime Day
.
Complementary Offerings:
Less‑lethal projectiles (chemical irritant, kinetic, inert rounds)
Aerosol products (like Byrna Bad Guy Repellent)
Accessories and safety gear (e.g. holsters, CO₂ canisters, sighting systems, Byrna-branded apparel)
3. Distribution Channels & Market Access
E-commerce: Direct-to-consumer via Byrna's site and Amazon store.
Dealer Programs: Side Hustle dealer network and premier dealers.
Retail Partnerships: High‑impact "store‑within‑a‑store" rollouts with Sportsman’s Warehouse. Expanded from 11 pilot locations in early 2025 to plans for 50 by year-end and 100 by end of 2026
.
4. Growth, Financial Performance & Capital Structure
Top-Line Growth:
Q1 2025 revenue: $26.2M (+57% YoY)
Q2 2025 revenue: $28.5M (+41% YoY)
Profitability & Margins:
Q2 2025 net income: $2.4M, gross margin: ~62%
Q1 2025 EPS: ~$0.07; marked improvement from breakeven prior periods
Balance Sheet & Cash Position:
As of May 31, 2025: Cash & marketable securities ~$13M, debt-free, with increased inventory ahead of new product launches.
As of March 31, 2025: Total assets ~$77M, total liabilities ~$17M, and shareholders’ equity ~$60M
Stock Titan
7. Key Strengths & Risks
✅ Strengths
No debt and improving cash generation.
Rapid revenue growth and turning consistently profitable quarter-over-quarter.
Diversified sales channels: DTC, retail, dealers, international.
Strong brand-building through influencers and multi-channel presence.
Scalable and increasingly domestic supply chain ensures quality and reliability.
⚠️ Risks
Reliance on celebrity-driven marketing and consumer sentiment.
Regulatory uncertainty in jurisdictions restricting less-lethal devices (e.g. New York City).
Potential classification or reclassification of devices under stricter legal regimes.
Inventory-heavy balance sheet could burden liquidity if demand slows.
Short interest (~12%), indicating bearish sentiment among some traders. Recent share float ~22.7M shares outstanding
📌 Summary
Byrna Technologies operates at the intersection of technology, security, and consumer convenience, offering innovative less-lethal defense products that bridge the gap between traditional firearms and personal safety devices. With strong financial momentum, strategic retail expansion (Sportsmans’ Warehouse and physical stores), and powerful branding via influencers, the company is positioning itself for accelerated growth.

Top 4 Buy Signals Lighting Up Mastercard (MA) 🚀 Top 4 Buy Signals Lighting Up Mastercard (MA) | Rocket Booster Strategy
Mastercard Inc. (MA) is showing explosive potential, and it’s not just one signal—it’s a whole confluence of confirmations. When
you align this much market momentum, you don’t ignore it. Let’s break down how Rocket Booster Strategy gives us a powerful buy indication on the daily chart.
🔍 The Confluence Setup
✅ 1. DMI Buy Signal
The Directional Movement Index (DMI) is in bull mode. ADX is
rising and the +DI is firmly above -DI. This shows the trend is not just alive—it’s gaining strength.
🔻 2. Volume Oscillator Pullback
While Volume Oscillator is down, this is seen as constructive and not bearish. It suggests a quiet zone before the thrust—just like fuel loading before a rocket launch.
Smart traders know: momentum can build silently.
💥 3. Awesome Oscillator = Strong Buy
The Awesome Oscillator is green and firing hard. We’ve seen a clear twin-peak bullish formation followed by a break above zero
—classic acceleration sign.
🕯️ 4. Rising Window (Japanese Candlestick Pattern)
A Rising Window—a bullish continuation gap—has formed. This is one of Steve Nison’s top continuation patterns. It signals strong
institutional conviction in this trend.
📈 What Does This Mean?
When DMI, AO, candlestick patterns, and our own Rocket Booster Strategy all point up, it’s time to pay attention. This setup is rare—and high-probability.
🧠 Rocket Booster Strategy Recap
This strategy uses 3 momentum alignment points:
High Momentum Indicator (like AO) in Buy Mode
Pattern Confirmation (Rising Window or Engulfing)
Volume Correction Before Breakout (Fuel Before Fire)
When all 3 click into place, we have ignition.
🎯 Final Thoughts
Mastercard is looking primed for takeoff on the daily timeframe. Whether you’re an investor or a swing trader, this chart is
speaking loud and clear. But as always, risk management is your co-pilot.
✅ Add it to your watchlist.
🚀 Simulate entries.
🧠 Trust the confluence.
Rocket Boost This Content To Learn More
Disclaimer: This is not financial advice. Always use a simulation/demo account before committing real capital. Trade responsibly.

i am long on ONTOOnto Innovation, Inc. (NYSE: ONTO) is a mid-cap company in the semiconductor equipment sector, offering metrology, defect inspection, lithography tools, and software for chipmakers
It’s been a volatile stock, down ~53% over the past year, with its 52‑week range at about $85.88–$228.42
Average Wall Street target: ≈ $135–142, suggesting ~40–46% upside from the ~$98 current price.
Low edge: $90 — implies ~10% downside.
High edge: $190 — implies nearly +94% upside.
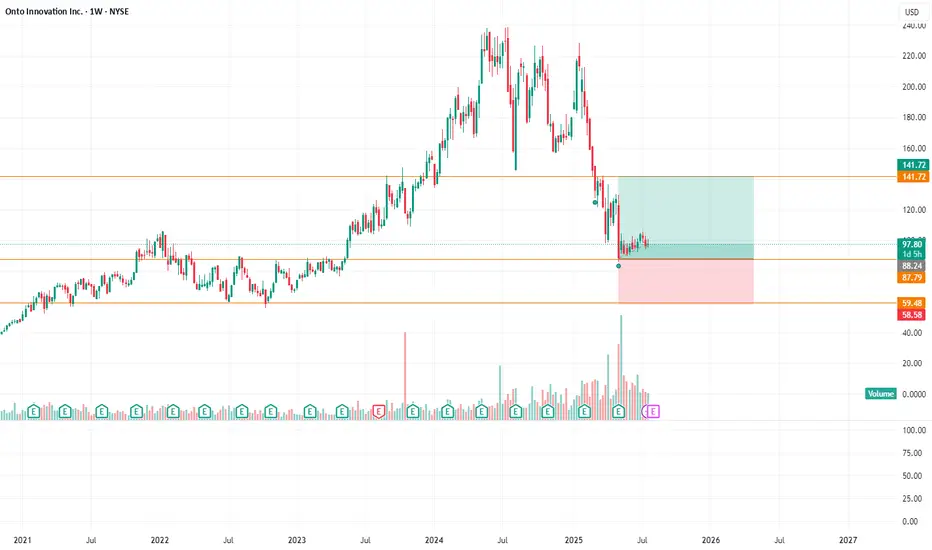
Bullish flow I grabbed the 15c Jan today chart setup looks good I know there's an active lawsuit going on DYOR but the flow calls have been active. Add to your watchlist atleast incase we get a dump.
Visa: Waiting in the Wings Visa has entered a phase of sideways consolidation — but this does not affect our primary scenario. We continue to see the stock moving within magenta wave , which is expected to complete the larger turquoise wave 4 inside our turquoise Target Zone between $308.09 and $292.19. After that, we anticipate a renewed upward impulse. Turquoise wave 5 should then push the stock beyond the resistance levels at $375.51 and $394.49. Meanwhile, we are keeping two alternatives on our radar. The first has a 35% probability and assumes the correction is already over, meaning turquoise wave alt.4 is complete. The second is a more bearish scenario (32% probability) visible on the daily chart. It suggests that the high of green wave alt. may already be in, which would imply that the ongoing alt. wave is headed toward a lower low below the $234.30 support level.
📈 Over 190 precise analyses, clear entry points, and defined Target Zones - that's what we do (for more: look to the right).

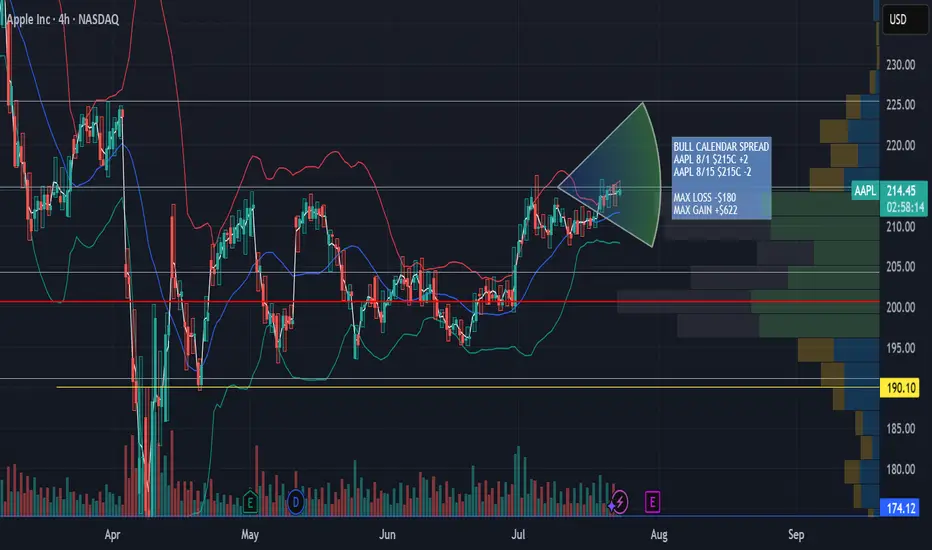
AAPL Aug 1st - Aug 8th 215 Calendar Call SpreadAAPL Aug 1st - Aug 8th 215 Calendar Call Spread
AAPL earnings after market close 7/31/25. Looking for an upward move into earnings with resistance at $225 then retesting support at $215. This zone falls between the .5 and .618 fib retracement. Great risk/ reward ratio 3.5:1
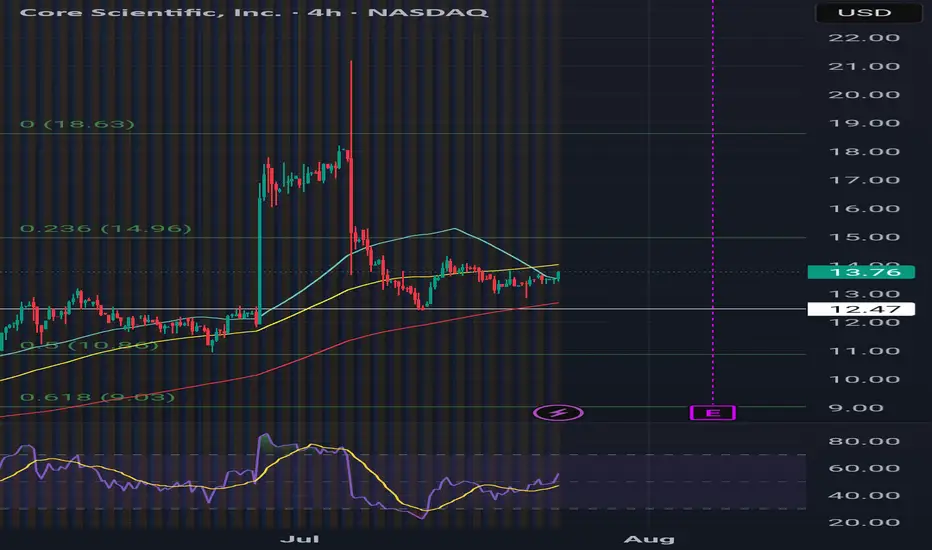
7/23/25 - $btog - Back at it7/23/25 :: VROCKSTAR :: NASDAQ:BTOG
Back at it
- not much to say except this thing holds about 70c worth of CRYPTOCAP:DOGE
- CRYPTOCAP:DOGE < $BTC. let's get that out of the way
- i certainly don't think a "doge" or "eth" or "sol" or whatever crapcoin treasury company is similar to MSTR. again let's get that out of the way
- but you're basically buying the inevitable DOGE ETF here at something like 15% off, (for now spot can always go lower)
- will keep my finger off the trigger if i focus on my NYSE:FI buy today (now up to 20% size from minuscule y day) and now i'm trading this thing (for fun)
V

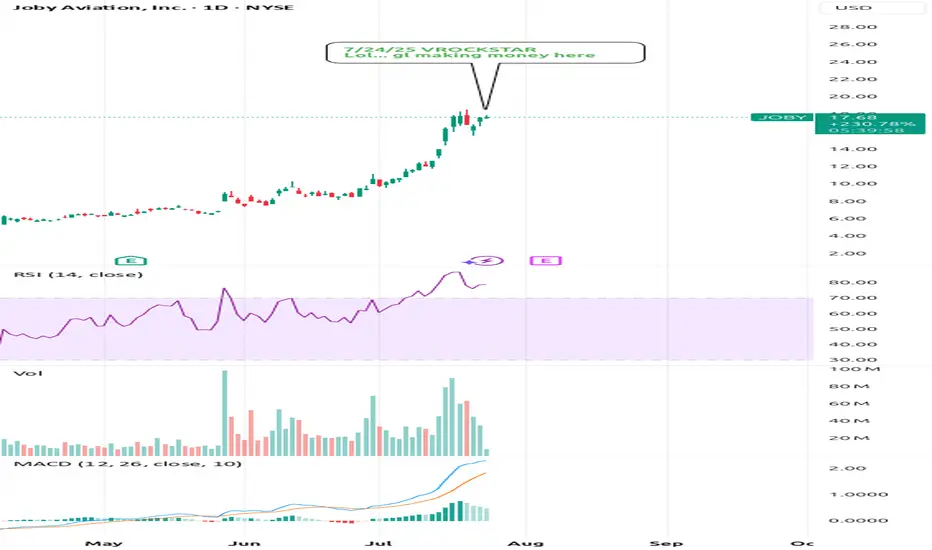
7/24/25 - $joby - Lol... gl making money here7/24/25 :: VROCKSTAR :: NYSE:JOBY
Lol... gl making money here
- have long followed the evtol "space" which is a bit more quantum-mechanical in nature... because it "is here" and also "not here"
- will be a long wait here
- somehow retail $ has allowed story tellers to write season after season of "wait and trust me bro" and this is no exception
- perhaps they are a winner
- but this valuation doesn't even require an explanation, sorry (heuristics, and i could get into it if anyone is genuinely curious and not going to just write silly short retorts - happy to debate)
- with that being said this will likely find it's way right back to the single digits, sooner vs later
- welcome to the short portfolio JOBY... you're joined with 10 other small positions that should make you feel like part of the club. i keep em small, so emotion stays ice cold, and when i run em big, i will make a comment. but until then. comfy short here, almost a lobotomized position for a hedge to my long book in this whacky tape
V
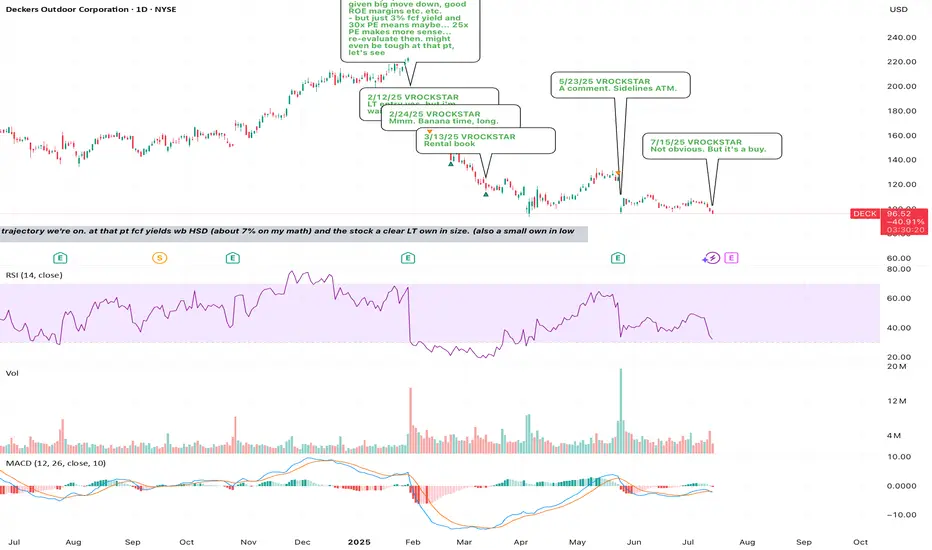
7/15/25 - $deck - Not obvious. But it's a buy.7/15/25 :: VROCKSTAR :: NYSE:DECK
Not obvious. But it's a buy.
- will reiterate that i'm not on tape so closely this week, but will revert w any comment replies by next week; nevertheless i'm checking in here on the tape
- see what T did today on NVDA/ China?
- you think it's easier or harder to resolve some of these discretionary names in the meanwhile vs. nvda H20s to China?
- exactly.
- even NKE put up pretty barfy numbers and the stock was like well... who cares
- i think we're reaching that point with NYSE:DECK here after seeing NYSE:NKE , then reading between the lines on NASDAQ:NVDA ->consumer/discretionary tariffs etc. etc.
- rates will come down, the consumer is tapped out, new fed chair on deck etc. etc.
so the way I'm playing this:
i've bought some ITM calls for aug 15 expiry. why? because it allows me to get proper MSD size (3-4%) but pay only 30-40 bps (10x leverage). the thinking is this... if stock pukes on this result, i'm high conviction that 80% scenario i'd want to load TF up. and if it rips/ or if T has a favorable bowel movement in the meantime... this will rip and off the *extreme* (remember - extreme positioning always gets you the best rewards... but TA doesn't tell you where the bottoms are as much as fundamentals IMVVVHO)... then you get a double whammy and stock is back in the $110s+. so the R/R is v good. but i don't want to get crushed if the stock/ macro work against me and need some wiggle room.
eye'ing LULU too.. but i like valuation and R/R on NYSE:DECK better esp given the NYSE:NKE print and their multiple-brand-multiple-disty strategy vs. say lulu's own-disty strategy.
V
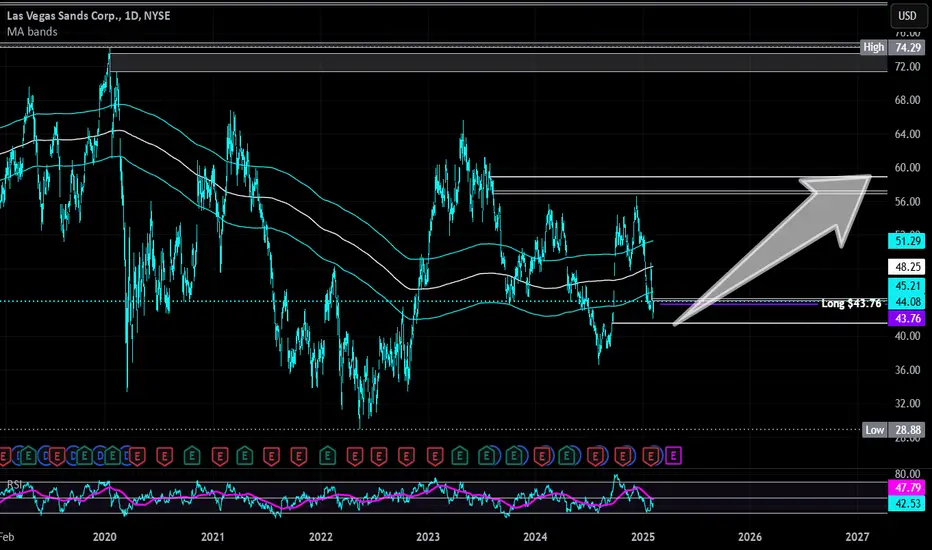
Las Vegas Sands | LVS | Long at $43.76Pros:
Earnings are forecast to grow 13.29% per year
Earnings grew by 18.4% over the past year
2.3% dividend yield
Cons:
Insider selling and exercising of options
Debt-to-equity ratio of 3.8x
Small price gap on the daily chart near $41 that may close prior to a move up.
If people can't buy houses, they will travel... thus, at $43.76, Las Vegas Sands NYSE:LVS is in a personal buy zone.
Targets
$50.00
$57.00
$59.00
$TSLA Bad earnings reactionI was lucky to sell before earnings. Rebuying here. NASDAQ:TSLA had a bad earnings reaction, but otm calls getting bought at the open today 8/8 315c @8.3 for $2 million