RDDT break out sling shotEntry Trigger: Entry above $149.95 with strong volume
Technical Indicators:
-RS = 91
-clear uptrend
-contracting volume before breakout
-Fundamentals Last 3 quarters show rising EPS and sales
Play
Stop Loss Below the breakout candle
Target Minimum 2.5R / ride the EMA
Sell in to strenght nex pivot 165,05

AMZN: Daily Trend Change with Bullish Continuation Setup
🗓 Published: June 26, 2025
📍 Ticker: NASDAQ:AMZN – Amazon.com Inc.
🕒 Timeframes: Daily & 4H
📊 Technical Bias: Bullish
📈 Trend: Higher Highs & Higher Lows
🧠 Analysis Summary
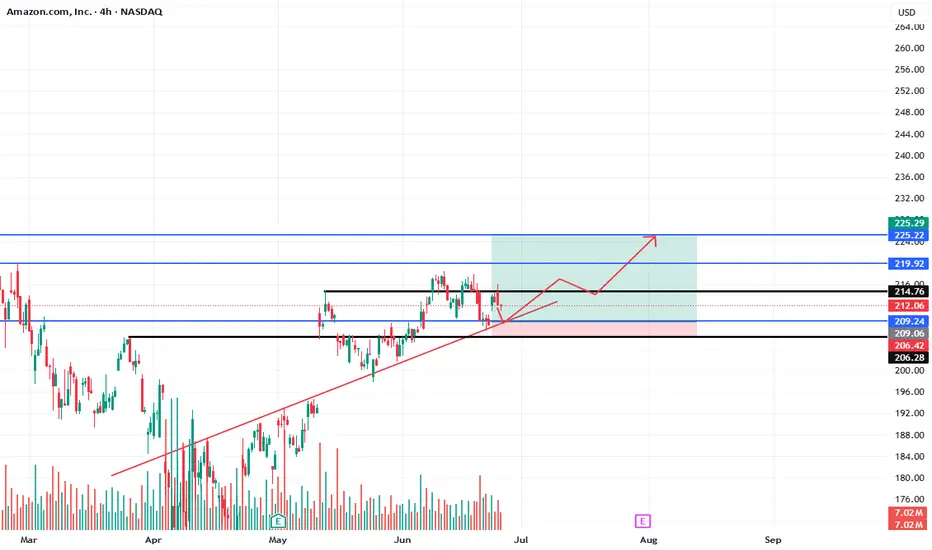
Amazon has successfully reclaimed a bullish market structure on the daily chart by forming higher highs and higher lows since late April. Price is now retesting a key support zone around $209–$212, which aligns with both horizontal support and the rising trendline.
On the 4H chart, the price is stabilizing near the trendline support, offering a high-probability long entry setup if the current structure holds.
📍 Key Levels
Price Level Description
206.28–206.42 Key support zone (invalidation area)
209.06 Local demand area
212.06 Retest level, potential entry
214.76 Local high / minor resistance
219.92 Intermediate target zone
225.22–225.29 Main bullish target / resistance
✅ Trade Setup
Entry Zone:
🔵 Long between $209.00 – $212.00 on confirmation of support
Take Profit Targets:
TP1: $214.76
TP2: $219.92
TP3: $225.22–225.29
Stop Loss:
🔴 Below $206.00 (break of structure + trendline invalidation)
Risk:Reward Potential: ~1:2.5
🔍 Confluence Factors
Daily trendline acting as dynamic support
Demand zone overlap at $209
Volume spike near base, suggesting buyer interest
Higher low formation + potential breakout of local range
⚠️ Risk Note
Only valid if price holds the $209–$212 demand area. If $206.00 is broken with strong bearish candles, the long setup is invalidated and a reassessment is required.
💬 Do you think AMZN will reclaim $225 by earnings? Let me know your outlook!
🚀 Stay patient, follow price structure, and manage your risk properly.
Rendon1
EV Stocks Are Back on Track: Who’s Got the Juice in 2025?This year is big for the EV sector so we figured let’s do a piece on it and bring you up to speed on who’s making moves and getting traction — both in the charts and on the road.
What we’ve got here is a lean, mean lineup of real contenders. Let’s go for a ride.
🚗 Tesla: Still King of the Road (for Now)
Tesla NASDAQ:TSLA isn’t just an EV company. It’s a tech firm, an AI shop, a robotaxi rollout machine, and an Elon-flavored media event every quarter. Even so, when it comes to margins, global volume, and name recognition, Tesla is still the benchmark everyone else is chasing.
In 2025, Tesla’s bounceback is fueled not just by EV hype but by its push into autonomous driving and different plays into the AI space.
The stock is down about 13% year-to-date. But investors love a narrative turnaround. Apparently, the earnings update didn't help the situation as shares slipped roughly 5%. Well, there's always another quarter — make sure to keep an eye on the Earnings Calendar .
🐉 BYD: The Dragon in the Fast Lane
BYD 1211 is calmly racking up sales, expanding across continents, and stealing global market share without breaking a sweat. The Chinese behemoth is outselling Tesla globally and doing it with less drama and more charge… literally .
Vertical integration is BYD’s secret weapon — they make their own batteries, chips, and even semiconductors. The West might not be in love with BYD’s designs, but fleet operators and emerging-market governments are. And that’s where the real growth is.
⛰️ Rivian: Built for Trails, Not Earnings (Yet)
Rivian NASDAQ:RIVN still feels like the Patagonia of EV makers — rugged, outdoorsy, aspirational. Its R1T pickup truck has cult status, but the company had to tone down its ambitions and revised its guidance for 2025 deliveries to between 40,000 and 46,000. Early 2025 projections floated around 50,000 .
The good news? Rivian is improving on cost control, production pace, and market fit. The bad news? It’s still burning cash faster than it builds trucks. But for investors betting on a post-rate-cut growth stock rally, Rivian may be the comeback kid to watch. It just needs a few solid quarters.
🛋️ Lucid: Luxury Dreams, Reality Checks
Lucid NASDAQ:LCID , the one that’ll either go under or make it big. The luxury carmaker, worth about $8 billion, came into the EV game promising to out-Tesla Tesla — with longer range, more appeal, and a price tag to match.
But here’s the rub: rich people aren’t lining up for boutique sedans, especially when Mercedes and BMW now offer their own electric gliders with badge power and a dealer network.
Lucid’s challenge in 2025 is existential. The cars are sleek, the tech is strong, but the cash runway is shrinking and demand isn’t scaling like the pitch deck promised.
Unless it nails a strategic partnership (Saudi backing only goes so far), Lucid could end up as a cautionary tale — a beautifully engineered one, but a cautionary tale nonetheless. Thankfully, Uber NYSE:UBER showed up to the rescue ?
💪 NIO : Battling to Stay in the Race
Remember when NIO NYSE:NIO was dubbed the “Tesla of China”? Fast forward, and it’s still swinging — but now the narrative is more about survival than supremacy. NIO's battery-swap stations remain a unique selling point, but delivery volumes and profitability are still trailing.
The company’s leaning into smart-tech partnerships and next-gen vehicle platforms. The stock, meanwhile, needs more than just optimism to get moving again — it’s virtually flat on the year.
✈️ XPeng: Flying Cars, Literally
XPeng’s NYSE:XPEV claim to fame used to be its semi-autonomous driving suite. Now? It's working on literal flying vehicles with its Land Aircraft Carrier. Innovation isn’t the problem — it's execution and scale.
XPeng is beloved by futurists and punished by spreadsheets. It’s still getting government love, but without a clear margin path, the stock might stay grounded.
🏁 Li Auto: The Surprise Front-Runner
Li Auto NASDAQ:LI doesn’t get the headlines, but it’s quietly killing it with its range-extended EVs — hybrids that let you plug in or gas up. A smart move in a country still building out its charging infrastructure.
Li is delivering big numbers, posting improving margins, and seems laser-focused on practicality over hype. Of all the Chinese EV stocks, this one might be the most mature.
🧠 Nvidia: The Brains of the Operation
Okay, not an EV stock per se, but Nvidia NASDAQ:NVDA deserves a spot on any EV watchlist. Its AI chips are running the show inside Tesla’s Full Self-Driving computers, powering sensor fusion in dozens of autonomous pilot programs, and quietly taking over the brains of modern mobility.
As self-driving becomes less sci-fi and more of a supply-chain item, Nvidia's value-add grows with every mile driven by data-hungry EVs.
🔋 ChargePoint & EVgo: Picks and Shovels
If you can’t sell the cars, sell the cables.
EV charging companies were once seen as the “safe bet” on electrification. Now they’re just seen as massively underperforming.
ChargePoint BOATS:CHPT : Still the leader in US charging stations but struggling with profitability and adoption pacing. Stock’s down bad from its peak in 2021 (like, 98% bad).
EVgo NASDAQ:EVGO : Focused on fast-charging and partnerships (hello, GM), but scale and margin pressures remain.
Both stocks are beaten down hard. But with billions in infrastructure funding still flowing, who knows, maybe there’s potential for a second act.
👉 Off to you : are you plugged into any of these EV plays? Share your EV investment picks in the comments!

Time to buy? Too much negative press. Buy in Fear- Updated 18/7Apple has significantly underperformed compared to the other Magnificent 7 stocks, but I don’t believe it’s a company you should bet against in the current climate. With a slow rollout of AI and recent statements from Apple, they may not always be first to market, but they generally execute well. The remarks regarding Sony, Samsung, and Netflix by Apple were very revealing and demonstrate a solid long-term strategy. However, there may be some bumps along the way as they work toward their goals, potentially involving acquisitions.
The fear spread in the media is similar to the FUD (fear, uncertainty, doubt) often associated with Bitcoin, and this is typically a good time to buy. Remember the saying: if retail investors miss the boat, it’s gone, but if institutions miss it, they often bring the boat back.
While this is not financial advice, based on the green weekly candle, it's hard not to pay attention, and Apple may now have a very positive year ahead! Especially with the weakening dollar and reports stating that this will benefit them greatly.
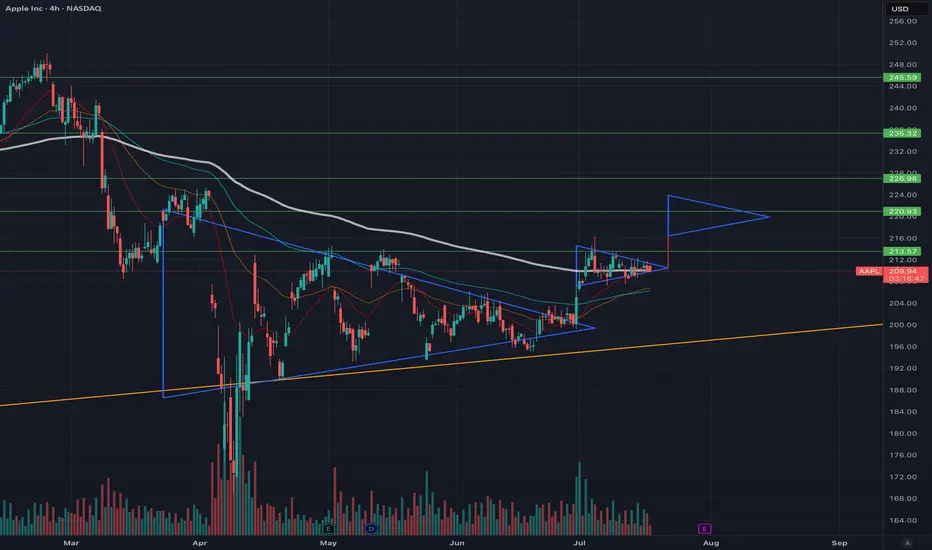
Apple has been consolidating in the 210 USD region, forming a smaller flag pattern that is nearing completion. Based on this previous pattern, the next upward move is expected to reach >$220, where consolidation will likely begin again. With Apple’s earnings rapidly approaching and stronger-than-expected results anticipated, July and August could be very positive months for Apple holders.
A golden cross appears likely, with the 50-day EMA just $5.50 below the 200-day EMA. This would be very bullish for Apple and could trigger significant interest from both institutional and retail investors. Additionally, Apple has been lagging behind the other “Magnificent Seven” stocks, experiencing considerable selling pressure; however, this trend is now reversing. Apple is shaping up to be a good short-term and long-term hold.
Quick View : $RBAShort setup here on the hourly chart.
Bearish crossover with large price action that pulled back to the ema 50.
Bearish ATR Alert popped out.
Ready To Catch It

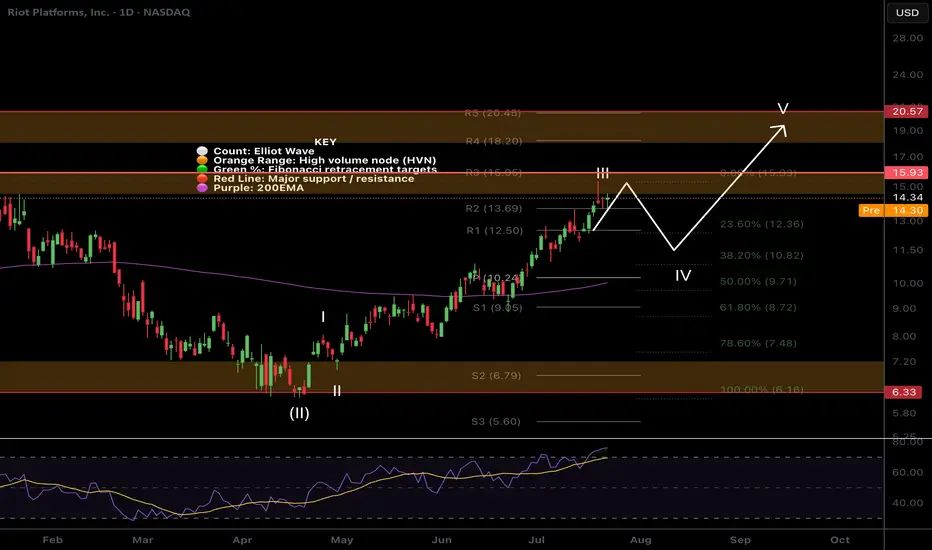
$RIOT Targets hitNASDAQ:RIOT has hit my take profit target at the High Volume Node and R3 daily pivot where it has found resistance.
Wave III appears to be complete with wave IV expected targets being the 0.382-0.5 Fibonacci retracement, also the daily pivot point and ascending daily 200EMA, $10.24.
Analysis is invalidated if we continue to the upside with a new swing high. RSI is overbought no bearish divergence.
Safe trading
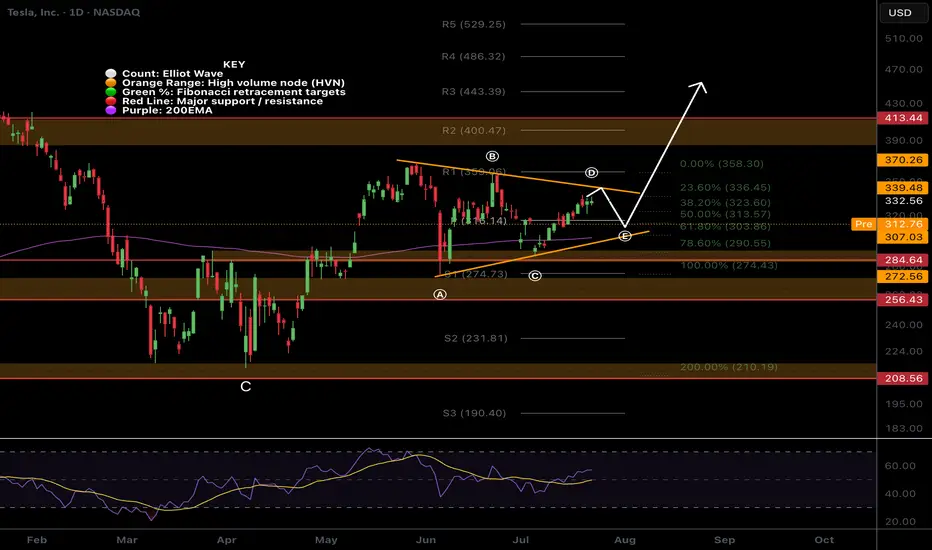
$TSLA Triangle?NASDAQ:TSLA triangle has presented itself with the recent price action. Triangle pattern target is $443 at the R3 daily pivot.
Wave e is expected to end at the daily pivot and wave d break is the signal to go long.
Analysis is invalidated below wave c.
Tesla Shares (TSLA) Drop Following Earnings ReportTesla Shares (TSLA) Drop Following Earnings Report
Yesterday, after the close of the main trading session on the stock market, Tesla released its quarterly earnings report. While both earnings per share (EPS) and gross profit slightly exceeded analysts’ expectations, the results reflected a negative trend driven by declining sales. This decline is being influenced by intensifying competition from Chinese EV manufacturers as well as Elon Musk’s political activity.
According to Elon Musk:
→ The company is facing “a few tough quarters” due to the withdrawal of electric vehicle incentives in the US;
→ The more affordable Tesla model (mass production expected in the second half of 2025) will resemble the Model Y;
→ By the end of next year, Tesla's financials should become "highly compelling".
Tesla’s share price (TSLA) fell by approximately 4.5% in after-hours trading, clearly reflecting the market’s reaction to the report. Today, the stock is likely to open around the $317 level, down from over $330 just the day before.
Technical Analysis of TSLA Stock Chart
In our analysis of TSLA charts dated 2 July and 8 July, we outlined a scenario in which the stock price could form a broad contracting triangle, with its axis around the $317 level.
The new candlesticks that have appeared on the chart since then have reinforced the relevance of this triangle, as the price rebounded from the lower boundary (as indicated by the arrow) and headed towards the upper boundary. However, yesterday’s earnings report disrupted this upward move.
Thus, while the broader stock market is trending higher (with the S&P 500 reaching a historic high yesterday), TSLA may remain "stuck" in a consolidation phase, fluctuating around the $317 level—at least until new fundamental drivers shift market sentiment.
This article represents the opinion of the Companies operating under the FXOpen brand only. It is not to be construed as an offer, solicitation, or recommendation with respect to products and services provided by the Companies operating under the FXOpen brand, nor is it to be considered financial advice.

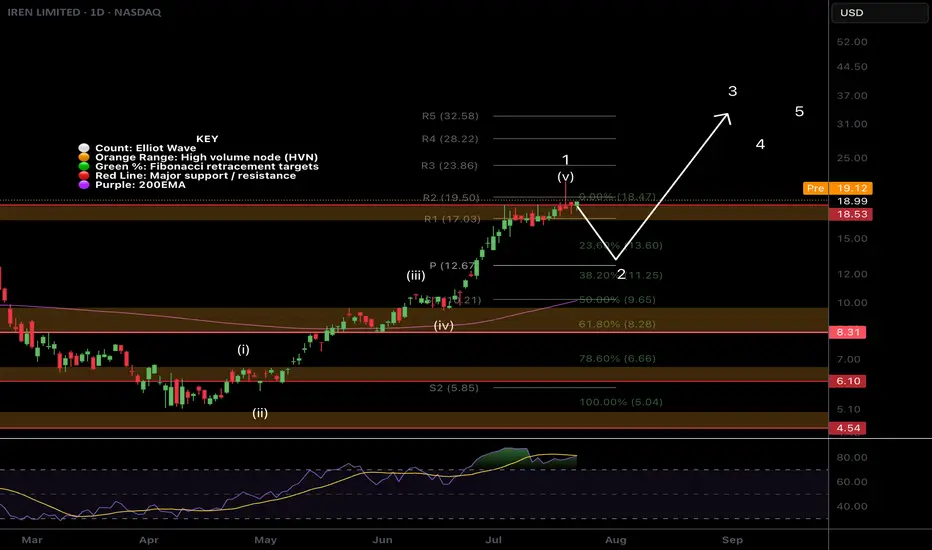
$IREN More downside after huge rally!NASDAQ:IREN is printing bearish divergence on the daily RSI at all tie high resistance.
An Elliot wave motif wave appears complete and wave looks underway with a shallow target of the daily pivot, 0.382 Fibonacci retracement and ascending daily 200EMA.
The daily red wick after printing a 20% start to the day is reminiscent of a blow off top in this asset trapping newbs with FOMO price discovery pump. Market behaviour in action!
Analysis is invalidated if price returns to all time high.
Safe trading
Quick View : $EWBCShort setup here
Bearish crossover on the hourly chart with double top at $110.
The price already crossed the level and made its FAST pullback.
I expect a sharp action here.
Bearish ATR Alert ready.
Reaty To Catch It

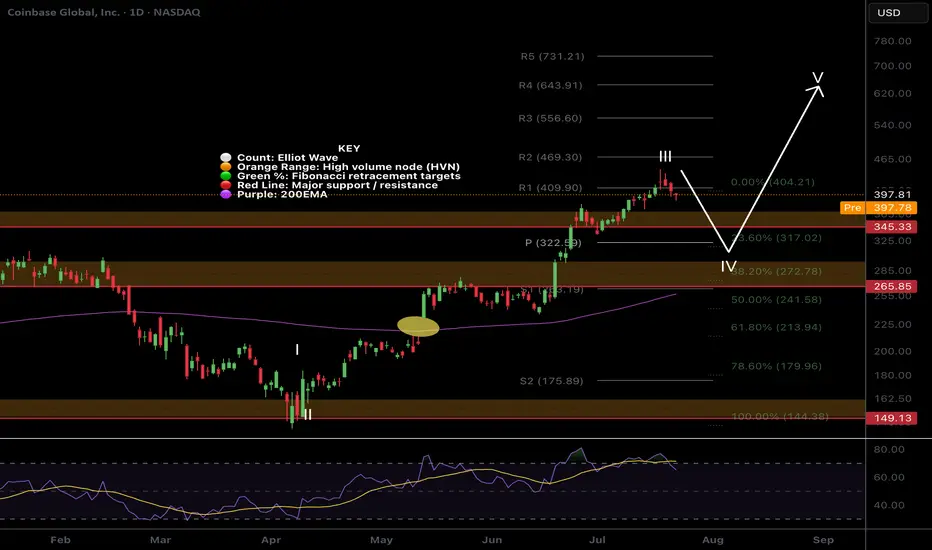
$COIN Wave 4 pullback?NASDAQ:COIN had a tremendous run, a text book Elliot wave 3 but has confirmed bearish divergence on the daily RSI.
The trend is strong so wave 4 could be shallow, only reaching the previous all time high, High Volume Node and 0.236 Fibonacci retracement and daily pivot point between $322-345
Further decline brings up the High Volume Node support at 0.382 Fib retracement and ascending daily 200EMA! Also a highly probable scenario!
Long term outlook remains around $600 target
Safe trading.
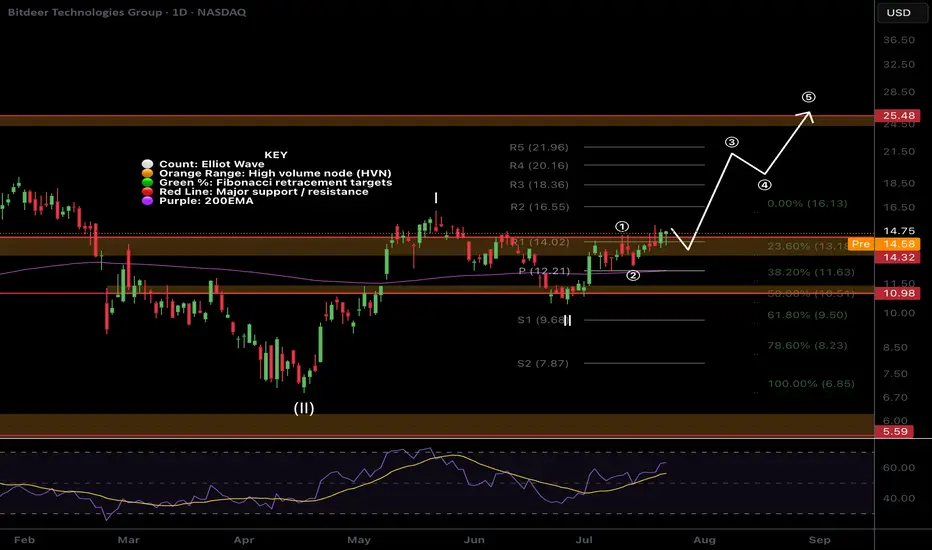
$BTDR Closed above resistance!NASDAQ:BTDR Bitdeer closed above major resistance yesterday, despite BTC and alt coins having a bearish day, triggering our long signal in the Weekly Trade signals substack.
I am looking for price to start to accelerate in wave 3 and resistance now support to hold. If BTC reverses it will add additional tailwinds with a target of the major resistance above the R5 daily pivot $24
Safe trading
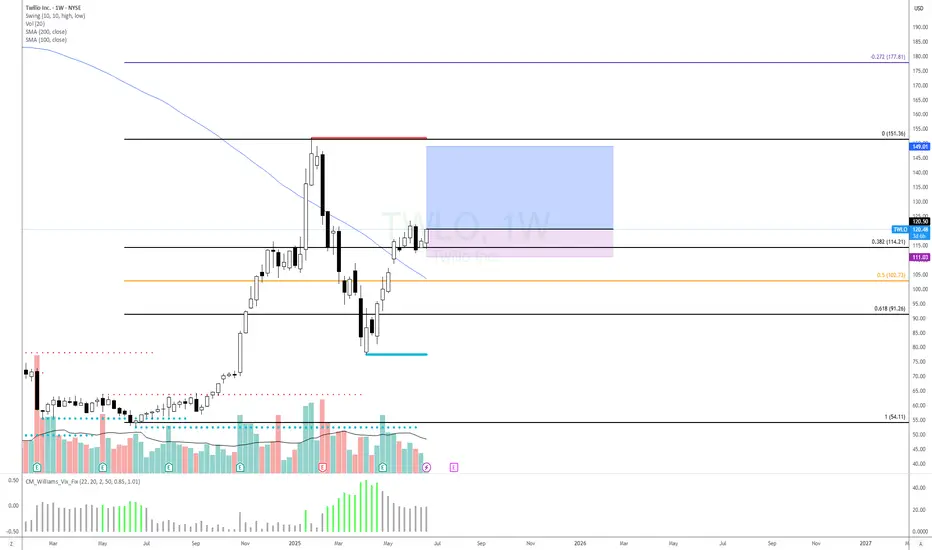
TWLO 24/06/2025 LONGPrice reacted to Fiboncci level, broke the 100MA on the weekly, and both 100&200MA on daily, seems like another leg is forming,
Good luck
Parallel StructureWe have a nice parallel structure sitting on top of a 50 EMA (in blue). A consolidation is happening. Interestly enough the 200 EMA(in orange) is close to the 0.382 Fib level. On the weekly chart you can see the bears gearing up. But the bulls are still in charge. Price needs to hold the 20.64 price range for the bulls.
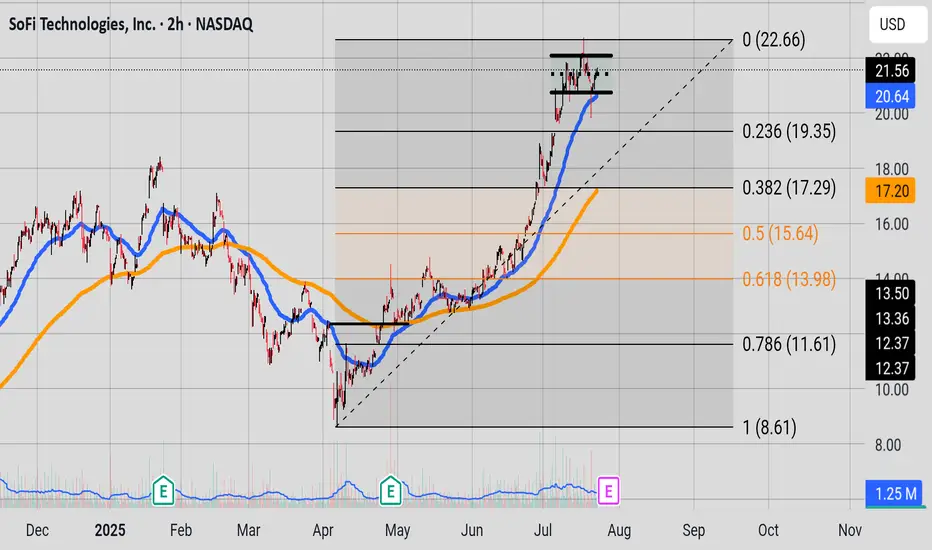
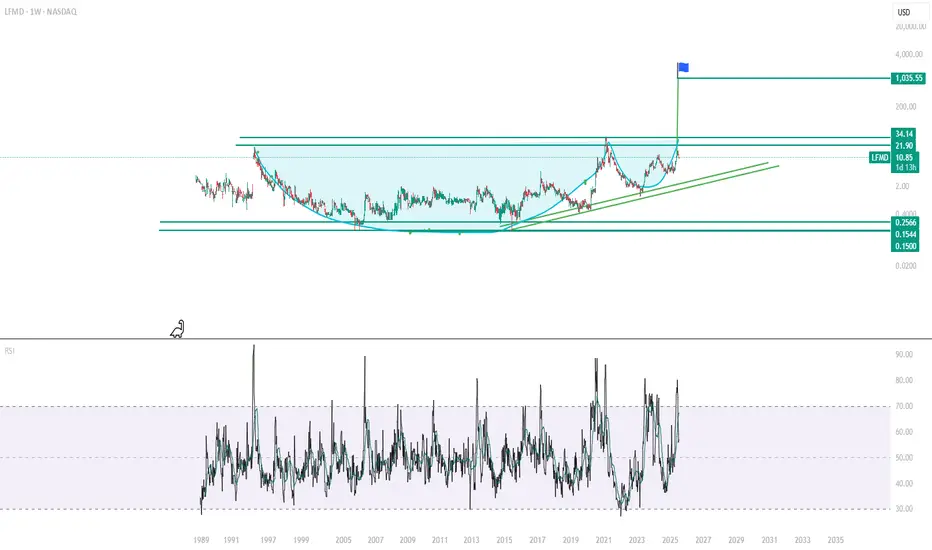
Figura tecnica Taza con asaCup-with-handle technical chart at a healthcare company powered by AI. Weekly long-term chart, long-term projection of $1,000
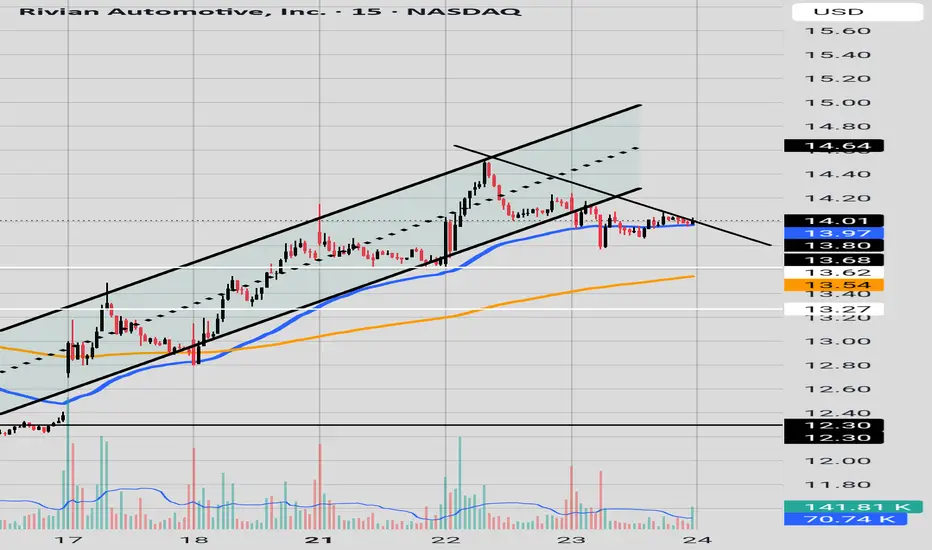
Pull back or ReversalPrice has fallen and is clinging to the 50 EMA (in blue) 13.97. Price is dancing outside the upward channel. If the 50 EMA does not hold price may fall to the 200 EMA 13.54 range in orange.
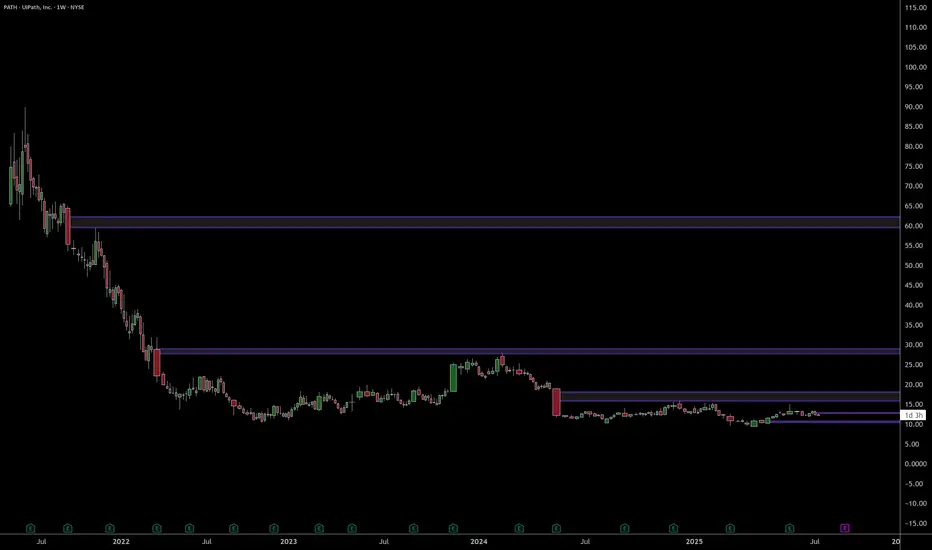
PATH --- Pop?PATH — Setting Up for a Pop?
UiPath (PATH) is showing signs of strength as it builds a base just above key Fibonacci support and prepares for a potential breakout in the broader AI + Robotics narrative.
Technical Setup:
Price holding above the 38.2% Fib retracement from the May rally.
Volume shelf + value area support at ~$12.30–$12.50 creating a launchpad.
21/50/200 SMAs converging — this type of compression often precedes expansion.
TTM Squeeze building pressure — prior squeezes on this name have led to fast directional moves.
Fundamental Tailwinds:
PATH is an automation leader riding the AI + enterprise software wave.
Sector rotation into Robotics and AI names (SYM, ROK, RR) lifting sentiment.
Recent dark pool activity shows accumulation—large 8M+ share blocks suggest institutional interest.
Thesis:
A close above $12.70 could trigger a move into the $13.40–$14.60 resistance zone, with a possible gap fill toward $18 on strong momentum.
Risk:
Invalidation below $11.80 (50% retracement / SMA cluster). Tight risk-reward if using LEAPs or long shares.
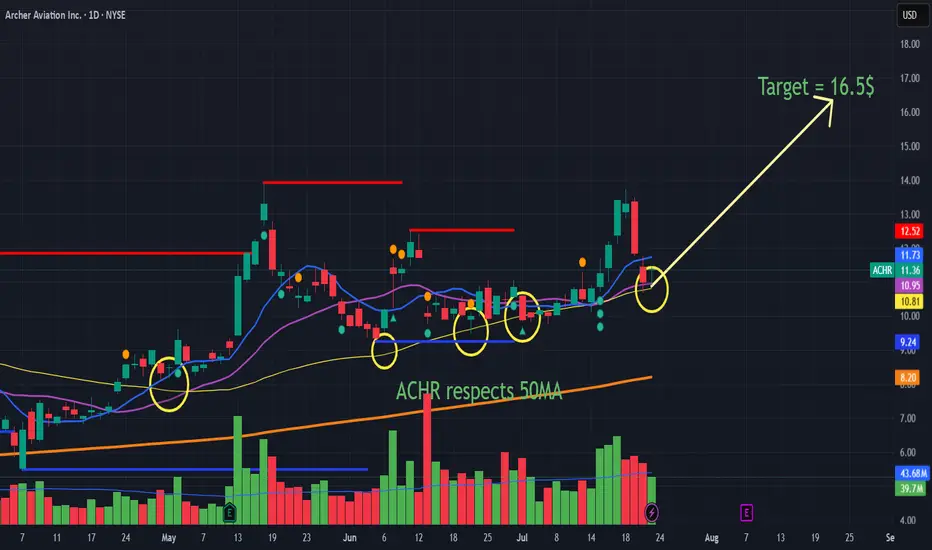
ACHR has bounced of 50MA and Next target is 16.5$ before 20$🚁 Archer Aviation (ACHR) NYSE:ACHR : $16.5 Could Arrive Fast
🔥 Pentagon Partnership Powers the Bull Case
Big News: Archer and Anduril team up to build a next-gen military hybrid VTOL for the Pentagon. This exclusive defense project fast-tracks Archer for major U.S. military contracts and funding.
www.axios.com
Cash Confidence: Archer just raised $430M, now sitting on $500M+ in cash—no near-term dilution risk, making it a strong, stable bet.
📈 Technicals: Chart Looks Strong!
50MA Support: ACHR keeps bouncing off its 50-day moving average (yellow circles), showing strong buying momentum.
Price Target: Technically, the $16.5 target is in play, with a sharp uptrend and volume surges bolstering bullish sentiment.
⚡ Why $16.5 Could Hit in August
🚀 Defensive Catalyst: Pentagon contract talk = institutional and retail buyers flood in.
💰 Balance Sheet Strength: No funding worries attracts more investors.
📊 Momentum: Chart, volume, and sentiment point to rapid upside—especially if military deals are announced.
Summary:
ACHR is set for a possible quick move to $16.5 on Pentagon news, strong funding, and powerful technical momentum. A major contract update could push it there as soon as August. If you are a trader then next levels are 16.5 and then 20$ but as an investor, this could easily reach 100$ over next 5 years.
BTBT Consolidated, Ready to GoBTBT sideways consolidation is done. Check the wavetrend. BTBT holds Ethereum. Will have positive upside via altcoin bull.

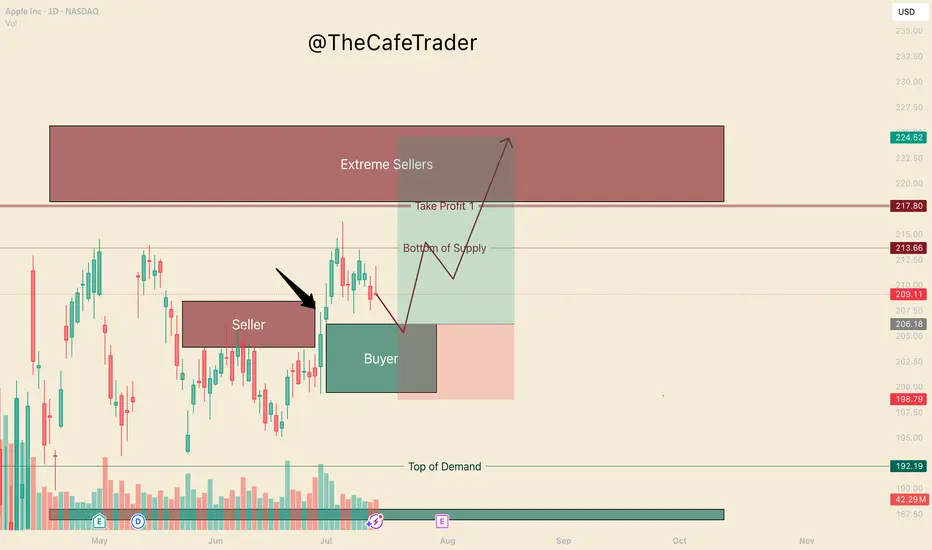
APPL. Bulls are in ControlHello, I’m TheCafeTrader.
This post is for technical traders looking to capitalize on short swings and options.
What you’re seeing here are supply and demand zones — areas where liquidity is concentrated. These levels are identified using a system built around footprint data, order flow, and market imbalances.
🔹 Key Observation:
I’ve marked a seller that price has now broken above. This tells us that buyers have overpowered a sell-side participant, and are now likely targeting deeper liquidity in the $218–$225 range.
🔹 On Apple’s Behavior:
Apple can be slow and choppy at times. So, if you’re trading options, consider going as close to the money as possible and give yourself some time on the contracts.
🔹 New Buyer in the Market:
Between $199–$206, a new aggressive buyer has stepped in. This player appears to be pressuring the first line of sellers (labeled “beginning of supply”).
🟢 My Expectation:
I expect AAPL to pull back to around $206 before catching a bid. As long as price holds above $199, buyers remain in control. In this range, I anticipate further accumulation by bulls.
🔸 Take Profit Levels:
• First TP: Just before the major selling cluster around $218
• Final TP: Deep inside the seller zone near $223
⸻
📊 Follow for more short-term analysis. This week, we’re covering both short- and long-term views of the MAG 7.
⸻
Apple battles resistance area – Can Earnings Turn It Around?Shares in Apple Inc. (symbol ‘AAPL’) gained back a large percentage of the losses incurred at the beginning of the second quarter. The company’s earnings report for the fiscal quarter ending June 2025 is set to be released on Thursday, 31st of July, after market close. The consensus EPS is $1,42 compared to $1,40 of the same quarter last year.
2025 is a hard year for the company so far since it lost more than 17% of its share value. The recent minor bullish rally might give some hope for a positive overall result at the end of the year, but the price needs to rise above $260 to be considered a positive year, and the company is still far from this number. Also, the financial image of the company is not looking great with the current ratio at 0.82 as of 31 March 2025. This means that the company is not liquid enough to cover the short-term liabilities with the current assets at hand. The payout ratio (percentage of the total earnings of the company paid out as dividends) is at 15,74% indicating that the company is looking forward to keeping most of its earnings for economic growth/strength, which is a good sign for the overall performance of the company.
On the technical side, the price is testing the resistance area between the upper band of the Bollinger bands and the 50% of the weekly Fibonacci retracement level. The level of $212 is also an inside resistance area of price reaction in early May and early July, making it a strong technical resistance level. The Bollinger bands are quite expande,d showing that there is volatility to support big moves. The Stochastic oscillator is near the extreme overbought level, but it's not in there just yet. On the other hand, the moving averages are still validating an overall bearish trend in the market.

Microsoft hits record highs days before earnings dayMicrosoft Corporation (symbol ‘MSFT’) share price reached a new all-time high on July 17 at $511.70 while on July 18 it even reached $514.64 intraday. The company’s earnings report for the fiscal quarter ending June 2025 is expected to be released on Wednesday, July 30th, after market close. The consensus EPS is $3.35 against $2.95 of the same quarter last year.
Microsoft is still holding its higher market cap compared to its main competitor, Apple, with $3.75 trillion against $3.02 trillion. Recently, Microsoft’s web-based platform “SharePoint” was hijacked, with Microsoft quickly reacting with patches to resolve the issue. As of today, there was no significant effect on the share price, but as the story unfolds, we might see some market reaction.
Technical analysis shows that the price has found sufficient support on the lower band of the Bollinger bands in early April and has since entered a rather aggressive bullish rally until the day of this report being written. As a result of the bullish rally, the Stochastic oscillator has been pushed to extreme overbought levels and has recently corrected to neutral levels, hinting that the price could move in either direction in the near short term. On the other hand, the moving averages are still validating an overall bullish trend in the market while the Bollinger bands are quite contracted, showing that volatility has dried up, and it might take some time to witness any significant moves.
