$BABA Breakout Imminent – Triangle Compression Ending, Fib .....📈 NYSE:BABA Breakout Imminent – Triangle Compression Ending, Fib Confluence Targets Set
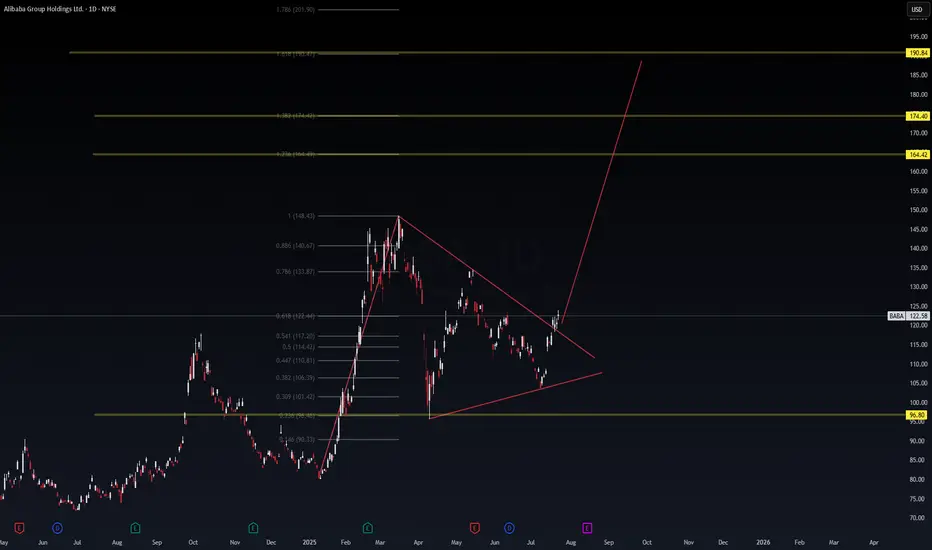
After weeks of coiling inside a converging triangle, Alibaba ( NYSE:BABA ) just broke above the downtrend line with conviction. The structure and Fibonacci extensions point toward an explosive leg up—possibly targeting $164 → $174 → $190.
🔺 Setup Breakdown (Daily Chart)
Price: $122.58
Breakout confirmed above triangle resistance
Strong volume into the 0.618 Fib zone (from recent swing)
Measured move extension targets:
🟨 1.236 = $164.42
🟨 1.382 = $174.40
🟨 1.618 = $190.84
🧠 Macro Overlay (VolanX Protocol)
China stimulus whispers + tech rotation = alpha setup
Liquidity expansion in HK/US dual-listed names
Institutional buy zones aligning with breakout levels
🎯 WaverVanir Playbook
Entry: $121–123 (breakout retest range)
Stop: Below $117
Target 1: $164
Target 2: $174
Optional: Long Call Spread (e.g., $130/$160 for Sept)
This is a DSS-confirmed breakout model—not financial advice. Track it. Learn from it. Execute with clarity.
—
🔻 #VolanX #WaverVanir #BABA #BreakoutPlay #ChinaTech #FibonacciTrading #TradingView #SwingTrade #OptionsFlow #TrianglePattern #MacroCatalyst #QuantFinance #PredictiveTrading #InstitutionalSetups
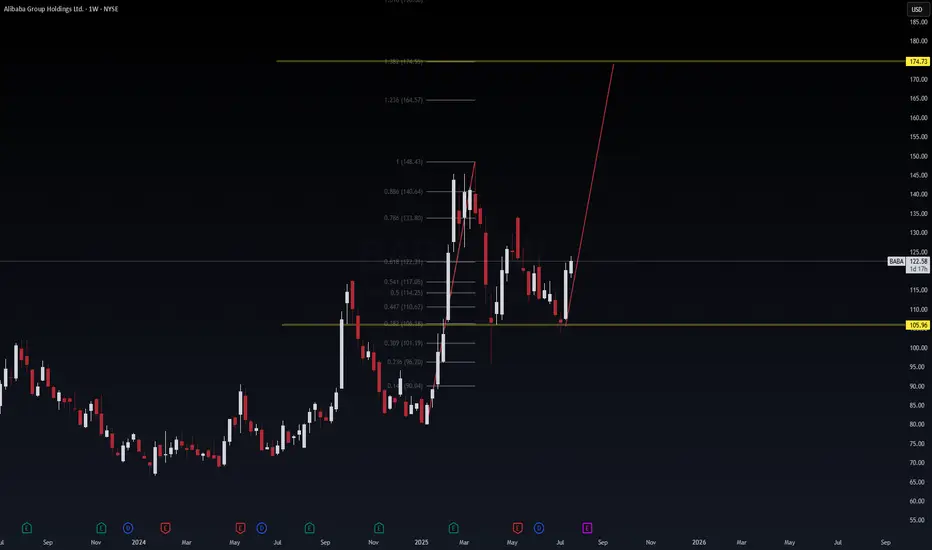
BABA | Weekly VolanX Setup📈 BABA | Weekly VolanX Setup
WaverVanir International LLC | July 24, 2025
Alibaba is bouncing off a key institutional demand zone at 105.96, reclaiming the .382 Fibonacci level with strong bullish conviction. This weekly structure sets the stage for a macro Fibonacci extension run toward 174.73 — a 1.618 projection from the March 2024 low to the March 2025 high.
🧠 VolanX Signal Context:
🔂 Structure: Double bottom + rejection wick off golden zone
🔺 Fib Targets: 133.80 → 140.64 → 164.57 → Final at 174.73
🏹 Strategy: Spot or ITM Call LEAPS (Jan/Jun 2026) or 0.50 Delta options ladder
🧭 Thesis: China tech revival, undervaluation vs U.S. peers, potential stimulus
🧨 Risk: Invalid below 105.96 weekly close. Next support 101 → 96
📡 VolanX Protocol Notes:
DSS Score: 8.6/10
Macro Tailwind: Fed dovish bias + U.S. tech overbought rotation
Position Type: Swing accumulation (8–12 week hold)
Optional Overlay: Long NYSE:BABA , short AMEX:KWEB or FXI for cleaner exposure
🛡️ Not Financial Advice. For informational and educational purposes only.
VolanX is an AI-governed trading system under WaverVanir International LLC.
#Alibaba #BABA #VolanX #MacroTrading #Fibonacci #ChinaTech #WaverVanir #DSS #InstitutionalTrading #TradingView #OptionsFlow #SMC #VolanXProtocol
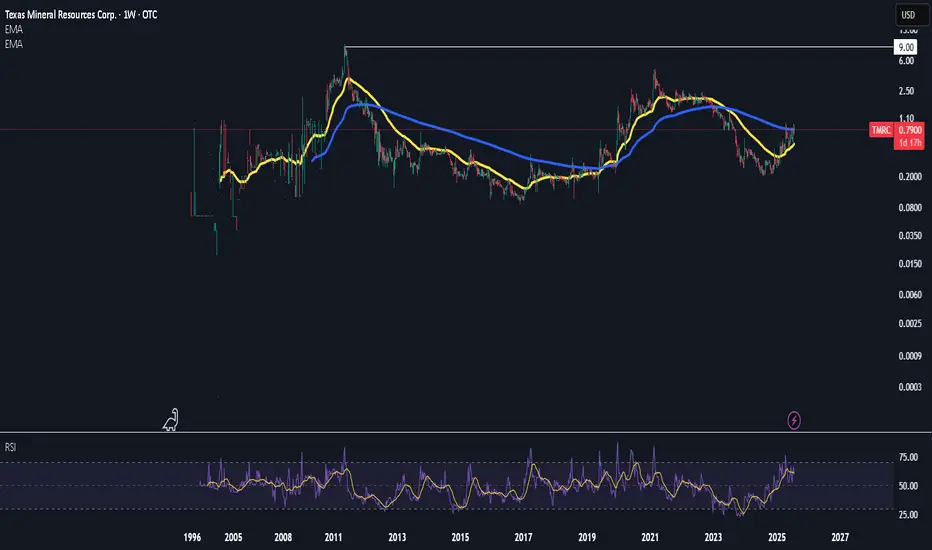
$TMRC4 year hold
buying here
targeting highs
rare minerals rights been bought by some private company wanted exposure in it since this has some share of that co
got some. let see in a few years
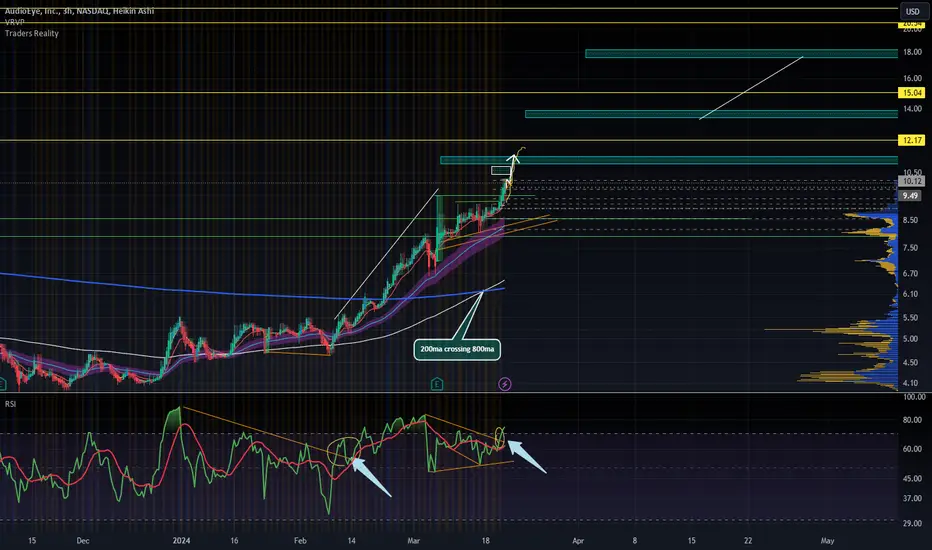
Audio Eye GLB!Hi everyone, this chart stood out to me after since it appeared on my screener last week. It has shaped up well and has confirmed a Green Line Breakout. Solid earning, volume is steady. I took a starter position at $8.88 and went full size for this position at $9.63 after 2nd GLB alert.
Coming off of a nice long built base, nice setup for another double up and maybe more. The chart reminds me of GCT when it too was at the same price and stature of AEYE, using the same screener criteria.
Thank you for your time and Happy Trading!
OnePath
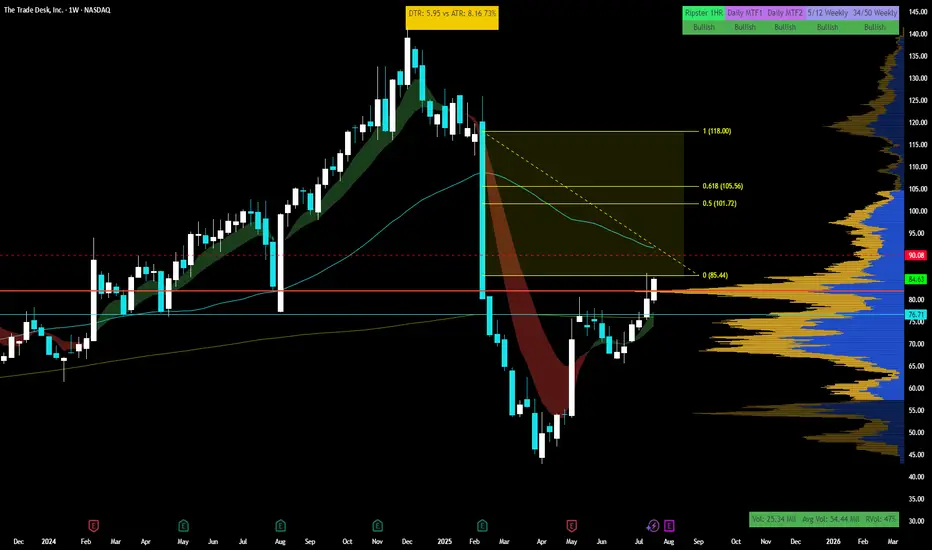
$TTD is ready to move into triple digits - Lock n load Pretty straight forward in the face setup.
Here are pros-
+Got added to s&p500
+massive volume shelf from multi year above 80 which we are above
+beautiful gap from q1 2025 to ride from $85 to $120
++Relative strength strong vs spy for 55 period(thats what I use)
+++ $100 Psych level is a MAGNET - it will pull !!
cons-
-200sma above that cleanlu aligns with a multi month resistance and 0.5 fib from ATH to bottom in april 25
-- If software earnings are poopy then definitely bumpy ride up but all software names and cybersecurity names are all having good chart pattenrs meaning earning is good for q2 and all want to pop
How to play-
+Sized up and risk that gap below neat 21ema
+take 60% off at 200sma + watch behavior if flags next day add back in else ride to the 0.5 fib in the gap
+take 30% off at $100
+ride the rest to $120 or untill 21 breaks
(IF IF IF 9ema holds steady then keep runners)
Today is 7/23/2025 so lets see what tomorrow brings- Good luck if get on the train but manage risk first everything else later !
Lennox LII At Resistance, swept liquidity - Nice r/r for a shortLII is testing ATH resistance after failing a key level on the monthly. It just swept liquidity on earnings news. It may eventually go higher, but a gap fill is likely. Reward/risk is 3.23 on a short here with PT1 at the gap and a stop loss at ATH. It will be a quick in and out trade for me unless it breaks substantial levels below.

EYE inverted H&STA: I could see a pull back around to around the $17 level. Ultimately I see this going as high as $38.
F: Our eyes are just getting worse, we will only be sitting in front of more screens, and taking more harmful medicines that could damage eyes. I'm long eye care.

SERV coiling nicely on daily with higher timeframe confluenceI really like how the daily, weekly, and monthly charts on SERV are lining up as the daily coils and tightens sideways within a constricting channel. I'm looking for a violent move on the break.
Support: 9.96
Resistance 12.40

CYBN remains in daily equilibriumCYBN remains within a wide daily equilibrium, we have an inside bar today for early clues to get an early gauge on direction. Nothing changes for me as long as price remains between 7.11 and 8.84, and we can remain tightening within this range for another couple of weeks..
Support: 7.67, 7.55, 7.28, 7.11 key
Resistance: 8.00, 8.11, 8.847 key

MNMD Daily bullflag below key resistance on monthly timeframe MNMD bulls are setting up a daily bullflag just below key monthly resistance at 10.44, the break of which would confirm the monthly trend change for the first time in the history of the chart. 10.24 key short term resistance to confirm the bull flag.
Support: 9.50, 9.00, 8.79, 8.51, 8.43
Resistance: 10.24, 10.44, 10.47, 11.00, 11.22

CMPS bulls trying to confirm the daily bullflagCMPS bulls attempting to confirm the daily bullflag and keep the very impressive bounce going, If we reject tomorrow anticipate a 4hr equilibrium and we'll look for a higher low above 4.21 and a tightening range for the next few days.
Support: 4.42, 4.21
Resistance: 4.68, 4.85, 4.88, 5.00

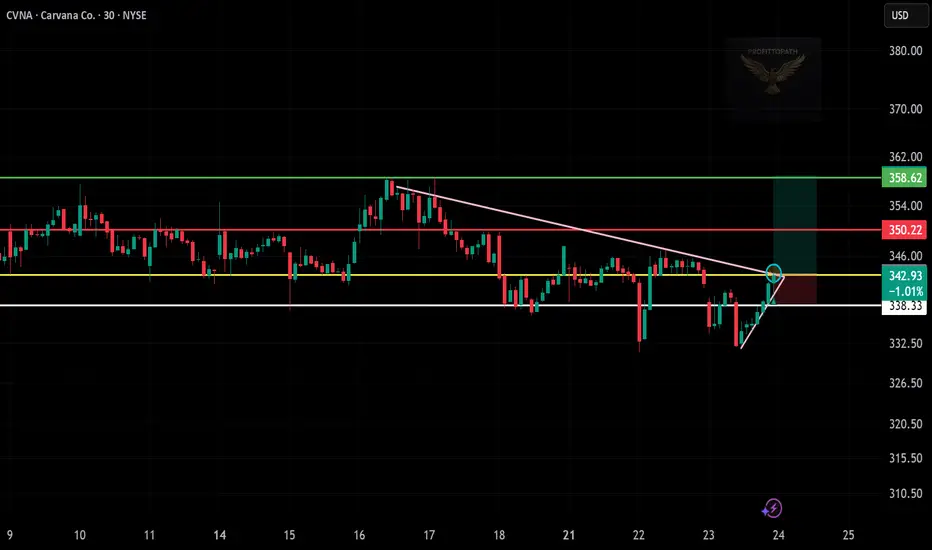
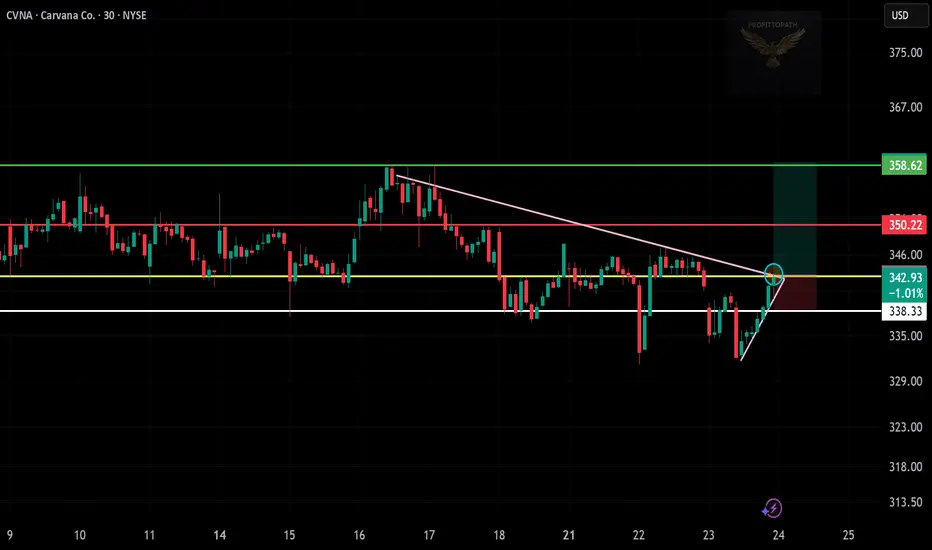
Pattern: Trendline breakout (pink line)
Entry Zone: Around 342.93
Stop Loss: Below 338.33 (support zone)
Targets:
Target 1: 350.22 (resistance)
Target 2: 358.62 (top green level)
IONQ breakout — targeting next resistance zones.
Pattern: Breakout from descending trendline (pink)
Entry Zone: Around 43.28 (breakout zone)
Stop Loss: Below 42.75 (recent support zone)
Targets:
Target 1: 44.21 (red resistance)
Target 2: 45.57 (top green line)
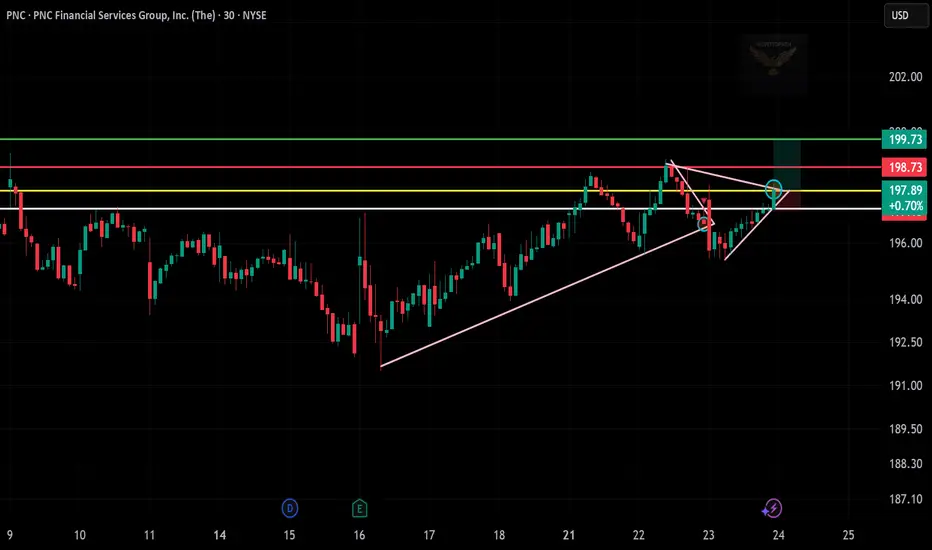
Breakout confirmed — going long on PNC.
Pattern: Breakout from triangle (pink lines)
Entry Zone: Around 197.89 (breakout level)
Stop Loss: Just below 197.15 (previous resistance/support)
Targets:
Target 1: 198.73 (first red resistance)
Target 2: 199.73 (top green line)
ATAI bulls confirm daily bullflagATAI bulls bought the dip for the third day in a row off of 3.31 support and V-shaped to a new high of day. As mentioned in previous videos we are now in a medium volume node so price can move through this area a bit more easily. Beware of short term extension, I wouldn't be a buyer up here but I see no reason to be a seller.
Support: 3.77, 3.75, 3.68, 3.31
Resistance: 3.90, 4.00, 4.08, 4.17, 4.52

Mean Reversion Trade: META1. RSI in oversold region
2. Price likely to rebound back the the mean
Trade Rules:
Entry Trigger - RSI has cross below oversold region, enter limit buy at close price
Exit Trigger - Close at market when close price cross above exit trigger (Red step line)

CRCL – Classic Crypto IPO Fractal in Play?Initial Pump:
Price launched rapidly after listing, forming a local high.
Sideways Phase:
Market settled into a sideways consolidation, typical after the first pump.
Retrace:
A retrace toward the 0.5 Fibonacci zone (~$181.50) is developing. Typical retracement in similar "crypto stonks" ranges from 60-80%.
Accumulation in Demand Zone:
Multiple support levels are stacked between $180–$140, indicating a strong demand zone for accumulation.
True Move Potential:
If the support holds, a new bullish leg could start, targeting Fibonacci extensions ($299, $362, $444). If the support is lost, the next levels are $143 and $100.
This scenario is based on the repeating behavioral fractal seen in high-profile crypto listings: explosive initial move, multi-week consolidation, and a deep retracement before the real trend emerges. Current price is entering the key demand area, which aligns with previous market structure seen on token launches. The risk/reward for new longs becomes attractive here if buyers defend the zone. However, invalidation is clear if price breaks below $140.

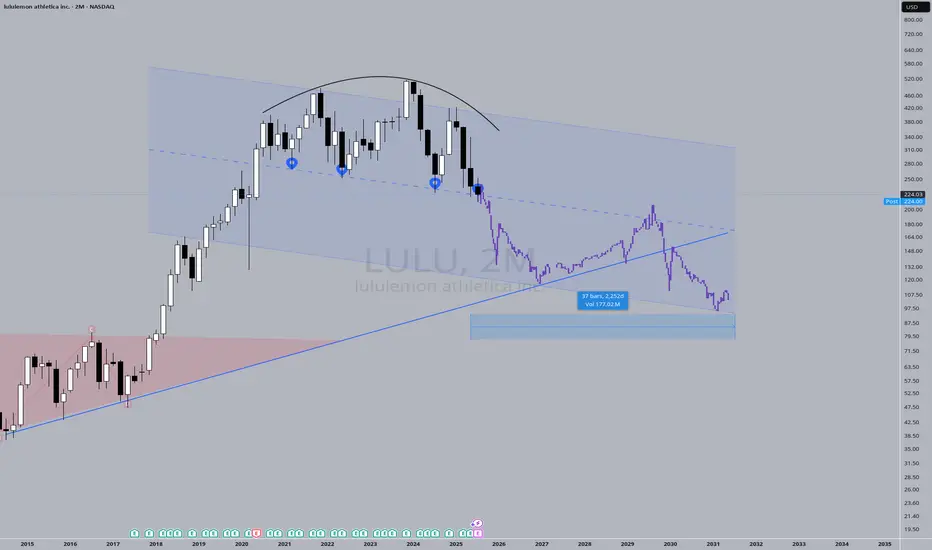
Mega-ultra macro LULU takePrice action has "knocked" on the support door FOUR times. It's got to give sometime soon. Fashion brands come and go, I think LULU has had it's time to shine, now it's time for another brand to emerge and take its place.
I say "Mega-ultra macro" to recognize the absurdity of a 6-year guess. The probability of accurately predicting price action for a 6-year window is low. But here's a prediction anyway.
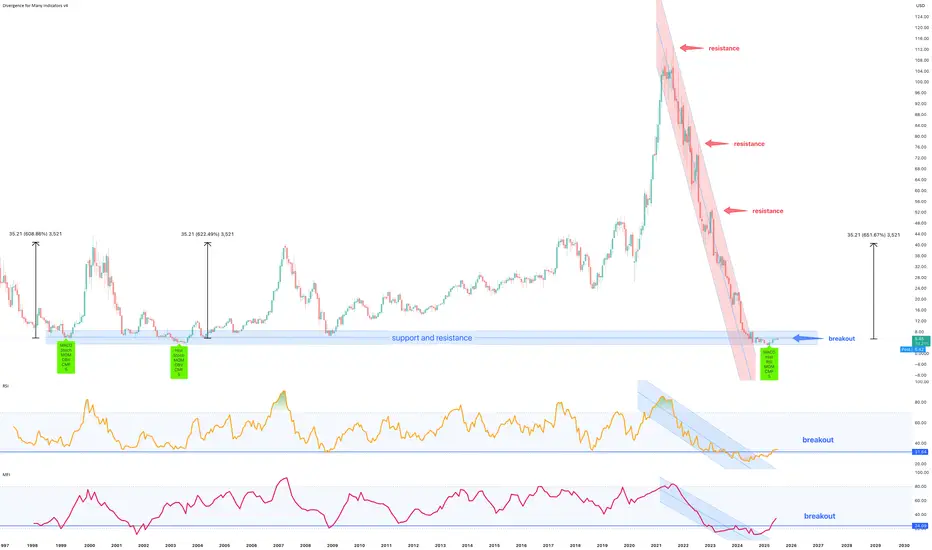
TTEC Holdings Inc, 500% return for the shrewd** long term forecast, the months ahead **
A 97% correction is shown on the above 16 day chart. As of 2021 price action has collapsed from $112 to circa $5 today. A number of reasons now exist for a bullish outlook.
Support and resistance
Price action, Relative Strength Index (RSI), and Money Flow Index both print resistance breakouts.
Look left. Price action is now on legacy support from 1999, 2003, and 2009 market bottoms. This is not the place to be a seller.
The trend
Something interesting in the RSI and MFI (orange and pink lines below chart). They are showing signs of a trend reversal, with higher highs and lower low prints after the breakouts. Exactly what happened in 1999, 2003, and 2009. A deja vu moment.
Positive divergence
Multiple oscillators print positive divergence with price action. Ready to be dazzled? Not only multiple oscillators as in previous years but the same oscillators!
The Stock
Two notes of interest,
1. No share splits.
2. Short interest 18%
Fundamentals
If you’re not chasing businesses who seek to implement AI into their operations, then you’re going to be miss out on some of the best returns in the years ahead. Crypto currency was yesterday, now in decline and dying. Today the narrative is AI, follow the money.
Is it possible price action continues to correct? Sure.
Is it probable? No
Ww
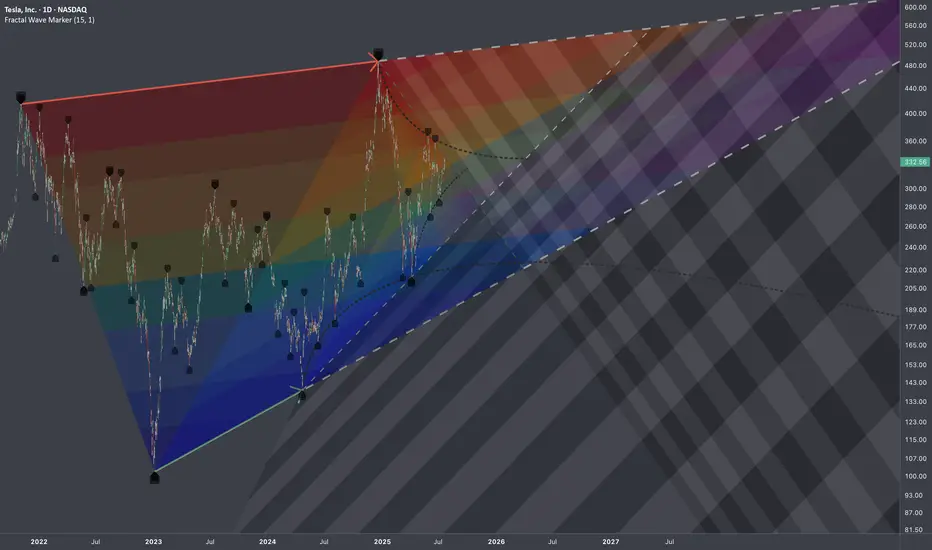
$TSLA: Multi-Scale DensityResearch Notes
Identified structural compressions happening within two periods:
This set has provided a perfect opportunity to study exponential fibs with growth rate starting from phi^1/4 applied to area of expression of squeeze.
Geometrically, gives a better sense of a continuity than regular fibs.
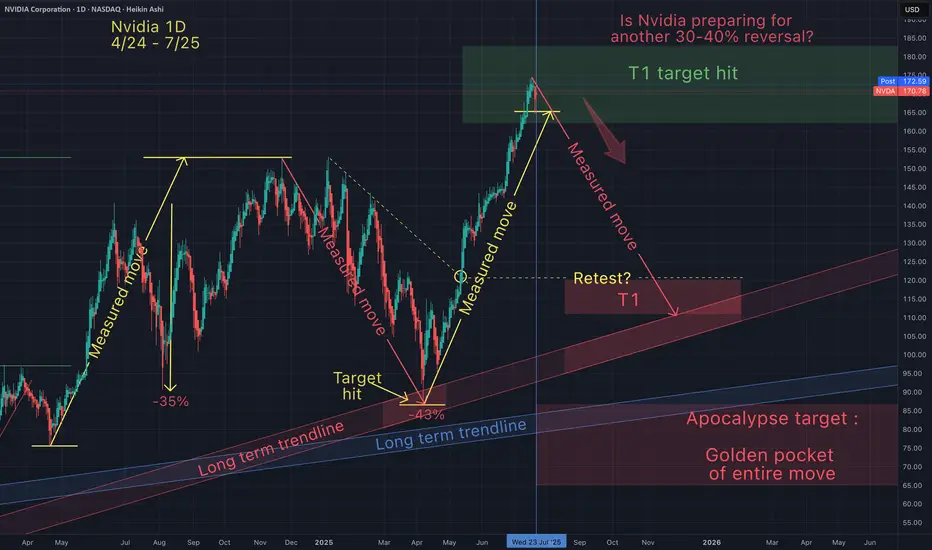
NvidiaIs Nvidia preparing for another 30-40% reversal. I hope not!
But I do want to be prepared in case we do get another dip buying opportunity.
GOOG Earnings Setup (2025-07-23)
📈 GOOG Earnings Setup (2025-07-23) 🚀
🔥 STRONG BULLISH BIAS – 85% Confidence
Alphabet (GOOG) is set to report after market close. Here’s why this setup is 🔥:
⸻
📊 Fundamental Highlights:
• 💸 TTM Revenue Growth: +12.0%
• 🧾 Profit Margin: 30.9%
• 💯 Earnings Beat Rate: 8/8 last quarters
• 📈 EPS Est: $8.95
• 🎯 Forward P/E: Attractive in the AI-dominant market
👉 Score: 9/10
⸻
🔍 Options Market Flow:
• 🚀 Heavy Call buying at $195 strike
• 💰 Implied Move: ±5.12%
• 🛡️ Light Put hedging at $190 shows cautious optimism
• 📉 IV Rank: 0.75 (Elevated but tradable)
👉 Score: 8/10
⸻
🧭 Technicals:
• 🔺 RSI: 73.32 (strong momentum)
• 🔼 Above 50/200 MA
• 🔵 Support: $190.00
• 🔴 Resistance: $200.00
👉 Score: 8/10
⸻
🌍 Macro/Sector Tailwinds:
• 🌐 AI & Ads tailwind still fueling growth
• 📡 Sector leadership + resilient biz model
👉 Score: 9/10
⸻
🛠️ Trade Idea (High Conviction)
🔹 Ticker: NASDAQ:GOOG
🔹 Direction: CALL
🔹 Strike: $195.00
🔹 Expiry: 07/25/2025
💵 Entry Premium: $3.95
🎯 Target Premium: $11.85 (200%)
🛑 Stop: $1.98 (50%)
📅 Entry: Before 07/23 Close (Pre-Earnings)
⸻
📌 Risk-Reward
• Max Loss: $395 per contract
• Target Gain: $1,190 per contract
• Break-even: $198.95
• ⏳ Time-sensitive: Close post-earnings if flat (avoid IV crush)
⸻
🚨 Summary
💥 GOOG looks primed for an upside breakout. Strong fundamentals + bullish technicals + aggressive options flow make this a top-tier earnings play.
🔔 Watch $195–$200 zone post-earnings.
💬 Drop your thoughts 👇 — are you playing GOOG this earnings?

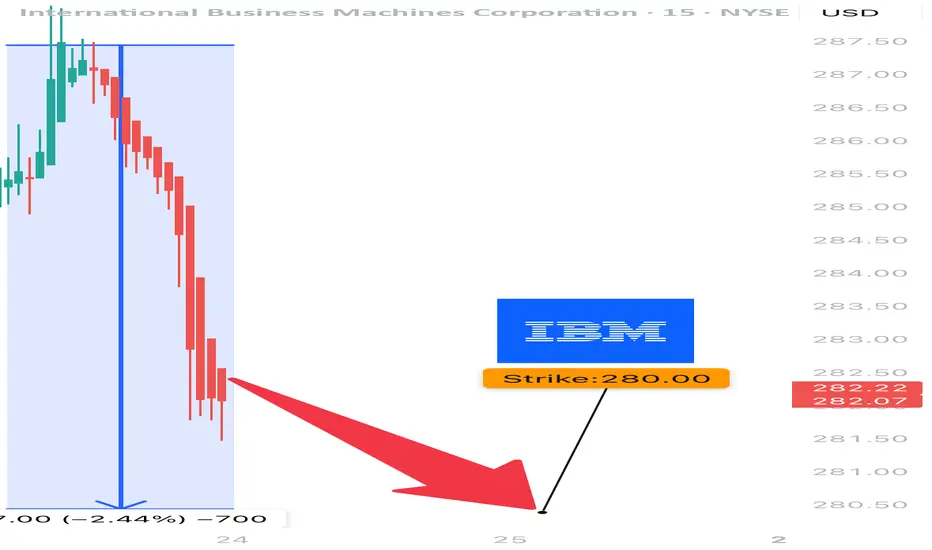
IBM Earnings Analysis Summary (2025-07-23)
🧨 IBM Earnings Trade Idea 🧨
Earnings Date: July 24, 2025 (AMC)
🧠 Confidence: 70% Bearish | 🎯 Expected Move: ~5%
⸻
🔍 Snapshot Summary:
• 🐢 Revenue Growth: Flat at +0.5% YoY
• ⚠️ High Debt: D/E ratio at 247.98 — compression risk
• ✅ Beat History: 100% past 8 quarters, but…
• 🤔 Forward EPS Projections: +81.7% looks too ambitious
• 🔻 Analyst Target Below Market Price: $273.36 avg (vs. $281.96 now)
• 📉 Pre-Earnings Drift: Trading below 20-day MA
• 🛡️ Options Flow: Bearish bias, heavy put flow at $275/$255 strikes
⸻
🧠 Strategy Rationale:
Despite a strong beat history, IBM’s fundamentals are weakening — growth is stagnant, debt is high, and guidance may disappoint. Institutions are hedging downside via puts, and recent technical action shows momentum fading.
⸻
📉 Earnings Trade Setup
{
"instrument": "IBM",
"direction": "put",
"strike": 280.00,
"expiry": "2025-07-25",
"entry_price": 6.30,
"confidence": 70,
"profit_target": 12.00,
"stop_loss": 3.15,
"size": 2,
"entry_timing": "pre_earnings_close",
"earnings_date": "2025-07-24",
"expected_move": 5.0,
"iv_rank": 0.60
}
⸻
💼 Trade Details (Simplified)
🔧 Parameter 🧾 Value
🎯 Strike $280 Put
📅 Expiry 2025-07-25
💵 Entry Price $6.30
🚀 Profit Target $12.00 (200% gain)
🛑 Stop Loss $3.15 (50% loss)
⚖️ Position Size 2 contracts
⏰ Entry Timing Before close 7/24
📈 IV Rank 60%
⸻
🎯 Exit Plan:
• 💰 Profit Exit: Close if premium hits $12+
• ⚠️ Stop Loss: Trigger at $3.15
• ⏱️ Time Exit: Auto-close within 2 hours post-earnings to avoid IV crush
⸻
🧠 Final Thoughts:
“IBM’s history says beat — but the setup says trap.”
If guidance stumbles, this low-beta name could slide, and bearish put flow is already sniffing it out.
📊 Are you riding the puts with this one, or fading the crowd? Let me know👇