AAPL EARNINGS TRADE SIGNAL (JULY 31)
### 🍏 AAPL EARNINGS TRADE SIGNAL (JULY 31) 🚀
📊 **AAPL Call Play** — Earnings Strategy
🧠 Multi-model conviction: **75% Bullish Bias**
---
### 🔍 Fundamental Drivers
✅ TTM Revenue: +5.1%
✅ Gross Margin: 46.6%
✅ 8 straight earnings beats
⚠️ Sector shift: growth → value = caution
📉 TTM EPS Est: \$8.31 (+29.4% growth est.)
🧮 **Score**: 8/10
---
### 💰 Options Flow Breakdown
🔥 IV Rank: 0.70
🔵 Bullish OI @ \$220C = 25,950 contracts
🔻 Skew: Heavy puts @ \$197.5 / \$200
⚠️ Gamma squeeze possible near \$220
📈 **Score**: 8/10
---
### 📉 Technicals
📍 RSI: 39.3 (Oversold)
📉 Trading below 20DMA (\$211.64)
🟥 Low volume pre-earnings = low conviction
📌 Support: \$207.5 | Resistance: \$220
📉 **Score**: 6/10
---
### 🌐 Macro Setup
⚠️ Supply chain pressures
⚠️ Regulatory risk ongoing
🔄 Growth → Value rotation still underway
🌐 **Score**: 5/10
---
### 🧠 Trade Setup (Call Option)
* 🎯 **Strike**: \$220
* 💵 **Entry**: \$0.87
* 📅 **Expiry**: 08/01 (2DTE)
* 📈 **Target**: \$2.61
* 🛑 **Stop**: \$0.43
* ⚖️ **Risk**: 2% of portfolio
* ⏰ **Timing**: Enter before close, report after market
🧮 Expected Move: ±5.0%
🔒 Confidence Level: 75%
---
### ⚙️ Exit Plan
✅ Profit: Exit @ \$2.61
❌ Stop: Exit @ \$0.43
🕒 Time Exit: Force close within 2 hours post-earnings
---
📣 **EARNINGS SCALP PLAY**
— AAPL is oversold w/ strong EPS beat history
— Bullish OI stacking at \$220
— High gamma setup, low IV risk = 💥
\#AAPL #EarningsTrade #CallOption #TradingView #0DTE #OptionsFlow #GammaSqueeze #UnusualOptions #AppleEarnings #SwingTrade #TechStocks

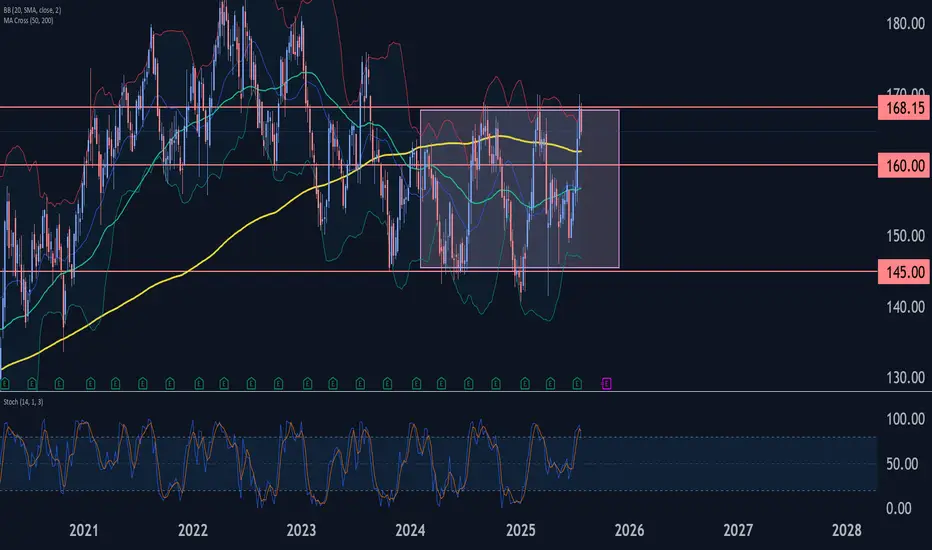
Johnson & Johnson Wave Analysis – 31 July 2025 Johnson & Johnson reversed from the resistance zone
- Likely to fall to support level 160.00
Johnson & Johnson recently reversed down from the strong resistance zone located between the long-term resistance level 168.15 (upper border of the weekly sideways price range from 2023) and the upper weekly Bollinger Band.
The downward reversal from this resistance zone stopped the earlier intermediate impulse wave (3).
Given the strength of the resistance level 168.15 and the overbought weekly Stochastic, Johnson & Johnson can be expected to fall to the next support level 160.00.
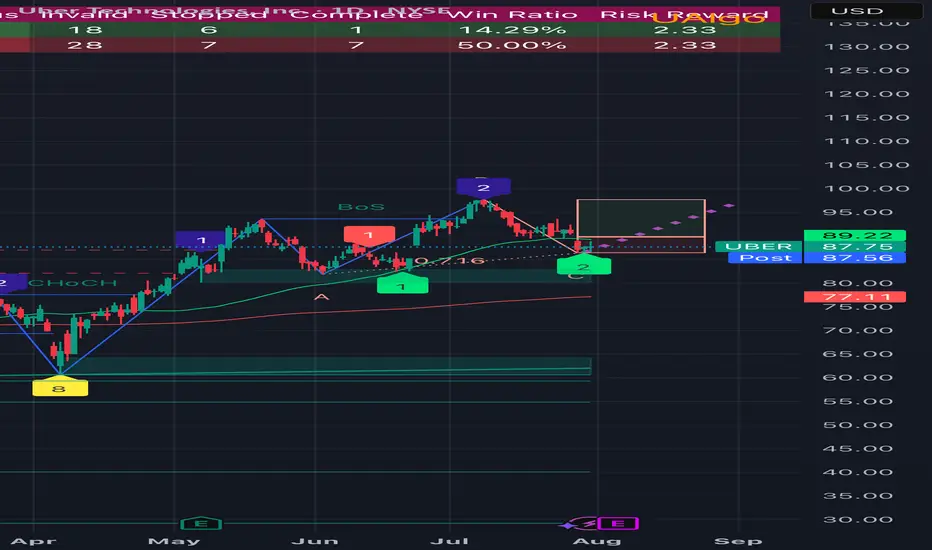
Uber swing playBullish Setup (if you think bounce holds)
• Buy Call Spread:
• Buy $90 Call (Sept expiry)
• Sell $100 Call (same expiry)
• Lower premium, defined risk. Target profit if stock runs to resistance.
• Cash-Secured Put:
• Sell $85 Put (Sept)
• Collect premium. If UBER dips, you get assigned at an effective cost basis below support.
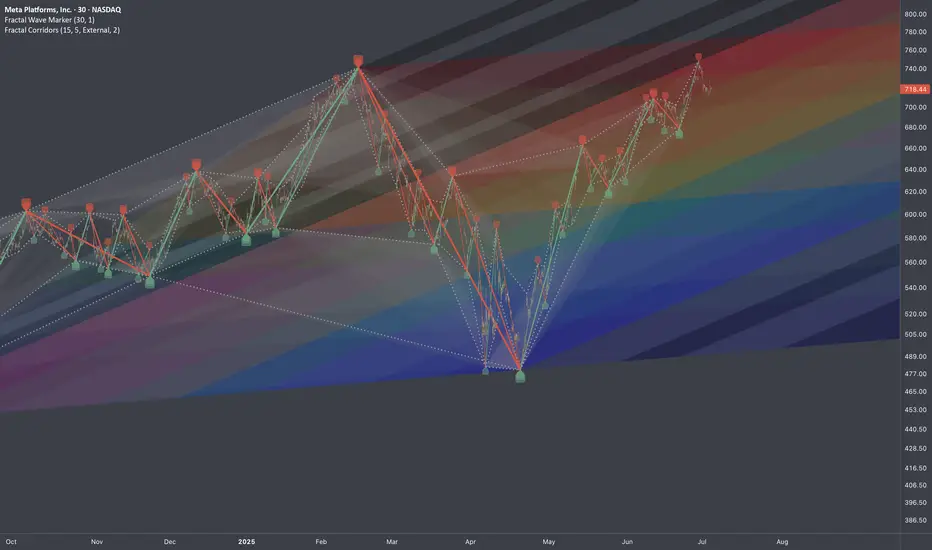
META: Testing Alternative Interconnection TypeResearch Notes
Given expression like this:
Fractal Corridors can be used for horizontal perspective of the same pattern manifestation. Alternative frames of reference exposes how historic swings of various magnitude in some way wire the following price dynamics. tradingview.sweetlogin.com helps to seek a matching commonality in angles of trends which gives a hint how structure evolves in multi-scale perspective.
I use both when it comes to working with complex waves and making interconnections through fibonacci ratios.
To define emerging wave's limits (probable amplitude), I'll test classic rule of Support/Resistance shift in fibs. (When resistance becomes support or vice versa)
By theory it means a trendline can also shift like that.
In our case this can be applied as:
Fibocnacci Structure:
7/31/25 - $weav - Just watching tn7/31/25 :: VROCKSTAR :: NYSE:WEAV
Just watching tn
- this tape has enough issues where $10 or $15 or $25 bn companies can't catch a needed bid for fcf yields and growth far in excess of what fiat IOU's yield
- so i already have my "favorite" $500 mm c'mon let'sgoco called NASDAQ:GAMB and liquidity and size seem to matter right now
- which (see private notes on chart) is why i am not going to complicate my life w/ this one tonight. but probably a dip buy esp if there's some sort of growth hiccup and i'd have time to investigate
- all in, this seems like a cool niche software co that hasn't really turned the corner on opex inflection to get toward DD ebitda mgns, but where if there remains progress as we've seen over the last year, it will be a matter of time
- tough to value this in a typical context
- so i'd say so far i like rev growth and sales flex on opex line, "therefore" R&D seems to be producing
- you all know rule of thumb, but in this tape let's put a heftier discount rate on 40 mm annualized budget of 20% (a defensibly conservative bar) and that's 40/.2 = 200 mm.. stock at 500 mm cap and you know i like to 2x that r&D budget, which says anything below 20% is a pretty easy dip buy for me (ex structural issues which i'd need to investigate). anything 15%... let's see. shallow 10%.. pass and look later. and if it's up... it just remains on the eternal watchlist.
be well
V

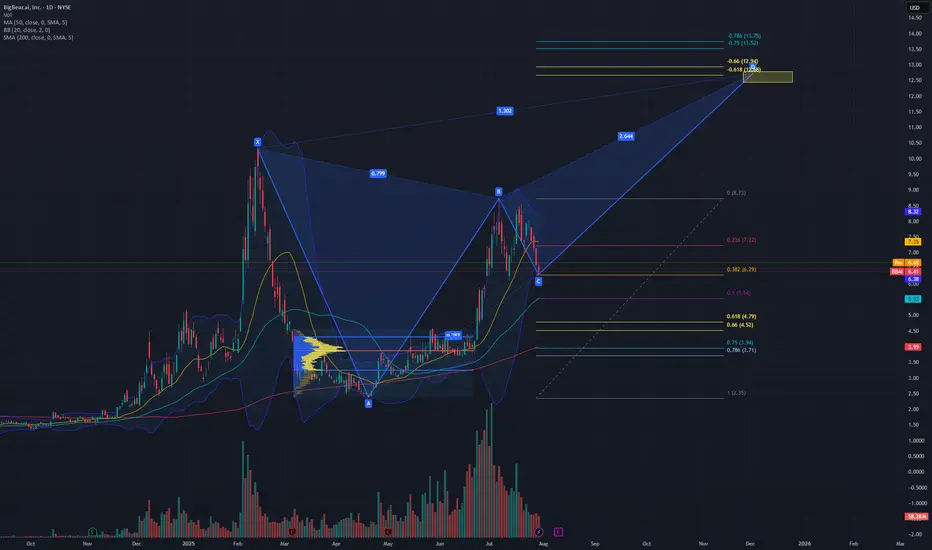
XABCD pattern playing out $12 targetBBAI is looking like it will play out the XABCD butterfly pattern if it continues to rally from the .382 of the pull back from previous $2.35 lows and 8.73 highs.
Breaking down and close below the $6.06 daily candle will potentially expose the previous consolidation POC at $3.87, which is a .75 pull back.
Using Fib time, I am expecting a $12 range around this year in December.
Will look to open a 7/12 bull call spread at Jan 2027 exp.
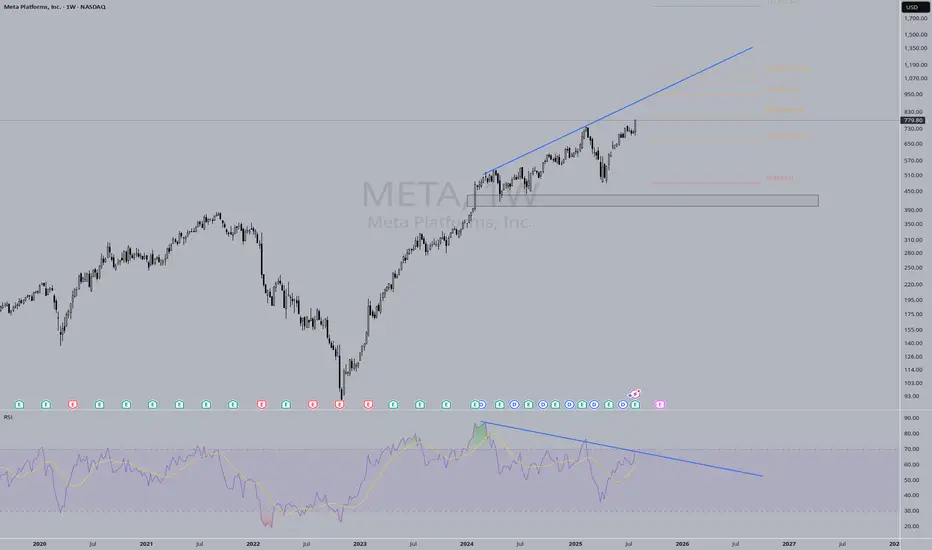
META Bearish RSI Divergence?RSI bearish divergence occurs when price makes a higher high, but the Relative Strength Index (RSI) forms a lower high. This mismatch signals weakening bullish momentum and hints at a potential trend reversal to the downside
Berkshire Hathaway looks appealing in todays market conditionsWith most markets at all time highs it is becoming increasingly difficult to find good opportunities for buying. I have decided to allocate about 9% of my portfolio to Berkshire Hathaway as a sort of hedge against some of my other positions. I like to have a diverse exposure to the markets and with Berkshire Hathaway being a conglomerate it is a perfect stock for someone like me to invest in. The stock seems to be doing the opposite of the us500 so far this year hence why I call it a hedge. According to my simple technical analysis there is a probability for the stock to make a reversal after spending some time going down.
The company has already donated plenty of shares which probably has something to do with it going down, which presents a unique opportunity to invest in it since there is nothing fundamentally wrong with the company. With that being said they have also said they probably wont engage in share buy backs until next year at least so it could be a falling knife type situation. However I am confident in the company and feel like it is a great stock to have in my portfolio for the long term.
The range of the intrinsic value according to the discounted cash flow model is between $400-$1000 with a 5 year exit. Assuming a 7.4% discount rate the intrinsic valuation for the stock is $575 presenting a unique opportunity for a 20% upside. The stock is certainly undervalued but like I said it could be a falling knife in the worst case scenario. Calculating the intrinsic value is highly speculative and complex, but it gives me increased confidence in my decision to push the buy button. I hope you found my analysis useful, drop a comment if you want to talk more about the stock or whatever.

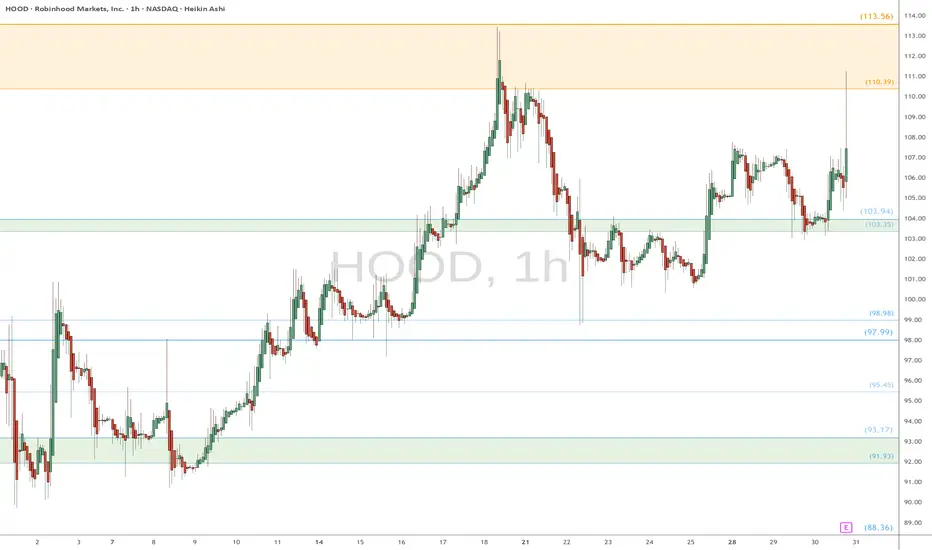
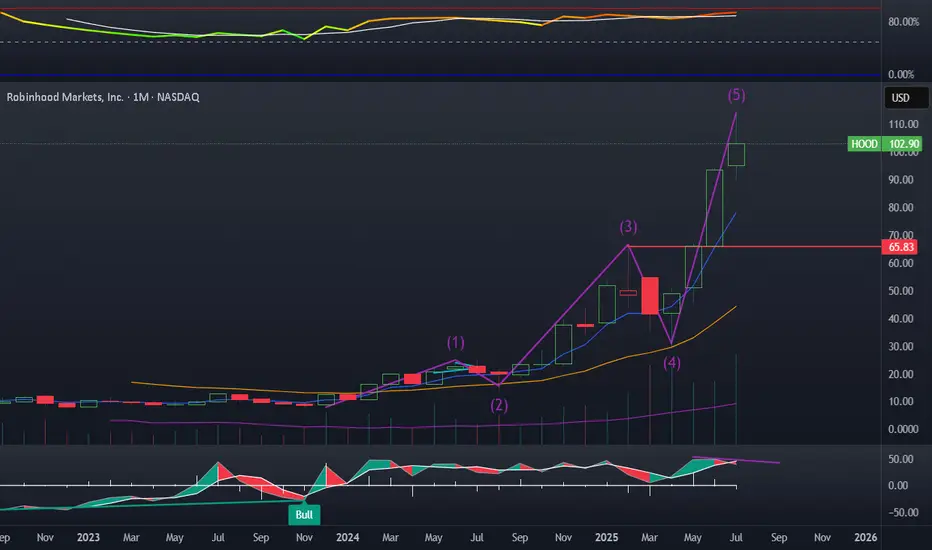
HOOD watch $110 then $113: Dual Golden fibs trying to TOP itHOOD has been a massive bull run since April lows.
Now battling a dual Golden fib zone $110.39-113.56.
Top of the zone is a well proven Golden Genesis fib.
See "Related Publications" for previous charts ------->>>>>>>
Such as this PERFECT catch of a serious bounce:
Hit BOOST and FOLLOW for more such PRECISE and TIMELY charts.
=========================================================
.
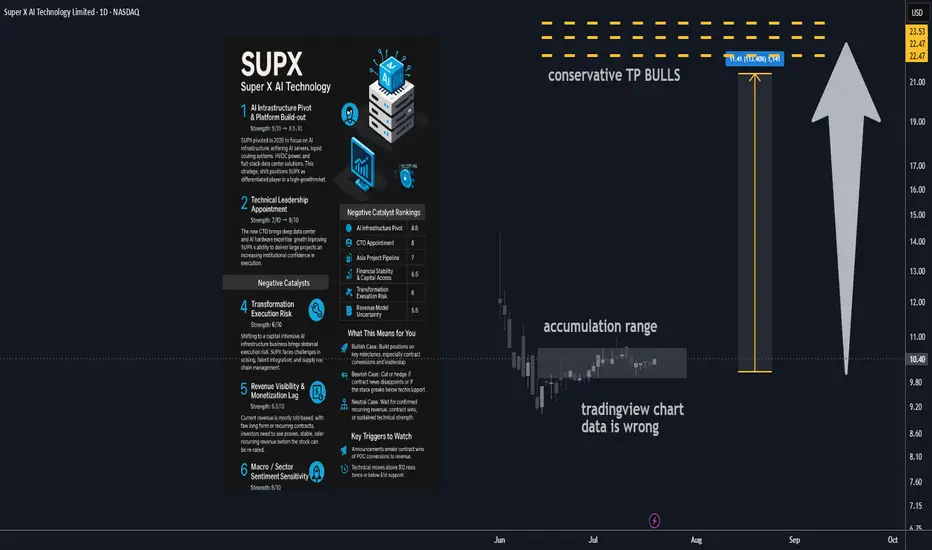
Super X AI Technology Ltd AI Infrastructure Stock 100% upside🔋 1. AI Infrastructure Pivot & Platform Build-out
Strength: 8/10 → 8.5/10
SUPX has made a major pivot in 2025, transitioning from a legacy business into next-gen AI infrastructure. The new focus includes AI servers, liquid cooling systems, HVDC power, and full-stack data center offerings targeting the rapidly growing demand for AI compute in Asia. This shift positions SUPX as a differentiated player in a high-growth market, opening doors to larger contract values and broader verticals.
________________________________________
🤖 2. Technical Leadership Appointment
Strength: 7/10 → 8/10
A major recent step forward is the hiring of a seasoned CTO with deep data center and AI hardware experience. This upgrade significantly enhances SUPX’s execution ability and credibility in enterprise infrastructure. Institutional investors and potential partners will see this as a sign SUPX can deliver on its technical roadmap and close major deals.
________________________________________
📈 3. Asia Institutional Partnerships Pipeline
Strength: 6.5/10 → 7/10
SUPX is developing a solid pipeline of institutional AI infrastructure projects across Asia, especially with established banks and tech companies. While many projects are still in proof-of-concept or pilot stages, these early relationships can drive high-margin, recurring business if successfully converted to long-term contracts.
________________________________________
💰 4. Capital Structure & Financial Health
Strength: 6/10 → 6.5/10
The company’s cash position has improved after new equity raises, giving SUPX a runway for continued R&D and expansion. While the business is still operating at a loss and share dilution remains a factor, debt levels are manageable and financial flexibility should support continued transformation and growth.
________________________________________
________________________________________
⚠️ Negative Catalysts
🛠️ 5. Transformation Execution Risk
Strength: 6/10 → 6/10
Transitioning from a legacy model to a complex, capital-intensive AI infrastructure business brings substantial execution risk. SUPX must navigate operational scale-up, talent integration, and supply chain challenges, with no guarantee of seamless delivery. Any delays or setbacks could erode investor confidence.
________________________________________
🌐 6. Revenue Visibility & Monetization Lag
Strength: 5.5/10 → 5.5/10
Most current revenue is still pilot-based, with few long-term or recurring contracts secured. The business model relies on successful conversion of its pipeline and faster ramp-up in recognized sales. Investors will need to see evidence of stable, recurring revenue before the stock is re-rated.
________________________________________
🔁 7. Macro / Sector Sentiment Sensitivity
Strength: 5/10 → 5/10
As a small-cap AI/infra play, SUPX is highly exposed to swings in broader market sentiment. Any downturn in tech or risk-off moves in global markets could lead to outsized stock volatility, regardless of execution progress.
________________________________________
________________________________________
🚀 Refreshed Catalyst Rankings
Rank Driver Score
1 AI Infrastructure Pivot 8.5
2 CTO Appointment (Execution) 8
3 Asia Project Pipeline 7
4 Financial Stability & Capital Access 6.5
5 Transformation Execution Risk 6
6 Revenue Model Uncertainty 5.5
7 Macro / Sector Volatility 5
________________________________________
📊 Analyst Ratings & Price Outlook
• No major Wall Street coverage; visibility remains driven by news flow and early institutional/retail adoption.
• Technicals: The stock has established higher lows since its business model pivot. Resistance sits near $11.50–12, with support at $9.80–10.00.
• Price target: A $20 target remains plausible if SUPX delivers on growth milestones and secures new capital or contracts, representing a potential doubling from current levels.
________________________________________
🗞️ Recent Developments
• Hired a proven CTO to drive the new AI/data center focus.
• Company rebranded and fully pivoted its business model in 2025, shifting all resources to AI infrastructure.
• Implemented a new equity incentive plan to attract and retain top tech talent.
• Announced a robust pipeline of institutional projects across Asia, although most are not yet recognized as revenue.
________________________________________
🔍 Summary Outlook
SUPX is an emerging transformation play, now fully aligned with surging demand for AI infrastructure. Its success depends on management’s ability to scale, close institutional contracts, and prove out recurring revenue. While the story is compelling and early traction is positive, the company remains high-risk and execution-dependent at this stage.
Bull Case:
If SUPX converts pilots into revenue, delivers operationally, and continues to attract top talent, the stock could re-rate to the $15–20+ range as its business model is validated.
Bear Case:
Stumbles in execution, monetization, or funding could send the stock back to $7–8 support.
Neutral:
Many investors may choose to wait for confirmation of contract wins, recurring revenue, or sustained technical strength before committing.
Technical Levels to Watch:
• Bullish breakout if it clears and holds $11.50–12.00.
• Bearish risk if it fails to hold $9.80–10.00, with possible drop toward $8.
________________________________________
✅ What This Means for You
• Bullish: Build positions into execution milestones, focusing on contract conversions and leadership updates. Upside potential to $20 if catalysts align.
• Bearish: Cut or hedge exposure on failed contract news or technical breakdown.
• Neutral: Stay on the sidelines until more evidence of recurring revenue, confirmed contract wins, or positive sector momentum.
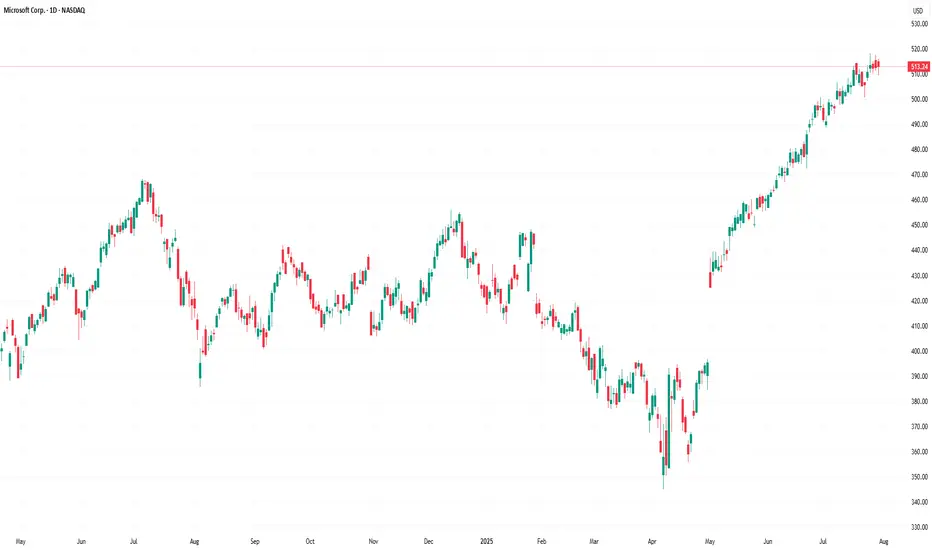
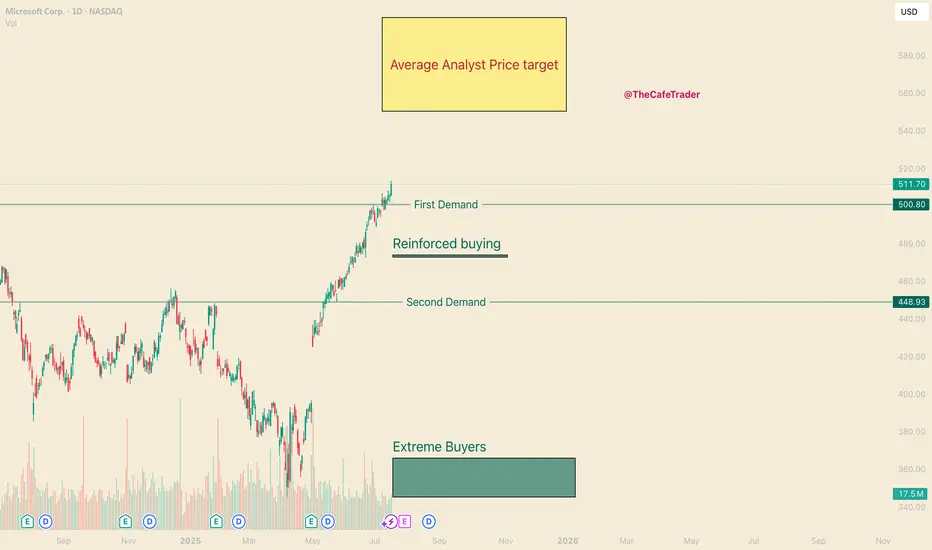
MSFT - Should you Buy All Time Highs?Hello everyone, I’m TheCafeTrader.
Next up in our breakdown of the MAG 7 is Microsoft (MSFT) — this post focuses on a long-term swing trade setup.
For short-term analysis, head to my profile and check out the latest posts.
⸻
💡 The Setup:
MSFT continues to ride a strong wave thanks to AI growth, especially with Copilot and its projected impact on revenue.
Several analysts have price targets ranging from $550 to $600, which still leaves 10–20% upside from current levels.
As of this writing, MSFT closed at $511.70, about 9% above its previous all-time high — and it got there in just five weeks.
Momentum is strong, and there’s no clear sign of slowing down.
⸻
📈 Is Now a Good Time to Buy?
Let’s look at two possible strategies:
⸻
Dollar-Cost Averaging (DCA) vs. Lump-Sum Investing
If you’re unfamiliar with DCA: it’s a strategy where you buy in gradually over time.
Say you have $5,000 set aside for MSFT — you might invest $1,000 now and continue adding monthly.
This is a smart approach in choppy or uncertain markets, but MSFT is not showing weakness right now.
Historically, when strong stocks are in clear bull trends, lump-sum investing outperforms DCA.
So if you’re confident in MSFT’s long-term potential — and want exposure to the current momentum — a full position now could make sense.
If you’re looking for a better price or want to scale in patiently, keep an eye on these key zones.
⸻
🧭 Areas of Interest on the Chart:
1. Yellow Box (Target Zone):
→ $550–$600 is the broader analyst price target range.
2. First Demand Line (~$500):
Recent signs of active buyer interest. If bulls remain in control, this could act as a springboard.
3. Reinforced Buyer Zone (~$472–$474):
This area has been tested and defended before. It’s a strong pullback entry if momentum stalls.
4. Second Demand Line (~$449):
A previous base of institutional accumulation. Price may revisit here in a broader market dip.
5. Deep Buyer Zone (~$344–$365):
A rare but powerful level where big money entered aggressively. It’s unlikely we revisit this zone — but if we do, it could be a great buy.
⸻
🧠 Strategy Summary:
• Aggressive buyers may consider entering around $500, where recent demand appeared.
• More patient traders might wait for MSFT to pull back into the $449–$474 range, where institutional interest has been high.
• The $344–$365 zone is a long shot — but would be a massive value area if touched.
⸻
That’s it for the long-term outlook on MSFT.
For more short-term trades and entries, check out my other posts — especially as we continue tracking the MAG 7.
@thecafetrader
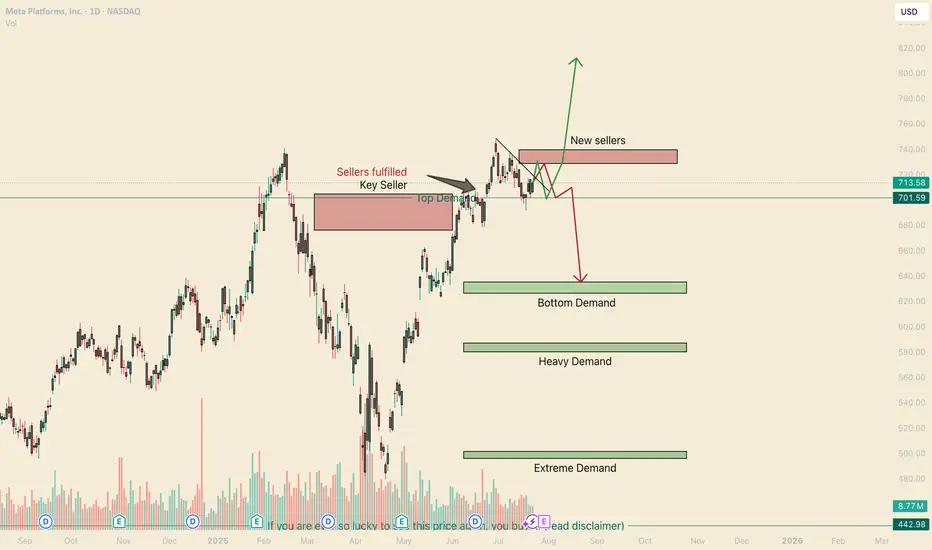
META Double Top? Think Again. Hello, my name is The Cafe Trader.
As part of our MAG 7 Series, we tackle META next on the list.
This article is for:
– Long-Term Investors
– Long-Term Hedges
– Swing Traders
– Options Traders
⸻
Brief Notes:
1. Meta is going all-in on AI, integrating it across all platforms (Instagram, Facebook, WhatsApp…).
2. 97% of Meta’s revenue still comes from ads. They’ve rebounded strongly from Apple’s policy changes—thanks in large part to AI targeting.
3. Meta is thinking long-term with AR/VR.
4. International user growth has exploded.
Conclusion: Bullish winds continue to blow behind META.
⸻
Long-Term Levels
• Aggressive Buy = $701.59 → Marked as “Top of Demand.” This is where aggressive buyers are looking to add.
• Good Value = $626–$635 → Marked “Bottom of Demand.”
• STEAL = $496–$501 → Marked “Extreme Demand.”
Why not buy at the ‘Heavy Demand Zone’?
Great question. If bears take out those buyers above this zone, it suggests something major has shifted in sentiment around META.
Even though there’s heavy demand here, I’d want to observe how sellers approach the area. You’ll likely get multiple chances to enter if buyers defend it. But if it breaks down, the best pricing lies at “Extreme Demand.”
For long-term holders looking to hedge downside, I suggest a Bear Put Spread or outright puts. More on this under the Red Scenario Options.
⸻
For Traders
Let me be real—this chart is tricky.
The V-shaped recovery signals strong bullish interest. That insane rally took out a major seller, further fueling the bulls.
That said, how we pulled away from the previous ATH (all-time high) shows weakness—low buying interest, followed by a real seller stepping in.
So yeah, I’m mixed on sentiment. But I’m confident in identifying liquidity and managing exits fast.
⸻
Two Scenarios
✅ Green Scenario
– Stock:
The bounce off “Top of Demand” is a strong bullish signal. Bears will be under pressure around $729, though I expect one more rejection before we break through.
I liked the original entry at “Top of Demand.” If entering again, I’d wait for a crack below that zone and watch the close—if we recover and close above it (especially if the dip was deep), that’s a strong signal to re-enter.
Target: take partial or full profits around $729. Hold the rest for highs or a breakout.
– Options:
If you can grab the 715 Calls with 3–5 days out for under $4.50, this setup could easily hit 2–3R.
Even better if you can get closer-to-the-money contracts for cheaper.
⸻
❌ Red Scenario
– Stock:
I believe this “new seller” is a fabricated seller—likely to get squeezed.
But if no new buying interest shows up to challenge that seller, we could see pressure on “Top of Demand” and a legit correction, maybe even a broader consolidation range.
Next few days will reveal the strength of buyers.
If no aggressive buying steps in, I like the short setup, targeting “Bottom of Demand” for TP.
– Options:
Long-Term Holders:
Use 2–3% of your META share value on a Bear Put Spread or put options.
If using puts, get 2–3 weeks of time. Go as close to the money as your risk allows.
Active Traders:
This could move fast if it plays out. If you can grab a 710 Put with 3–5 days for under $1.00, hold until a big red candle (3–5%) forms.
If it keeps dragging down, roll into a new contract the following week.
⸻
Follow for more analysis and updates — and as always,
Happy Trading.
📲 @thecafetrader
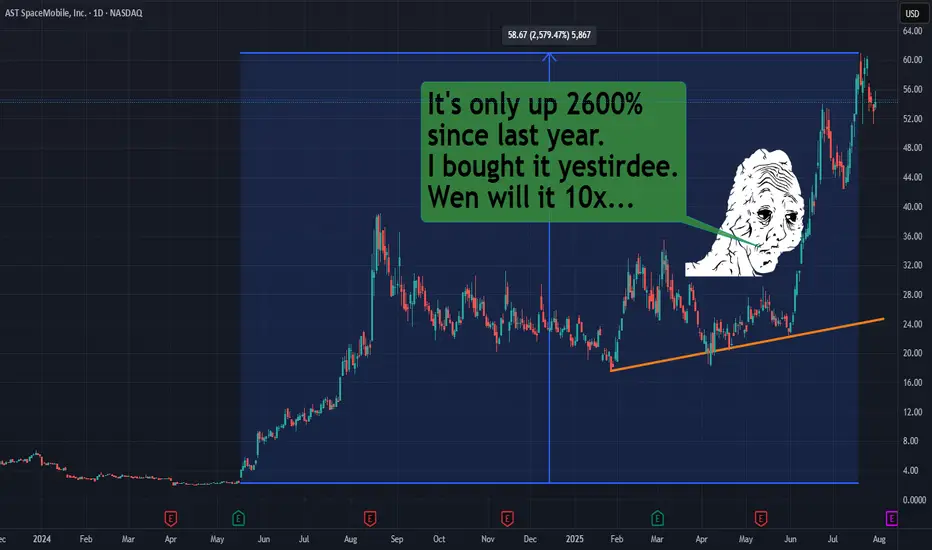
ASTS | Starlink ain't the only game in space no mo!This stock NASDAQ:ASTS is only up like 2600% in a year. That's like nothing. Might as well be losing that paypah.
Yes, it will swing more wildly than a chimpanzee from a vine. And yes my chart is probably effed as heck, but I'm looking for beyondosphere type of returns.
Is there room for more than one big f***y boom batty space phone company? Elon, scoot your bumbie over and let ASTS get in on that space rocket seat.
Play here is direct-to-cell calls between satellites and cell phones. Starlink probably has the advantage like the tide rolling over middle state a&m community college, but just like there was room for many phone companies in the last decades, there will be room for multiple space junkie phone companies.
You will not get rich because you will not HODL!
Live long and prosper. This is not financial advice. I JUST LIKE THE STOCK.
THANK YOU FOR YOUR ATTENTION ON THIS MATTER
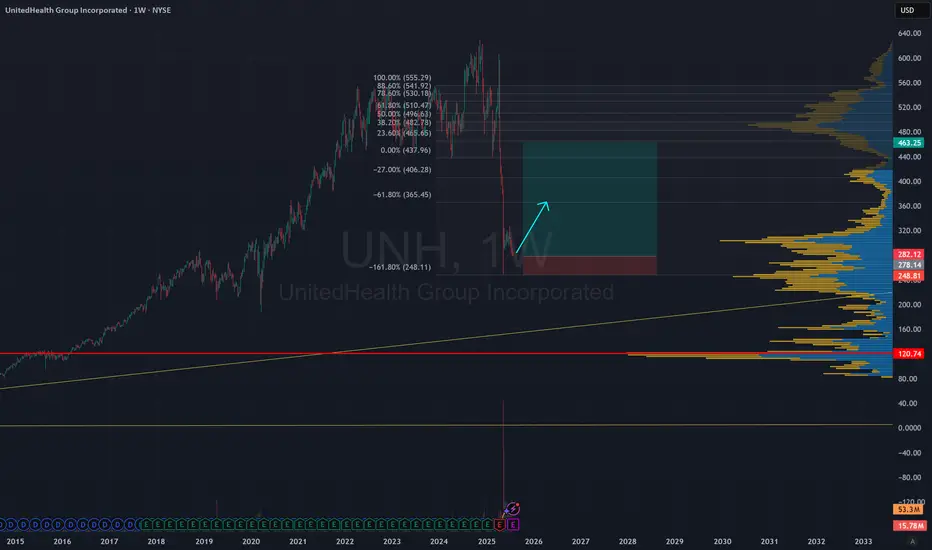
Buy when everyone is fearful UNH took a beating, earnings might surprise tomorrow. speculative pending positive earnings report. Target and stop loss on the chart.
$NVDA ~ An Elliott Wave Breakdown.Earlier in the main wave, our Wave 2(Black) was a Zigzag hence a Flat was expected for Wave 4(Black). Wave B(Blue) closed beyond Wave 3(Black) and our Wave 4 made a 5 wave move(Shown in Red) that retested at the 261.8% Fib. level. With Wave C(Blue) complete, it was coined Wave 4(Black). Wave 5(Black) was launched and has a 5 wave move shown in Green. With a Zigzag for Wave 2(Green), a Flat should be expected for Wave 4(Green). Wave 3(Green) has 5 waves with a triangle for Wave 4(Blue). A confirmation at its current location(423.6% Fib. level) would mean that Wave 3(Green) is complete and a Wave A(Black) of the previously mentioned Flat should be anticipated. Please check my detailed breakdown for a broader perspective into the same.
NB: The placement of Wave A(Black) of the Flat mentioned above is purely for demonstrative purposes.

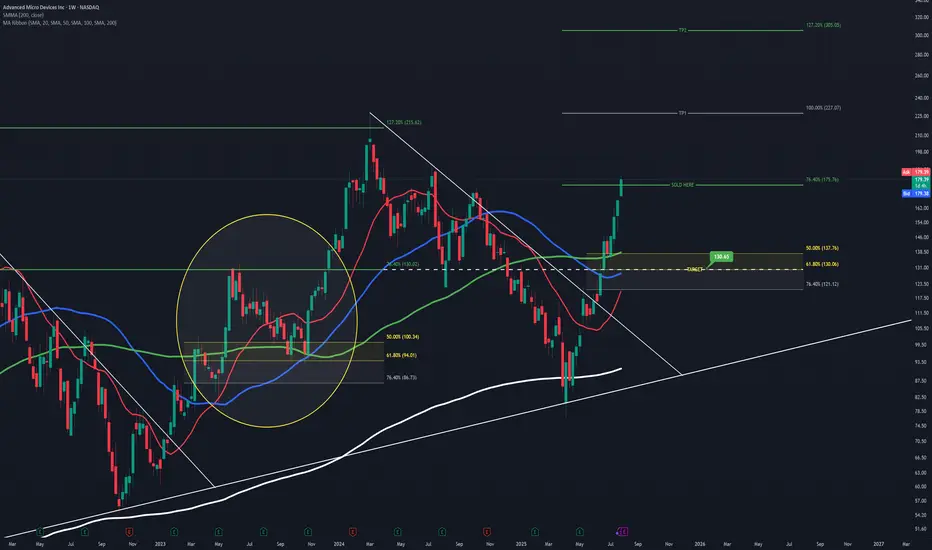
AMD Projection and Entry PointThis is speculation just like before, which played out very well so this is me having another shot at it.
Going off of the prior cycle AMD went through and comparing it to the one it's currently in, you can see a lot of similarities.
Learning from it's past and seeing how it likes to react to certain Fib levels, you can see that the 76.40% has been respected as a major level of resistance which resulted in its short retracement back in June '23 , It also acts as a very strong level of support as shown in August '24.
Assuming AMD rejects at the current 76.40% level again, using the prior 76.40% you can see it aligns perfectly with the golden ratio I have setup as my buy entry.
It all lines up too perfectly that in my mind, I'm certain it will play out. But of course it's all speculation, and the markets do as they please.
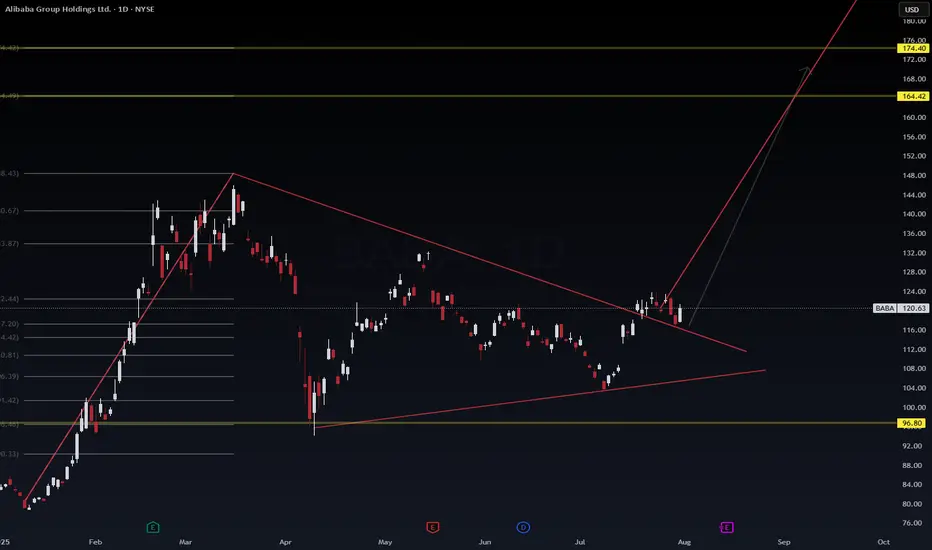
BABA: We have a bounce but is it temporary? Too many questions but dss forecasts a price growth near-term on ticker symbol $BABA. We will see where it goes. Another one on the watch is NASDAQ:PDD
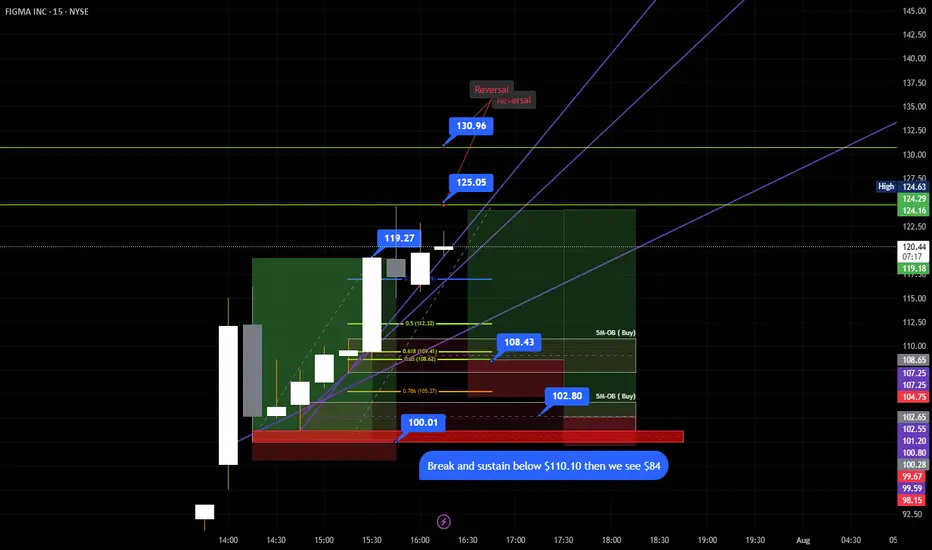
$FIGMA ANALYSIS FOR 08/01/2025Chart says it all. Text me if you have questions.
If the price breaks and sustain $110.10 then we will see $84 or below for sure.
Fibonacci Arcs in Stock TradingFibonacci Arcs in Stock Trading
Fibonacci arcs, derived from the renowned Fibonacci sequence, offer a compelling blend of technical analysis and market psychology for traders. By mapping potential support and resistance areas through arcs drawn on stock charts, these tools provide insights into future price movements. This article delves into the practical applications of Fibonacci arcs in trading, their interplay with market psychology, and best practices for effective use.
Understanding Fibonacci Arcs
The Fibonacci arc indicator is a unique tool in technical analysis derived from the famed Fibonacci sequence. It’s crafted by drawing arcs at the key Fibonacci retracement levels - 38.2%, 50%, and 61.8% - from a high to a low point on a stock chart. Each curve represents potential support or resistance areas, offering insights into the stock’s future movements.
The art of arc reading, meaning interpreting these curves, is crucial for traders. When a stock approaches or intersects with an arc, it reflects a significant reaction level. For instance, if a stock price touches or nears an arc, it could face arc resistance, indicating a potential halt or reversal in its trend.
Applying Fibonacci Arcs in Trading
In the stock market, these arcs serve as a guide for traders seeking to anticipate future price movements. When applied correctly, they can provide critical insights into potential support and resistance levels. Here's a step-by-step look at how you may use them effectively:
- Identifying High and Low Points: Begin by selecting a significant high and low point on the stock's chart. In an uptrend, it’s the most recent swing high to a previous swing low, and vice versa. These are the anchor points.
- Drawing the Arcs: Once the points are selected, draw the arcs at the Fibonacci retracement levels of 38.2%, 50%, and 61.8%. They radiate from the chosen low point to the high point (or vice versa), cutting across the chart.
- Interpretation: Watch how the stock interacts with these lines. When the price approaches an arc, it might encounter resistance or support, signalling a potential change in trend or continuation.
- Timing Entries and Exits: Traders can use the arcs in the stock market as a tool to time their trading decisions. For instance, a bounce could be a signal to enter a trade, whereas the price breaking through might suggest it's time to exit.
Fibonacci Arcs and Market Psychology
The effectiveness of Fibonacci arcs in trading is deeply intertwined with market psychology. They tap into the collective mindset of traders, who often react predictably to certain price levels. The Fibonacci sequence, underlying this tool, is not just a mathematical concept but also a representation of natural patterns and human behaviour.
When a stock nears a curve, traders anticipate a reaction, often leading to a self-fulfilling prophecy. If many traders make an arc stock forecast, they might sell as the price approaches a certain point, causing the anticipated resistance to materialise. Similarly, seeing support at an arc can trigger buying, reinforcing the tool’s power.
This psychological aspect makes Fibonacci arcs more than just technical tools. They are reflections of the collective expectations and actions of market participants, turning abstract mathematical concepts into practical indicators of market sentiment and potential movements.
Best Practices
Incorporating Fibonacci arcs into trading strategies involves nuanced techniques for better accuracy and efficacy. Here are some best practices typically followed:
- Complementary Tools: Traders often pair this tool with other indicators like moving averages or RSI for a more robust analysis.
- Accurate Highs and Lows: It's best to carefully select the significant high and low points, as the effectiveness of the curves largely depends on these choices.
- Context Consideration: Understanding the broader market context is crucial. Traders usually use Fibonacci arcs in conjunction with fundamental factors to validate their analysis.
- Watch for Confluence: Identifying areas where Fibonacci levels converge with other technical signals can provide stronger trade setups.
- Practice Patience: Traders typically avoid making hasty decisions based solely on Fibonacci levels. It's usually better to wait to see additional confirmation from the price action.
Advantages and Limitations of Fibonacci Arcs
Fibonacci arcs are a popular tool in technical analysis, offering distinct advantages and some limitations in analysing stock movements. Understanding these can help traders leverage the tool more effectively.
Advantages
- Intuitive Nature: The Fibonacci sequence is a natural pattern, making the tool intuitive for traders to understand and apply.
- Dynamic Support and Resistance Levels: They provide dynamic levels of support and resistance, unlike static lines, adapting to changing market conditions.
- Versatility: Effective in various market conditions, the arcs can be used in both trending and sideways markets.
Limitations
- Subjectivity in Selection: The effectiveness largely depends on correctly identifying the significant high and low points, which can be subjective.
- Potential False Signals: Like all technical tools, they can generate false signals, especially in highly volatile markets.
- Requires Complementary Analysis: To maximise effectiveness, these curves are usually used alongside other technical indicators, as they are not infallible on their own.
The Bottom Line
Fibonacci arcs are invaluable tools in stock analysis, providing insights into market trends and potential price movements.
This article represents the opinion of the Companies operating under the FXOpen brand only. It is not to be construed as an offer, solicitation, or recommendation with respect to products and services provided by the Companies operating under the FXOpen brand, nor is it to be considered financial advice.
Hood 5th wave looks toppyHood is one of my larger holdings and I have been riding the wave waiting for a pullback for months. I believe the time is now. This is chart I posted elsewhere that I forgot to share here. I think 65$ is a real possibility. The last four pullbacks were all over 40%. Not the stochastic monthly is starting divergence and the BBWP has remained elevated for a long time.
My plan:
Sit on my shares.
Close my covered calls into 2027 if we dump a lot
Buy zone between 65-75$
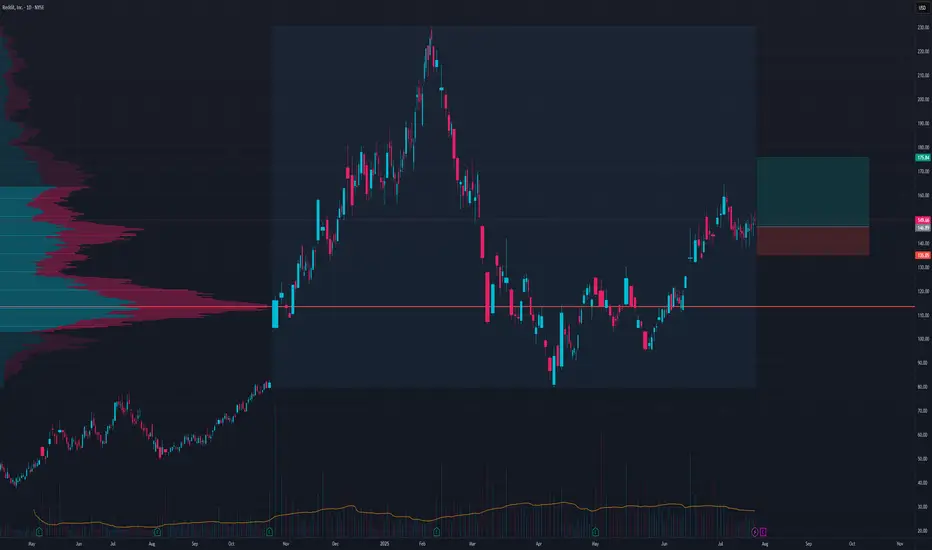
RDDT LongOn a pullback to 146 there is a 2.45 risk to reward setup
I like the volume accumulation here it seems prime to push out of this volume profile
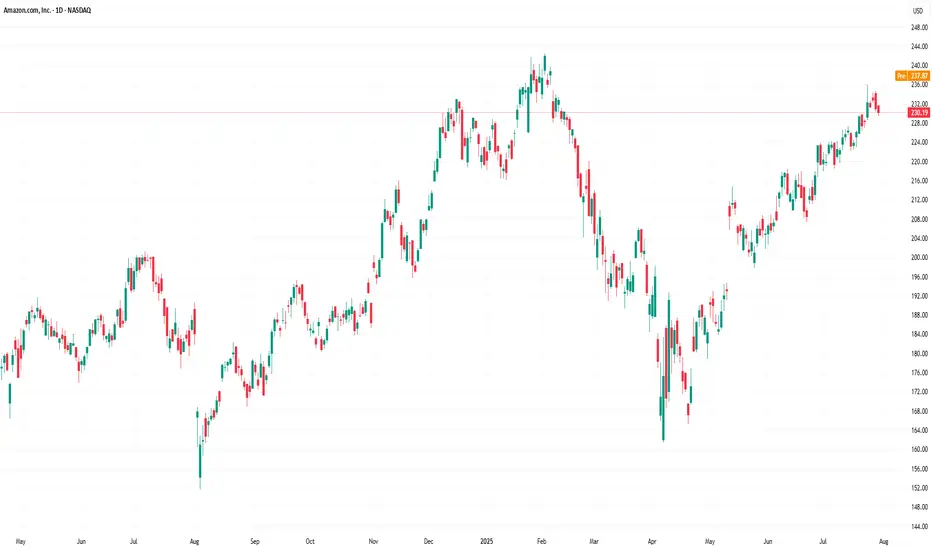
Amazon (AMZN) Shares Rise Ahead of Earnings ReportAmazon (AMZN) Shares Rise Ahead of Earnings Report
Today, 31 July, Amazon is set to release its quarterly earnings after the close of the regular trading session. Available data show that Amazon (AMZN) shares are exhibiting bullish momentum, reflecting positive market expectations:
→ In July, AMZN shares have outperformed the S&P 500 index (US SPX 500 mini on FXOpen);
→ Yesterday, following the end of the regular session, AMZN shares surged by approximately 3% in after-hours trading.
The rise in AMZN comes amid strong earnings reports from other tech giants, such as Microsoft (MSFT) and Meta Platforms (META). For example, MSFT shares rose by more than 8% in post-market trading. Their success has likely fuelled optimism that Amazon’s upcoming report will also impress.
All of this has brought noticeable changes to the technical outlook for the AMZN stock price.
Technical Analysis of the Amazon (AMZN) Chart
Following the release of the previous earnings report, price movements have formed an upward channel, as indicated by the Regression Trend tool. However, in recent days, a series of bearish signals emerged:
→ On Thursday, AMZN broke above the $230 level (marked by an upward arrow), but the session closed well below the highs – a sign of selling pressure;
→ Friday and Monday’s sessions produced candles with small bodies, indicating market indecision;
→ On Tuesday, bears took the lead (marked by a downward arrow), with a relatively long candle closing near the session low.
Thus, the chart gave reason to assume that optimistic sentiments were waning. However, today’s session is likely to open near the $237.30 level, effectively negating the bearish interpretation of the previous five candles and shifting momentum back in favour of the bulls.
In this context:
→ Support could be provided by the $230 level as well as the median of the Regression Trend channel;
→ Key resistance could be found at the previous high of $242.23 and the psychological level of $250.
Whether AMZN can surge to a new all-time high will largely depend on the company’s performance in AI – a theme that remains highly relevant in 2025.
This article represents the opinion of the Companies operating under the FXOpen brand only. It is not to be construed as an offer, solicitation, or recommendation with respect to products and services provided by the Companies operating under the FXOpen brand, nor is it to be considered financial advice.
Microsoft Soars to Record High Following Strong Earnings ReportMicrosoft Stock (MSFT) Soars to Record High Following Strong Earnings Report
As the chart illustrates, Microsoft (MSFT) shares surged sharply after the close of the regular trading session – an immediate market reaction to the company’s strong quarterly results.
According to available data, MSFT's post-market price jumped to $555 per share, exceeding its previous all-time high by more than 8%.
Why Did MSFT Share Price Rise?
The quarterly report provided several reasons for optimism, including:
→ Earnings per share (EPS) came in at $3.65, beating analysts’ expectations of $3.37 by over 8%. Revenue also exceeded forecasts, totalling $76.4 billion versus the projected $73.9 billion.
→ Microsoft’s cloud revenue rose by 27% to $46.7 billion, while Azure’s annualised revenue exceeded $75 billion, driven by growing demand for AI-related services.
In response to these results, Barclays analysts quickly raised their price target for Microsoft shares from $550 to $625.
Technical Analysis of MSFT Chart
It is worth noting that the previous quarterly report was also strong, resulting in the formation of a large bullish gap on 1 May, followed by a sustained upward trend (highlighted by the purple trendline S). Importantly, the gap in the $395–425 range remains unfilled.
Yesterday’s report is also likely to result in a large bullish gap at the market open today, though this time, the market context could lead to a different scenario.
The key factor here is the long-term ascending channel (shown in blue), which reflects MSFT’s price movements throughout 2024–2025. After the previous strong report, the share price moved from the median to the upper boundary of the channel without setting a new record high. However, following the most recent report, the price has surged deep into overbought territory, potentially setting a multi-month high on the RSI and achieving a significant breakout to a new record.
As a result, once the initial excitement around the earnings subsides – and the desire of investors to close long positions intensifies – MSFT could undergo a correction from the upper boundary of the channel. In this scenario, the following support levels could come into play:
→ The psychological level of $550 in the short term;
→ The S trendline, as a possible support during a deeper correction.
This article represents the opinion of the Companies operating under the FXOpen brand only. It is not to be construed as an offer, solicitation, or recommendation with respect to products and services provided by the Companies operating under the FXOpen brand, nor is it to be considered financial advice.