QBTS Pops With Volume – Holding Above All Anchored VWAPsQBTS surged nearly 10% today on above-average volume (50M vs. 46M MA) and is currently trading above all key anchored VWAP levels. Price reclaimed the short-term breakout zone and showed strong buyer interest near the yellow VWAP band.
This continuation move is happening with healthy volume expansion and support from recent consolidation. If price holds above $18.50, a test of the $22–24 resistance zone seems likely.
Indicators used:
Anchored VWAP from prior pivot lows and breakout zones (support)
Volume spike confirmation
Volume MA (context of demand strength)
Entry idea: On dip to $18.50 or reclaim of $19.50
Target: $22–24
Stop: Below $17.80

CCL Breakout With Strong Volume – Riding Above All Anchored VWAPCCL just broke out to new local highs with strong follow-through and volume rising above 15M. Price is well above all anchored VWAP levels, including the recent breakout VWAP (yellow line) and deeper trend VWAPs (green and blue), showing strong bullish momentum.
This kind of clean separation often signals the start of a new leg up.
If the breakout holds above $30, next key resistance is near $34–$36 based on prior major swing highs.
Indicators used:
Anchored VWAP (support from prior breakout and trend origin)
Volume (15M with increasing interest)
Volume MA as context (trending higher)
Entry idea: On any dip near $30 or continuation above $31
Target: $34–36
Stop: Below $29 (tight) or below yellow VWAP for a looser stop

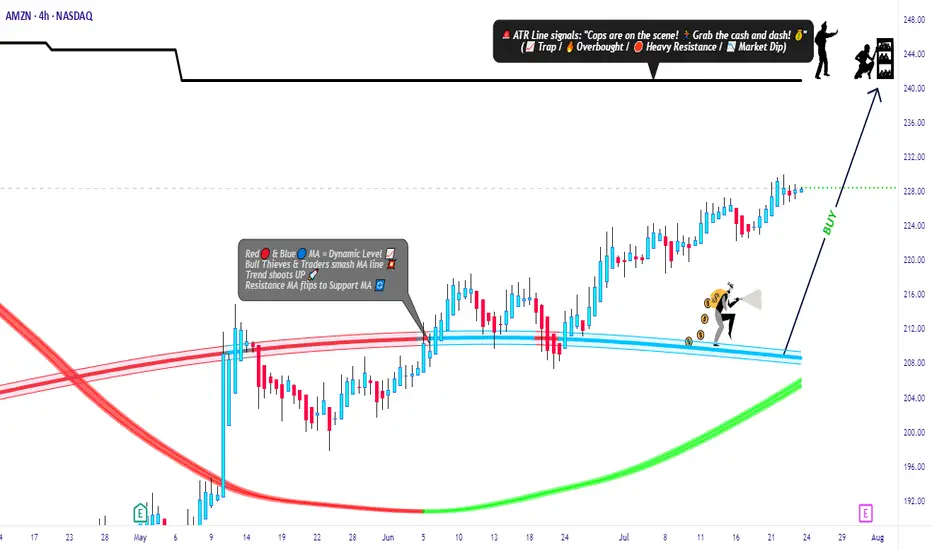
Amazon Market Robbery Blueprint – Swing/Scalp Long Setup🟨💣 “AMZN Market Heist Blueprint – Bullish Robbery in Progress 🚨💼💸” 💣🟨
By Thief Trader – Rob the Market with Precision
🌍 Hello World! Hi, Hola, Ola, Bonjour, Hallo, Marhaba!
🤑💰 Calling all Money Makers & Market Robbers – get ready to execute the next bullish heist on AMAZON.COM, INC (NASDAQ: AMZN), powered by our signature Thief Trading Style™ – where technical precision meets psychological warfare.
🔥 Plan Summary:
Based on our fundamental & technical intel, we’re eyeing a long entry into AMZN. The target? 💥The High-Risk ATR Police Barricade Zone – a zone flooded with liquidity, overbought conditions, fakeouts, and bear traps. It's where most traders get caught – but we walk in with a blueprint.
🟩 Entry Zone – “The Vault Is Wide Open!” 💼📈
🕰 Entry timeframe: 15min / 30min (preferably after confirmation or rejection wick)
💵 Buy Limit Orders: Place multiple layered entries (DCA-style) near recent swing lows/highs. Wait for breakout confirmation; no blind orders before breakout!
Thief Note: This isn’t spray-and-pray – this is sniper-mode. Scope, place, execute.🎯
🛑 Stop Loss – “SL is the Escape Route!”
📍 SL below recent 4H candle wick swing low (around 219.00 – adjust based on your risk/margin size).
Important: Only place SL after breakout; not before. Risk per order must match your lot strategy.
🎯 Target – “Grab the Bag or Escape Before the Alarms!”
💸 Target Zone: 240.00
🧠 Smart robbers know when to bail early – use a trailing SL to lock gains. Exit before reversal or heavy volume shift.
👀 Scalper Alert – “Only One Way – LONG!”
If you’re a quick thief with a fat bag, hit-and-run with a Long scalp. If you’re running lean, swing with the crew. Watch the PA and news timing. Trailing SL = insurance policy.
📊 Why Bullish? Here’s the Background:
🔍 Macro Drivers
💼 COT Report
🌍 Geo-political Influences
🧠 Sentiment Score
📈 Index Correlation
🔮 Intermarket Signals
💹 Institutional Positioning
All lights flashing green for short-to-midterm bullishness, but keep checking real-time updates.
⚠️ Risk Alert – News Triggers Can Blow Your Cover 🚨
🗞 Avoid trading near major news releases – they cause volatility spikes.
🧲 Always protect gains with trailing stops and don’t over-leverage your ammo.
💖 Support the Robbery – Hit BOOST 🔥
Smash that 💥BOOST💥 button if you ride with the Thief Trading Crew!
Let’s build this into the #1 robbery squad on TradingView.
Make money. Protect profits. Trade like a bandit – with a plan. 💼📈🏆
🔔 Stay Tuned for the Next Robbery Mission 🔔
Another heist plan dropping soon. Until then, rob smart, rob safe, and rob rich.
– Thief Trader™ | Rob The Market. Not Your Wallet.
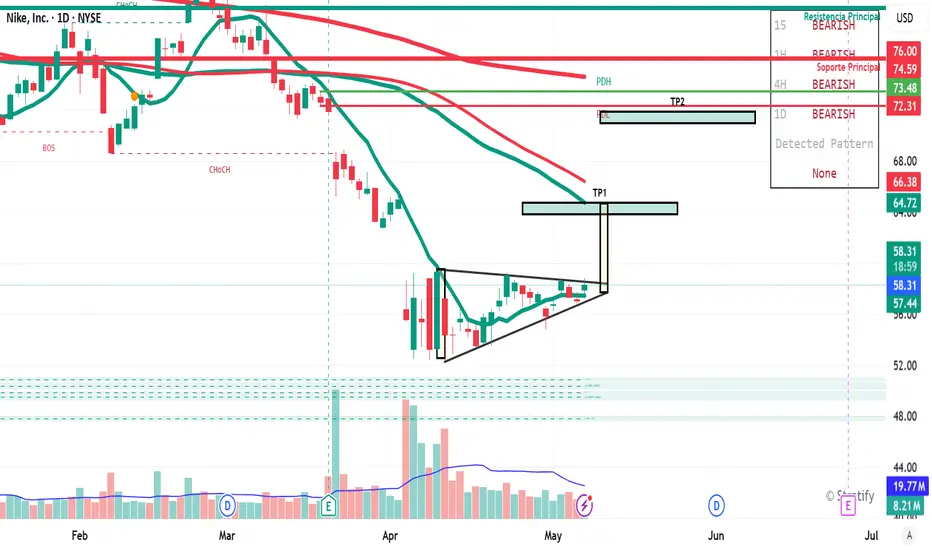
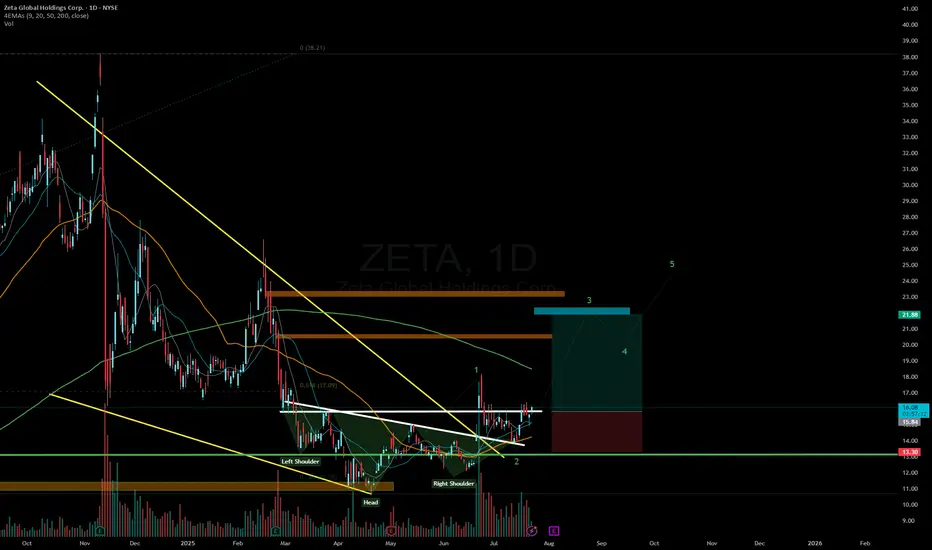
Possible Scenarios for Nike🔺 Pattern:
An ascending triangle is forming, which is a bullish technical pattern if it breaks out with volume above the resistance level.
The TP1 (Take Profit 1) marked in the $64.72–$66.38 USD zone is logical and aligns with previous resistance levels.
🟢 Bullish Signals:
Imminent triangle breakout: if the price strongly surpasses the $59–$60 USD range, it confirms the pattern.
Increasing volume on previous green candles: a good sign of accumulation.
Slightly expanding Bollinger Band: may indicate the beginning of a stronger move.
EMAs are flattening, with a possible future crossover if a rally confirms.
🔴 Risks and Key Levels to Watch:
The macro trend remains bearish: several timeframes (15m, 1H, 4H, 1D) show "BEARISH" zones.
Strong resistances: around $64.72, and especially between $72.31 and $76.00 USD.
If the breakout fails and price drops below $57.43, the pattern is invalidated and price may seek support at lower levels ($52–$50).
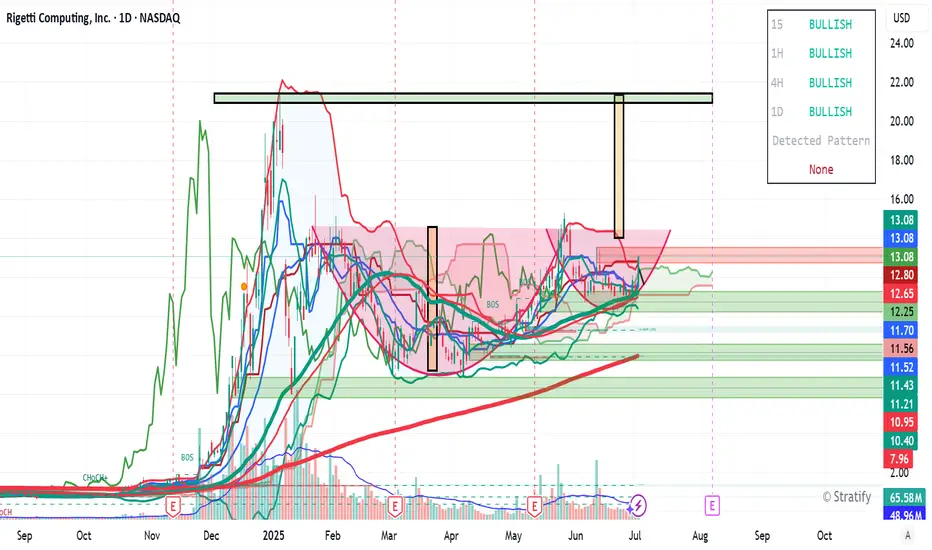
Waiting for a pullbackI have sold an get some gains but still thinking that NASDAQ:RGTI will fly sooner
At this moment, just watching and waiting for a pullback to enter again at $12 level
OCGN in triangleOCGN seems to me to be in a continuation triangle,
above 1,18 it confirm the breakout above,
otherwise a retur to new lows


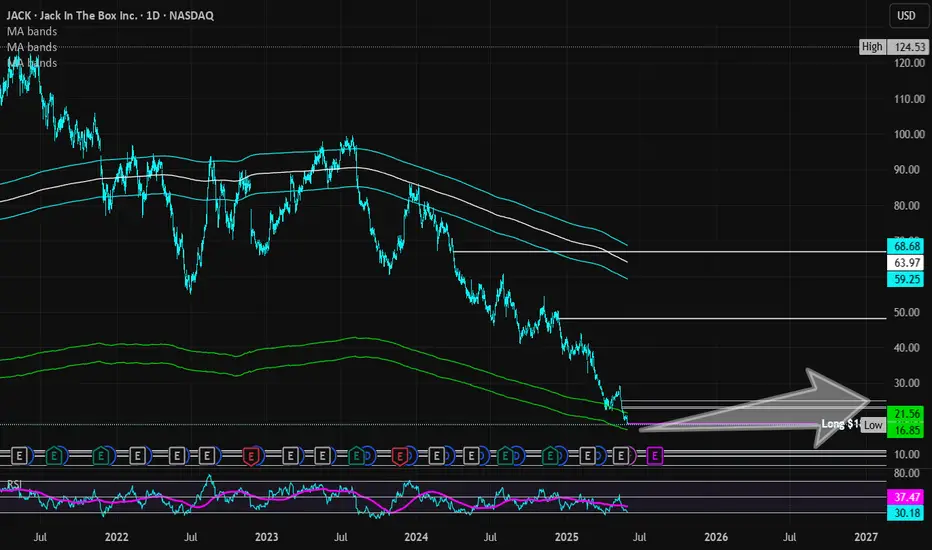
Jack in the Box | JACK | Long at $18.48Jack in the Box NASDAQ:JACK has taken a massive hit to its stock price since its peak in 2024 at just over $124 a share. It's currently trading around $18 and has entered my "crash" simple moving average zone. More often than not, this area signifies a bottom (or future bounce), but I view it more as a consolidation area to accumulate shares. Float = 18M; short interest = 19%...
Looking at NASDAQ:JACK fundamentally, this isn't the healthiest of restaurant companies. It is using a high level of debt to finance its operations and a high dividend yield of 9.28%. The company's revenue and profits have been slowly declining since 2023, as well. However, after 2025, the company anticipates a slow turnaround to begin. It will be closing 80-120 restaurants across the U.S. in 2025, which is a positive to help the company moving forward. NASDAQ:JACK also just got a new CFO and they are (at least from an outsider's view) attempting to change to generate share value. At this share price, I believe the company is in dire straits to get some investor confidence back. It's a strong name with long history.
While the stock price may hit true resistance at just under $17, NASDAQ:JACK is in a personal buy zone at $18.48. Targets are set low due to economic uncertainty.
Targets:
$23.00 (+24.5%)
$25.00 (+35.3%)
Breakout soonIm not in a position here but if I were to choose it'd be bullish. It might test the weekly highs if not even break above. I don't know too much about their fundamentals but the technicals look ok for a possible monthly swing.

Bullflag breakout?NASDAQ:DPRO
Appears to be a break out of bull flag. Would like to see a squeeze to $9+

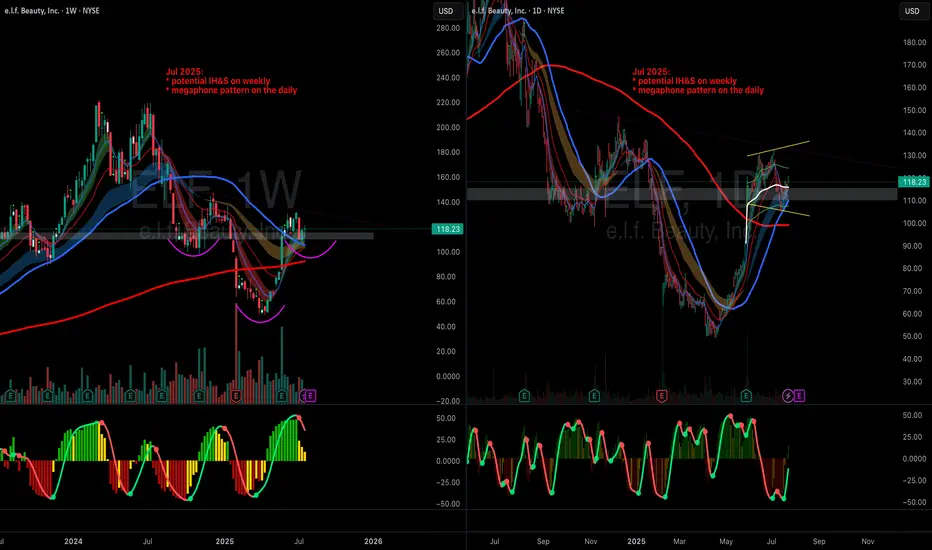
ELF next leg up
NYSE:ELF bounced off of the 50 DSMA and inside a megaphone pattern on daily.
Also, looking at the weekly, there is an Inverse head and shoulder pattern in the making with the current price action forming the right shoulder...
Looking for a continuation move higher here... targets 140 & 150
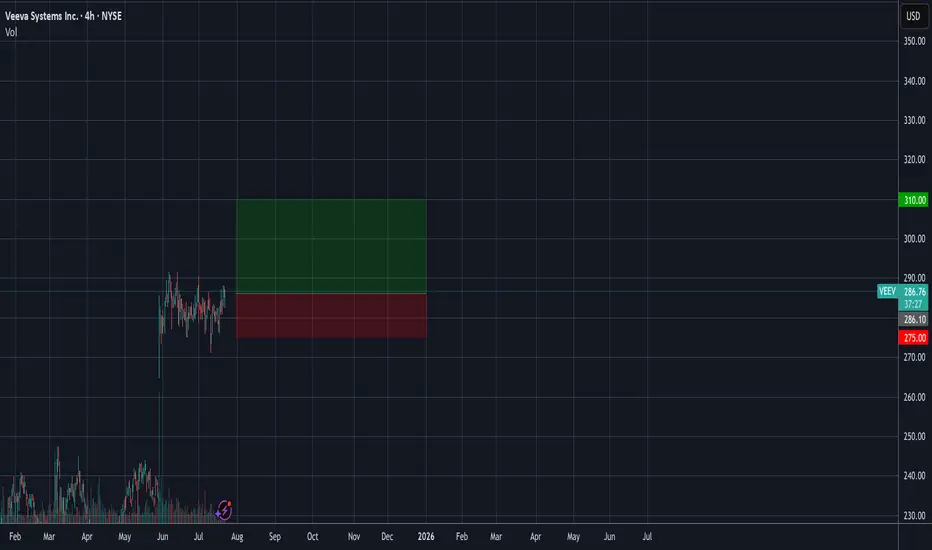
Rare combo of Ichimoku, clean flat base breakout, + fundamentalsChart Pattern Clean flat base, 6+ weeks tight, low volatility, clear breakout level at ~$291.69. Strong structure.
Ichimoku Trend Price above cloud, Kijun < Tenkan, bullish future cloud, Chikou above price. Full bullish alignment.
Momentum Indicators - RSI and MACD both showing strength or early crossovers — confirming price strength.
Fundamentals - Top-tier EPS/Composite ratings (99/99), strong revenue growth, raised guidance.
Institutional Behavior Volume dry-up during base formation = likely institutional accumulation, not retail noise.
Multiple Confirmation Layers Rare convergence of pattern, trend system (Ichimoku), and fundamental support
AVGO Long1. Broader Market Structure
1.1 Change of Character (CHoCH)
A clear Change of Character occurred at $290.53, where price broke below a prior higher low. This was a key early signal of a potential bearish reversal, as bullish momentum began to weaken and sellers stepped in with conviction.
1.2 Break of Structure (BOS)
Following the CHoCH, a Break of Structure was confirmed at $289.29. Price broke below the prior swing low, confirming a transition to a bearish market structure and validating the developing downtrend.
2. Supply and Demand Zones
Supply and demand zones are pivotal in understanding institutional behavior and predicting likely areas of price reaction.
2.1 Demand Zones (Green)
These zones mark levels where buying pressure has historically been strong, often signaling areas of institutional accumulation.
Zone A: $276.00 – $277.50
Most recent reaction zone with a long lower wick on July 23.
Indicates strong buy-side interest and likely first level of defense if price pulls back.
Zone B: $270.00 – $272.50
A deeper demand zone, formed around July 14–15.
Represents a base for the previous bullish rally and acts as a swing-level support.
Zone C: $269.00 (extreme low)
A structural low marking the last major demand level before a trend breakdown.
A violation here would shift sentiment toward a longer-term bearish outlook.
2.2 Supply Zones (Red)
These are areas of historical selling pressure, often aligning with distribution phases or resistance from unfilled institutional sell orders.
Zone X: $282.50 – $284.00
Formed during the sharp selloff on July 22.
The first upside resistance where sellers may re-enter.
Zone Y: $288.00 – $290.53
High-timeframe supply aligning with the CHoCH and swing high.
Significant distribution zone that must be broken decisively to confirm bullish reversal.
3. Price Action Within the Bordered Region
Price is currently trading around $279.58, just above the local demand zone.
Expecting a pullback into the $276–$277.50 zone (Zone A), allowing liquidity collection and re-entry from institutional buyers.
If this demand zone holds and price forms a higher low, a bullish continuation is likely—targeting the $282.50–$284.00 supply zone.
A further break above this area could attempt to revisit the macro supply at $288–$290.53.
Invalidation: A clean break and close below $276.00 would expose the price to deeper downside into Zone B or Zone C.

OVERSOLDLooking for back over 300 quickly CEO just $2.44 million strong Q2 revenue growth of 14.3% year-over-year to $49.42 billion, revenue is as good as it was at 500$ but expenses have been high. Institutions are loading here, good long-term hold if we need to continue DCA.

AAPL LIVE PRICE ACTION JULY 23 2025This is the price action for AAPL. I have discussed indicators as well. Do not blindly trade without understanding the logics. I am long here with stocks only.
NOTE: DO NOT BLINDLY BUY

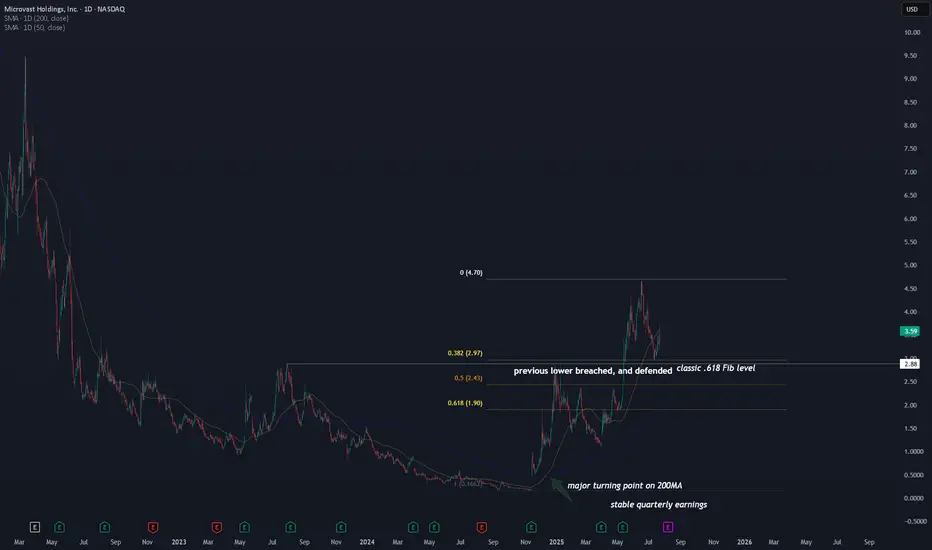
MVST, beginning of the new lithum hype? With ongoing US-China trade war, one of the key issues resides on lithium battery technology . Lithium technology is brought up as a national security concern . This is a tailwind for the industry .
Now let's get to the technicals.
A major turning point on the 200MA . We haven't seen this happening since Dec 2020, when the stock first went public.
$3.00 key level is tested three times . This is not just a .618 Fib level, but the previous cycle high in 2023.
First test happened during Dec 2024, which it failed. Second time we saw the stock blew through this key level on May 2025. Lastly we saw a solid defense on this level on July 2025. If this level were to hold, the upside can be very high .
In addition to the technical side, the company is generating $100M revenue with neutral/break-even earnings this year, up from $60-80M in 2023 and 204. A steady increase in revenue , while not losing much from earning perspective.
This places NASDAQ:MVST at a tipping point . All it needs is some tailwinds from the new geopolitical conflicts , and we will see either an increase in revenue (scale up) or an improvement in profitability. Or both. If that were to happen, MVST will skyrocket.
I am watching and monitoring this stock as right now, I am expecting to add MVST to my portfolio once I see further confirmation.
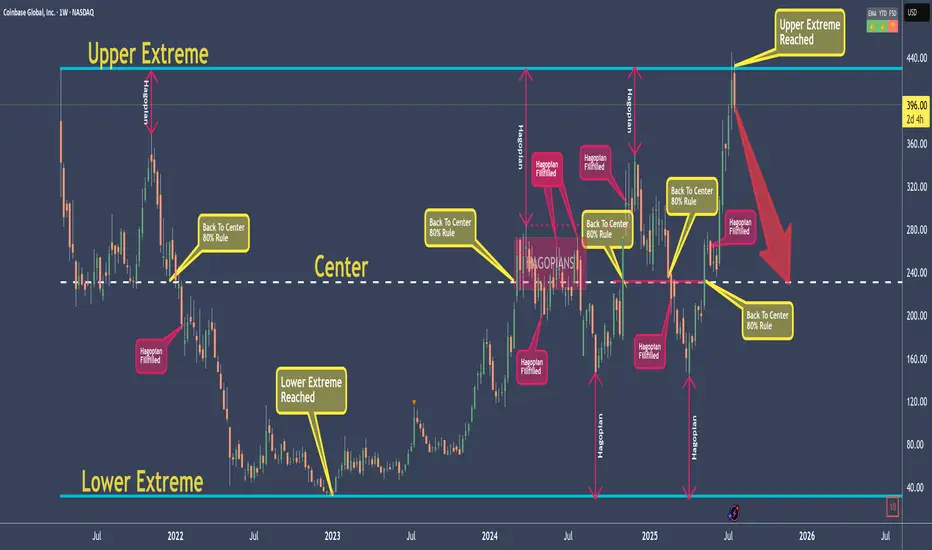
COINBASE - My rules say: Down with high probabilityI don't elaborate too much here, because I want to give you a chance to learn something!
As for the Trade, my rules say that it is a good Short.
The Short is not valid anymore, if price open and close above the Upper Extreme!
So, what are the rules?
Well, that's exactly what you will learn today ;-)
Go to my previous post which I will link, and you find everything you need to jump on the Steam-Train if you like.
As my old Mentors always said: "Larn To Earn"
Happy Profits Guys & Gals §8-)
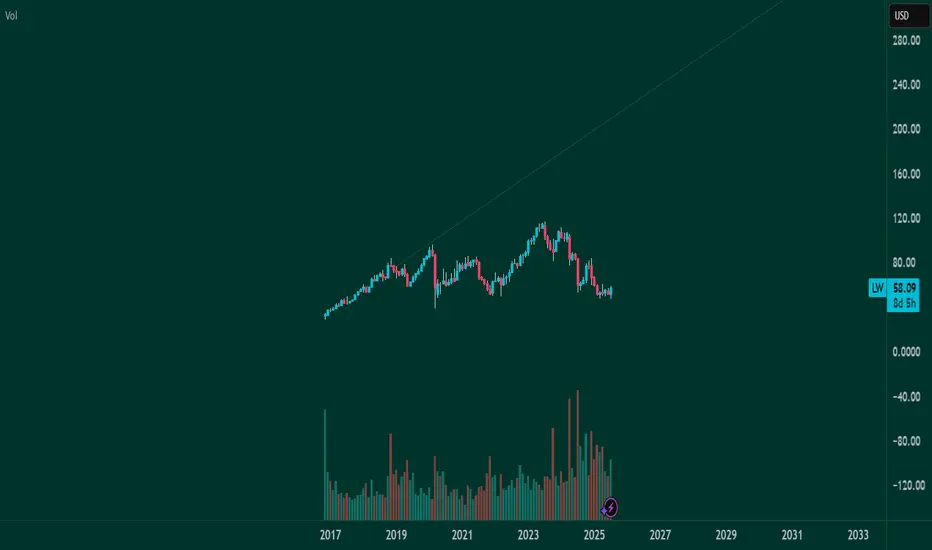
75 by year end?This may hit 75 soon, may be by end of the year. I am buying any dip from current price. All the best. Not a financial advise.
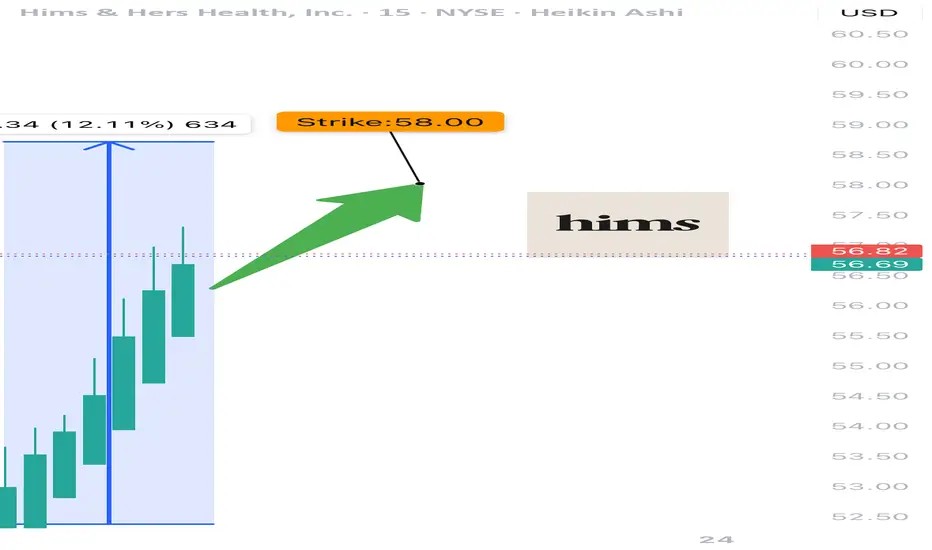
HIMS WEEKLY BULLISH PLAY — 07/23/2025
🩺 HIMS WEEKLY BULLISH PLAY — 07/23/2025
📈 Momentum Up, Flow Bullish, Time Tight — Let’s Ride It
⸻
🔍 MARKET SNAPSHOT
5-model AI consensus = ✅ BULLISH
Why?
• 📈 Weekly RSI = 58.2 (Rising) — Clear momentum
• ⚖️ Call/Put Ratio = 1.63 — Big call volume (45K+)
• 📉 Volume = 0.9x — ⚠️ Slight institutional hesitation
• 🌪️ VIX = 16.0 — Low volatility = smoother execution
⸻
🎯 TRADE IDEA — CALL OPTION PLAY
{
"instrument": "HIMS",
"direction": "CALL",
"strike": 58.00,
"entry_price": 0.86,
"profit_target": 1.72,
"stop_loss": 0.43,
"expiry": "2025-07-25",
"confidence": 75%,
"entry_timing": "Open",
"size": 1 contract
}
⸻
📊 TRADE PLAN
🔹 🔸
🎯 Strike 58 CALL
💵 Entry 0.86
🎯 Profit Target 1.72 (+100%)
🛑 Stop Loss 0.43 (tight risk)
📅 Expiry July 25 (2DTE)
⚡ Confidence 75%
📈 Size Suggestion Risk 2–3% of capital
⚠️ Key Risks Low volume + high gamma exposure
⸻
🧠 MODEL TAKEAWAYS
✅ RSI and momentum are clearly aligned upward
✅ Call flow = bullish commitment
⚠️ Volume is light → watch for momentum stalls
⚠️ Gamma risk = manage tight, exit fast
⸻
💬 Drop a 🧠 if you’re tracking
📈 Drop a 💥 if you’re in this call
🛎️ Trade tight — expiration Friday, HIMS is moving on momentum not mass
#HIMS #OptionsTrading #CallOptions #BullishPlay #MomentumTrade #ZeroDTE #GammaScalp #AITrading #HealthcareStocks
BAND is currently held by the 200 MANASDAQ:BAND is showing positive signs and may be ready to post some gains if it breaks above the 200 day moving average. Anticipated price action and targets are shown on the chart, stop loss daily close below 15.15$.
PS. My views only, not financial advice!

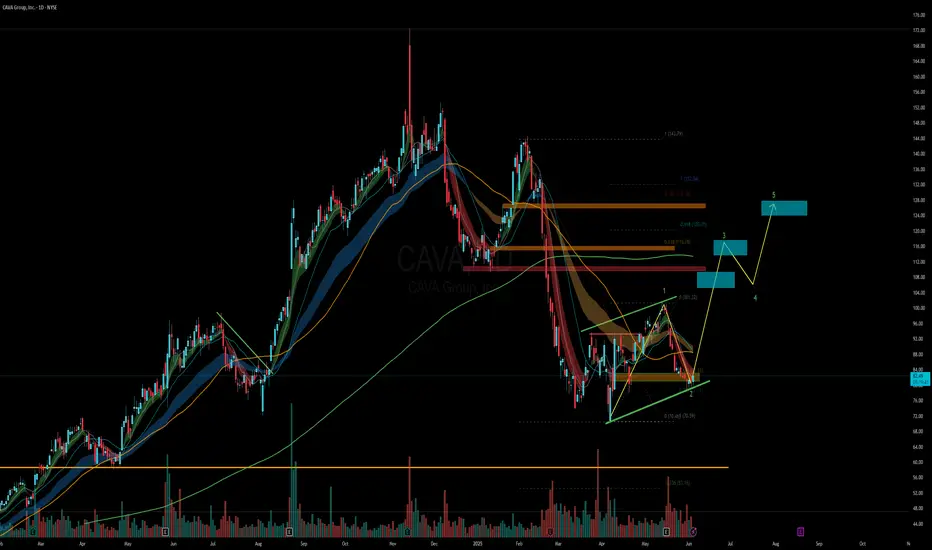
CAVA - Setting up good for a runCAVA looks good here, ambiguously looking like a bear flag though.
But if it holds these levels can see a good run upto 100+
Target 1 - 100
Target 2 - 110
Target 3 - 130
OPEN WEEKLY TRADE SETUP — 07/23/2025
🏠 OPEN WEEKLY TRADE SETUP — 07/23/2025
📈 Volume Surge + Call Flow = Bullish Bias Confirmed
⸻
🔍 MARKET SNAPSHOT
All major models signal STRONG WEEKLY BULLISH bias, supported by:
• 📊 Weekly RSI = 85.9 (RISING) → 🚀 Momentum confirmed
• 📉 Daily RSI = 83.3 (FALLING) → ⚠️ Overbought zone, short-term pullback possible
• 📈 Volume Ratio = 6.7× Last Week → Big accumulation
• 🔁 Call/Put Ratio = 1.35 → Flow favors upside
• 🌪️ VIX = 16.1 → Normal regime = Clean premium action
⸻
🎯 TRADE IDEA — CALL OPTION PLAY
{
"instrument": "OPEN",
"direction": "CALL",
"strike": 2.50,
"entry_price": 0.26,
"profit_target": 0.39,
"stop_loss": 0.13,
"expiry": "2025-07-25",
"confidence": 80%,
"entry_timing": "Open",
"size": 1 contract
}
⸻
📊 TRADE PLAN
🔹 🔸
🎯 Strike 2.50 CALL
💵 Entry Price 0.26
🎯 Target 0.39 (+50%)
🛑 Stop Loss 0.13 (risk control)
📅 Expiry July 25 (2DTE)
📈 Confidence 80%
⚠️ Risk High gamma + overbought daily RSI
💡 Size Tip Keep risk to 2–4% of account capital
⸻
🧠 MODEL CONSENSUS
• ✅ All models agree: Weekly trend = UP
• ✅ Heavy call flow centered around $2.50
• ⚠️ Caution on timing: falling daily RSI = maybe wait for early dip?
⸻
💬 Drop a 🟩 if you’re riding OPEN
📈 Drop a 🕒 if you’re waiting for the dip
🚀 Looks like momentum wants to go higher — but gamma’s real, manage tight!
#OPEN #Opendoor #OptionsTrading #CallOptions #WeeklySetup #BullishTrade #GammaRisk #VolumePlay #TradingIdeas #AIPoweredAnalysis
