Red Cat Holdings (RCAT) – Soaring with Defense & Global DemandCompany Snapshot:
Red Cat NASDAQ:RCAT is an emerging UAV (drone) technology leader, rapidly scaling through defense-grade contracts, global expansion, and vertical integration.
Key Catalysts:
Defense Sector Traction 🎯
Recent U.S. DoD contract wins underscore RCAT’s credibility as a mission-critical UAV supplier.
Sequential revenue growth in earnings signals accelerating adoption in defense and commercial markets.
Global Expansion Strategy 🌐
RCAT is diversifying via allied procurement programs, reducing dependence on U.S. defense budgets and broadening international exposure.
Tech Stack Integration ⚙️
Strategic acquisitions are bolstering RCAT’s in-house capabilities—driving vertical integration, improving margins, and fueling innovation velocity.
Investment Outlook:
Bullish Entry Zone: Above $8.50–$9.00
Upside Target: $15.00–$16.00, supported by defense contract momentum, global reach, and a strengthened tech edge.
🛡️ RCAT is becoming a high-leverage play on modern defense tech with scalable, global upside.
#RCAT #DefenseStocks #UAV #DroneTechnology #MilitaryContracts #Innovation #DoD #Aerospace #Geopolitics #GrowthStocks #VerticalIntegration

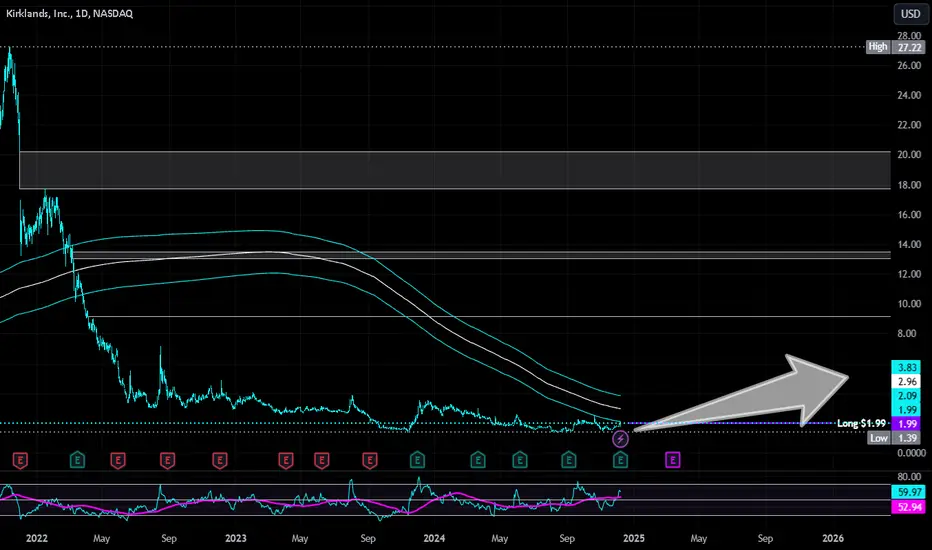
Kirklands | KIRK | Long at $1.99Kirklands $NASDAQ:KIRK. A strong move may be brewing... The historical simple moving average (SMA) is flirting with the price and has yet to break the barrier - which often results in a sharp price increase. The downward trend is finally starting to reverse based on this measure, too. While it may not soar to crazy highs like in 2021, the chart setup is exactly what I like to see for an anticipated move up as it consolidates. A 12M float and 7% short interest could get the ball rolling if/when the price breaks into the historical SMA.
Fundamentally, NASDAQ:KIRK is a small-cap with $114 million in sales. It recently partnered with NYSE:BYON as an exclusive licensee of Bed Bath & Beyond neighborhood stores, positioning the company as a multi-brand retailer. The first Bed Bath & Beyond neighborhood store is planned for a 2025 opening. Could this be the force for a future price move? Time will tell.
At $1.99, NASDAQ:KIRK is in a personal buy zone.
Target #1 = $2.50
Target #2 = $2.75
Target #3 = $3.00
Target #4 = $4.00
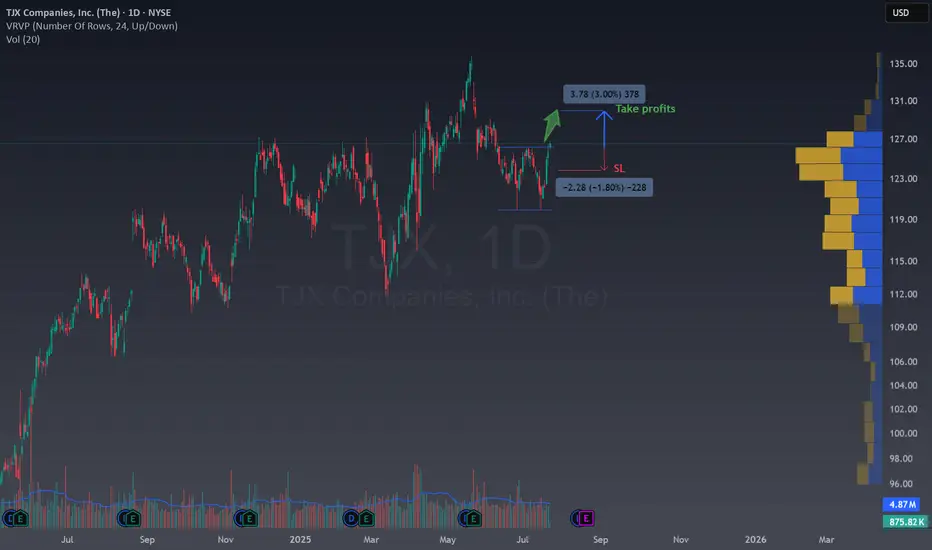
Easy double bottom in TJXTechnical Overview
NYSE:TJX is currently trading around $126.72 and is forming a double bottom.
Breaking the 126$ activates the double bottom in the middle of a bull trend , which is a bull pattern inside another bull pattern, could you imagine a better moment to buy?
Fundamental Arguments
Consistent Growth: TJX has delivered steady revenue and earnings growth. For 2024, it reported $54.2B in revenue and $4.5B in net earnings, outperforming direct retail peers.
Strong Business Model: TJX's off-price retail is resilient, benefiting in uncertain consumer environments due to value-seeking behavior.
Expansion & Dividend Growth: The company continues to expand both domestically and internationally, recently raising its dividend by 13% and targeting projected store footprint expansion.
Trade Setup Idea
Buying the breakout is a great moment to see the price rallying at least a 3% until the take profits. A SL of 1,80% can be set up to avoid large loses if the price change the direction.
The idea gives a great risk reward ratio for traders and a very easy to understand entry and exit level.
💬 Does this setup align with your view on TJX?
🚀 Hit the rocket if this helped you spot the opportunity and follow for more clean, educational trade ideas!
TSLA WEEKLY CALL SETUP — 07/23/2025
🚀 TSLA WEEKLY CALL SETUP — 07/23/2025
📈 AI Consensus Signals 🔥 Bullish Move Incoming
⸻
🔍 SENTIMENT SNAPSHOT
5 AI Models (Grok, Gemini, Claude, Meta, DeepSeek) =
✅ MODERATE BULLISH BIAS
➡️ Why?
• ✅ RSI Momentum (Daily + Weekly = UP)
• ✅ Bullish VIX sentiment
• ⚠️ Weak volume + neutral options flow
• 🧠 No model signals bearish direction
⸻
🎯 TRADE IDEA — CALL OPTION PLAY
{
"instrument": "TSLA",
"direction": "CALL",
"strike": 380,
"entry_price": 0.88,
"profit_target": 1.76,
"stop_loss": 0.44,
"expiry": "2025-07-25",
"confidence": 65%,
"entry_timing": "Open",
"size": 1 contract
}
⸻
📊 TRADE PLAN
🔹 🔸
🎯 Strike 380 CALL
💵 Entry Price 0.88
🎯 Target 1.76 (2× gain)
🛑 Stop Loss 0.44
📅 Expiry July 25, 2025
📈 Confidence 65%
⏰ Entry Market Open
⚠️ Risk High gamma / low time (2DTE)
⸻
📉 MODEL CONSENSUS
🧠 Grok – Bullish RSI, cautious due to volume
🧠 Gemini – Momentum confirmed, weekly strength
🧠 Claude – RSI + VIX = green light
🧠 Meta – 3 bullish signals, minor risk caution
🧠 DeepSeek – RSI + volatility favorable, careful on size
⸻
💬 Drop a 🟢 if you’re in
📈 Drop a ⚡ if you’re watching this flip
🚀 TSLA 380C looks primed if we break resistance near $376
#TSLA #OptionsTrading #CallOptions #WeeklySetup #AIPowered #MomentumTrade #TeslaTrade #GammaRisk #ZeroDTEReady

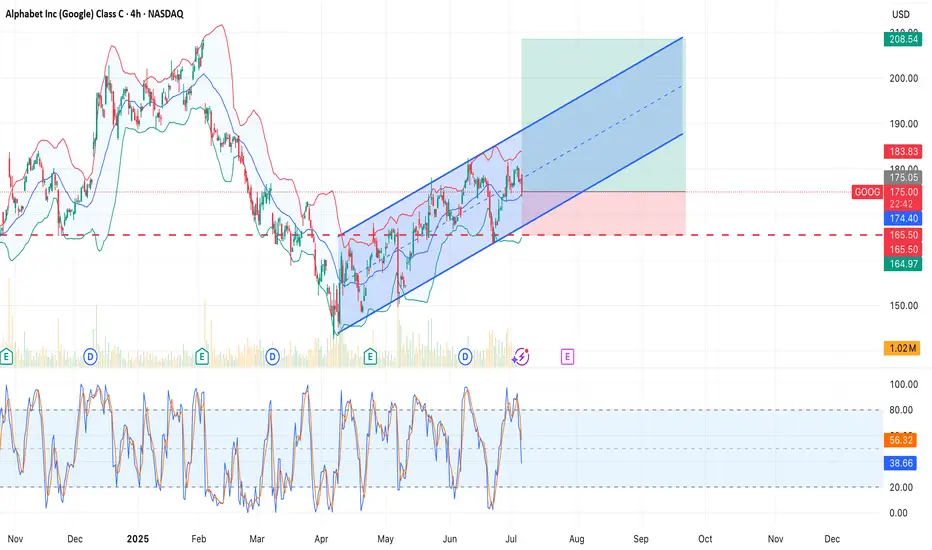
Momentum Watch: GOOG Entry ZoneNASDAQ:GOOG – Trend Continuation Setup
The price has been trending within a clean ascending channel since April 2025.
After a pullback toward the midline and Bollinger basis, price is showing potential support.
Setup:
• Entry: $175 (conceptual)
• Stop: $165.5 (below channel)
• Target: $208 (upper boundary)
• Risk/Reward: 3.51
Stochastic is retracing but remains above key support zone.
As long as the channel holds, expecting continuation toward $200–208 by late September.
⚠️ Market remains under pressure following July 9th events, which could increase short-term volatility across tech.
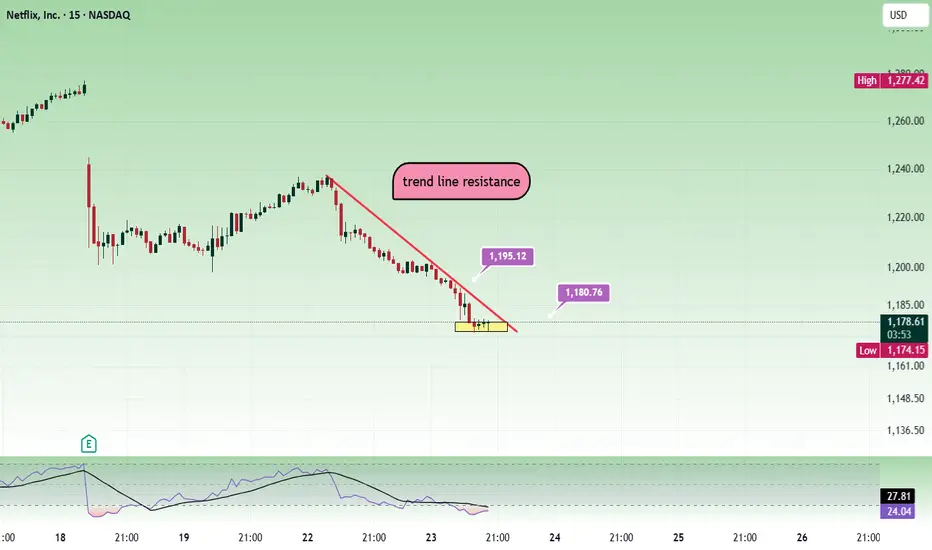
NetflixMay be people are not watching Netflix nowadays and the price is falling. 1200 is a strong resistance.
Sell below 1180 with the stop loss of 1195 for the targets 1165, 1150, 1130 and 1115.
Price can pull back towards 1190 and then fall. Its better to see bearish confirmation and trade.
Always do your own analysis before taking any trade.
NFLX WEEKLY BEARISH PLAY — 07/23/2025
📉 NFLX WEEKLY BEARISH PLAY — 07/23/2025
🧠 Multi-model AI Consensus Trade Setup
⸻
🔍 QUICK SUMMARY
After reviewing 5 AI model reports (Grok, Gemini, Claude, Meta, DeepSeek), the consensus is moderate bearish for NFLX this week following heavy institutional selling and post-earnings weakness.
💣 Key Reason:
All reports cite declining daily RSI, strong institutional outflows, and mixed-to-bearish volume trends. Despite some caution, the majority lean bearish.
⸻
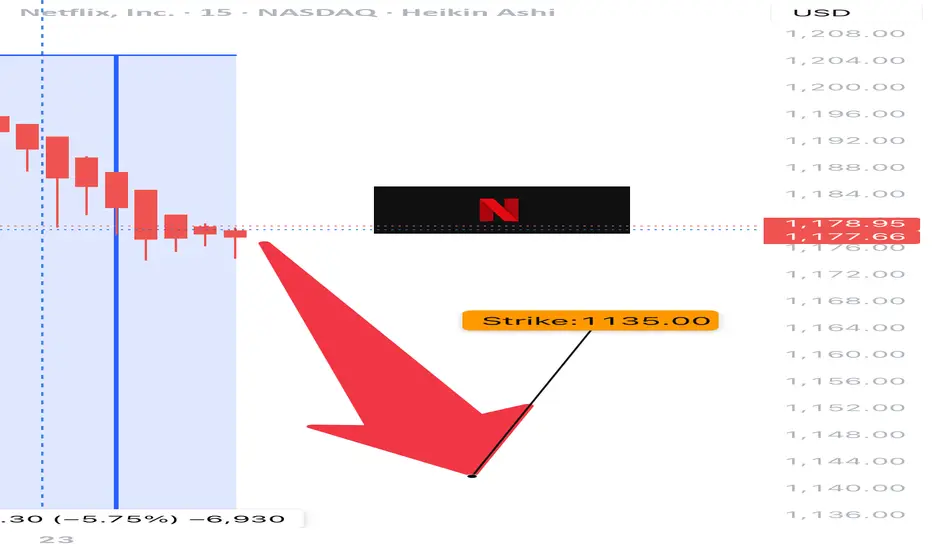
🎯 TRADE IDEA (WEEKLY PUT PLAY)
{
"instrument": "NFLX",
"direction": "PUT",
"strike": 1135,
"entry_price": 0.77,
"profit_target": 1.50,
"stop_loss": 0.41,
"expiry": "2025-07-25",
"confidence": 70%,
"entry_timing": "Open",
"size": 1 contract
}
⸻
📊 TRADE PLAN
🔹 🔸
🎯 Strike 1135 PUT
💵 Entry Price 0.77
🎯 Target 1.50 (approx. 95% upside)
🛑 Stop Loss 0.41
📅 Expiry July 25, 2025 (2DTE)
📈 Confidence 70%
⏰ Entry Market Open
🧠 Gamma Risk High (be nimble!)
⸻
🧠 Model Summary
• Gemini/Google: 🔻 Strong SELL — Institutional unload, 85% confidence
• Grok/xAI: ⚠️ NO TRADE — mixed signals
• Claude/Anthropic: ⚠️ NO TRADE — high sell volume, but conflicting indicators
• Meta/LLaMA: 🔻 Moderate Bearish — suggests 1175P but supports this setup
• DeepSeek: 🔻 Bearish lean — supports 1135P w/ caution on gamma/time decay
⸻
🚨 NOTES
• 🕒 Only 2DTE — expect volatility + fast decay
• 🔍 Watch price action into open + first 30 mins
• 📉 If NASDAQ:NFLX cracks below $1130 support zone, this setup could fly
⸻
💬 Drop a ⚠️ if you’re watching
💣 Drop a 🔻 if you’re in this PUT
📈 #OptionsTrading #NFLX #WeeklyTrade #AITradeAlert #MemeStocks #PutOptions #ShortSetup
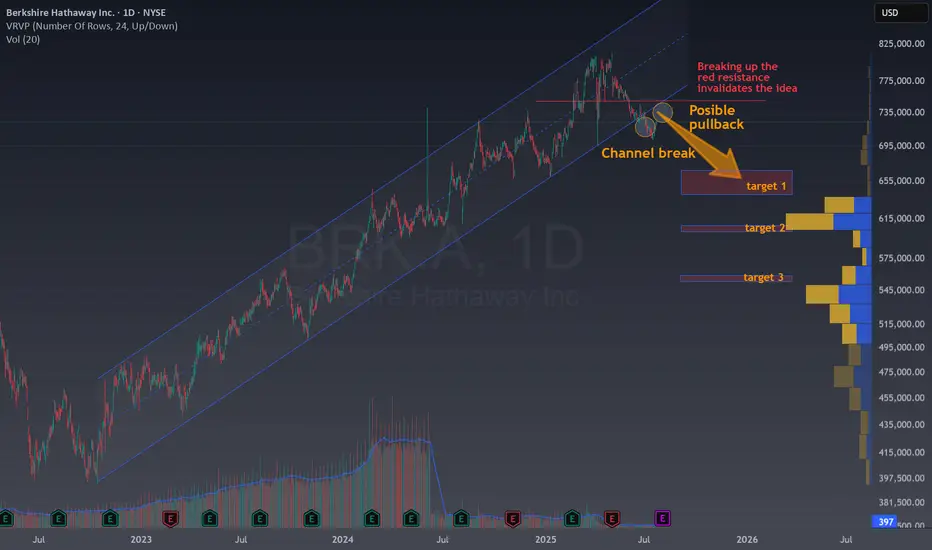
Berkshire is losing the Buffet's premiumTechnical Overview
Looking at the current NYSE:BRK.A chart, several signals suggest a potential shift from the prior bullish trend:
Channel Break : Price has broken down from a long-standing ascending channel, which often marks the end of an uptrend and the start of a consolidation or a bearish phase.
Possible Pullback: After the channel break, the chart highlights a likely pullback toward the broken support, now turned resistance. If BRK.A fails to retake this area, downside follow-through becomes probable.
Targets Identified:
Target 1: Around 655,000 USD, supported by a significant volume cluster.
Target 2: Near 615,000 USD, another high-volume historical support.
Target 3: Around 545,000 USD, marking a deeper retracement in case of extended weakness.
Invalidation: If price strongly reclaims the prior channel and breaks above the highlighted red resistance, the bearish idea should be reconsidered.
Fundamental Arguments
Berkshire’s largest holdings, particularly in tech, are sensitive to market corrections, especially in a rising rate environment, which can weigh on valuation multiples.
Growth in net earnings has moderated, with key segments (insurance, railroad, and energy) facing headwinds or margin pressures.
Diminishing Buyback Impact: With shares previously at all-time highs, Berkshire’s ability to use buybacks as strong downside support is reduced if valuation stays elevated or fundamentals drift.
Trade Setup
Entry Idea: Look for opportunities to go short or trade sideways after a failed retest of the broken channel, as seen on the chart.
Profit Targets: Use the volume-based support zones at 655,000, 615,000, and 545,000 USD.
Stop Loss: A convincing break back into the channel and above local resistance invalidates the setup.
This gives us opportunities to risk around 3 to 4% and earn more than 9%. A great Risk Reward ratio.
Laste note about channels
Trading after a channel break can offer strong open risk/reward setups, especially if fundamental forces align with the technical picture. While Berkshire Hathaway remains a resilient company, markets can enter periods of consolidation or pullback even for top-tier stocks. Always mix technical observation with a view on macro and company fundamentals for improved decision-making.
💬 Does this setup align with your view on BRK?
🚀 Hit the rocket if this helped you spot the opportunity and follow for more clean, educational trade ideas!
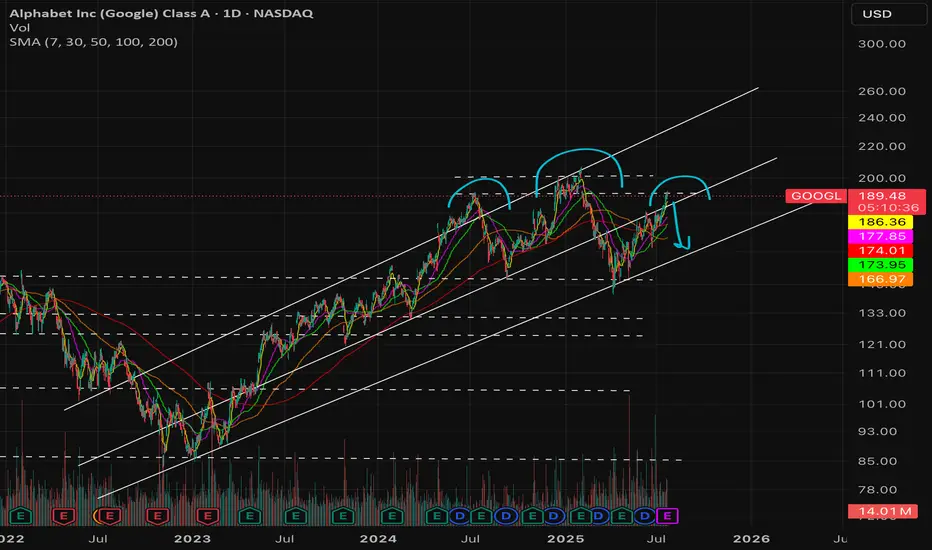
Head and Shoulders on $GOOGL right before earnings?- NASDAQ:GOOGL perhaps good news are already priced in?
- No positions on NASDAQ:GOOGL but interestingly it has given both bears and bull something to consider?
- Spectating what happens next!
- Interesting setup, bulls eyeing 200+ and bears targeting low 160s
- Good luck
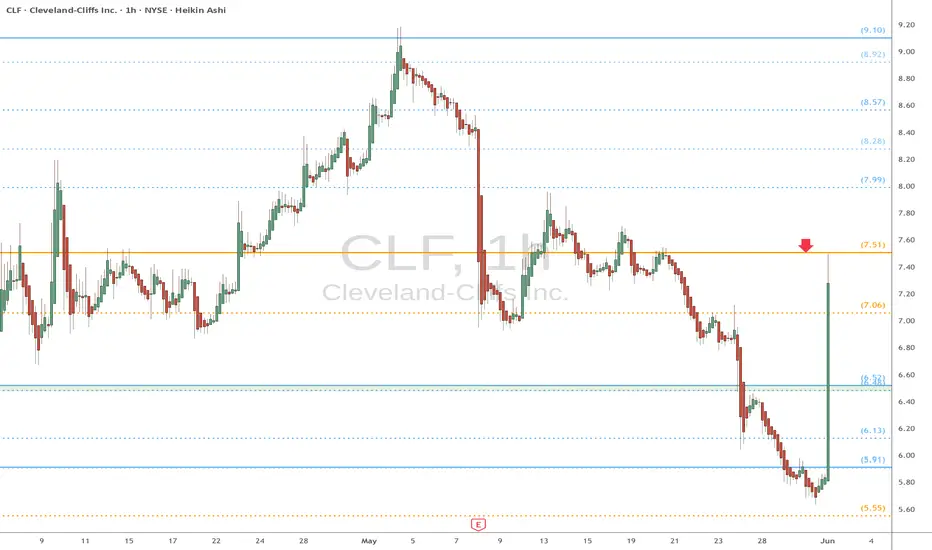
CLF heads up at $7.51: Golden Genesis fib may give a Dip buyCLF shot up strong after Trump increased tariffs on Steel.
It has just hit a Golden Genesis fib that may give us a dip.
Looking for a dip to $7.06 fib or a Break-n-Retest of 7.51
HOOD TIME FOR BOUNCE?HOOD on a 4 day pullback. Some big call flow just came in 105C 8/1/25 @ 4.40 $3.5 million in 4 orders.

TSLA VolanX Earnings Strategy: Short-Term Bearish Bias (TEST)🧠 VolanX Earnings Strategy: Short-Term Bearish Bias
🎯 Goal:
Capitalize on downside or neutral reaction to earnings with defined risk and IV crush protection.
🔻 Primary Trade: Bear Put Spread
Strategy: Buy Put at ATM, Sell Put at lower strike
Expiration: July 25, 2025
Structure:
Buy 330 Put
Sell 315 Put
Max Risk: Premium paid (e.g., $5–6 per spread)
Max Profit: ~$15 if TSLA closes ≤ 315
Breakeven: ~$325
📈 Why This Works:
Aligns with DSS projection ($317.74 30-day)
Short expiry captures earnings move + IV crush
Profits if stock stays below ~325 post-earnings
🟨 Alternative Trade: Neutral-to-Bearish Iron Condor
If expecting rangebound post-earnings:
Sell 340 Call / Buy 345 Call
Sell 315 Put / Buy 310 Put
Credit: ~$3.50–4.00
Max Risk: ~$1.50–2.00
Profit Zone: 315–340
Best if TSLA volatility collapses and price stays in a channel.
🧨 High-Risk, High-Reward: Put Ratio Backspread
Buy 2x 320 Puts
Sell 1x 330 Put
Cost: Small debit or credit
Profit: If TSLA tanks → big delta gain
Risk: Small near expiry if TSLA closes near 320–330
Use this only if expecting a big bearish surprise.
🔧 Risk Management:
Position size = max 1–2% of account
Avoid holding spreads past Jul 25 if IV collapses
Use alerts around 330 / 325 / 317.5 for exits
🧠 DSS-Backed Tagline:
"With DSS projecting a controlled pullback and flow confirming overhead hedging, we favor bearish verticals and vol crush plays going into earnings."

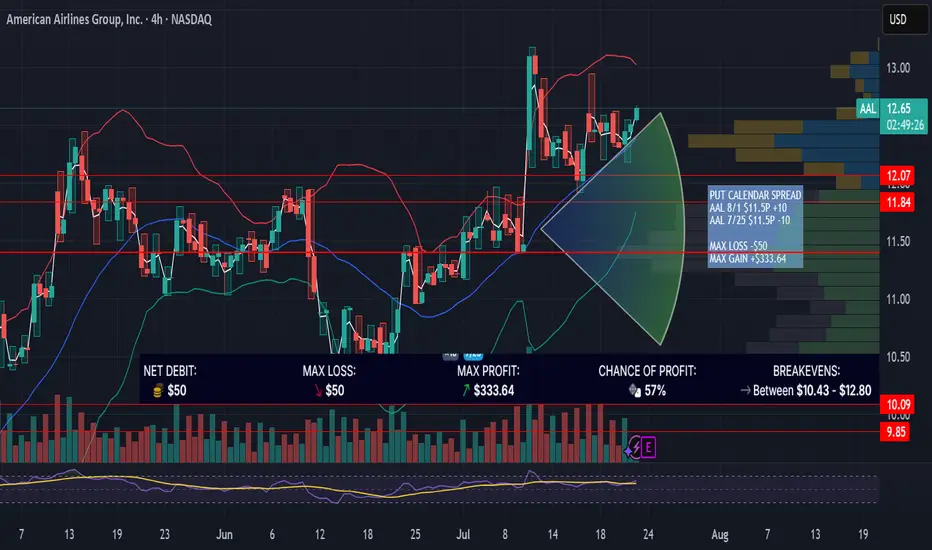
AAL PUT CALENDAR SPREAD / EARNINGSAAL is up 11% since 7/9/25 with a gap up riding on earnings of its competitor DAL. AAL earnings are in the morning on 7/24/25. Looking for a "sell the news" event with a good risk/reward options trade. This trade is designed for price to settle near the high volume node at $11.50 near expiration on 7/25/25.
PUT CALENDAR SPREAD
AAL 8/1 $11.5P +10
AAL 7/25 $11.5P -10
MAX LOSS -$50
MAX GAIN +$333.64
GME Stop Bullish Watching for a pullback and entry or a break over the last resistance and re-test and an entry to fill the gap up. (Not financial advice, just posting my thoughts and plan)

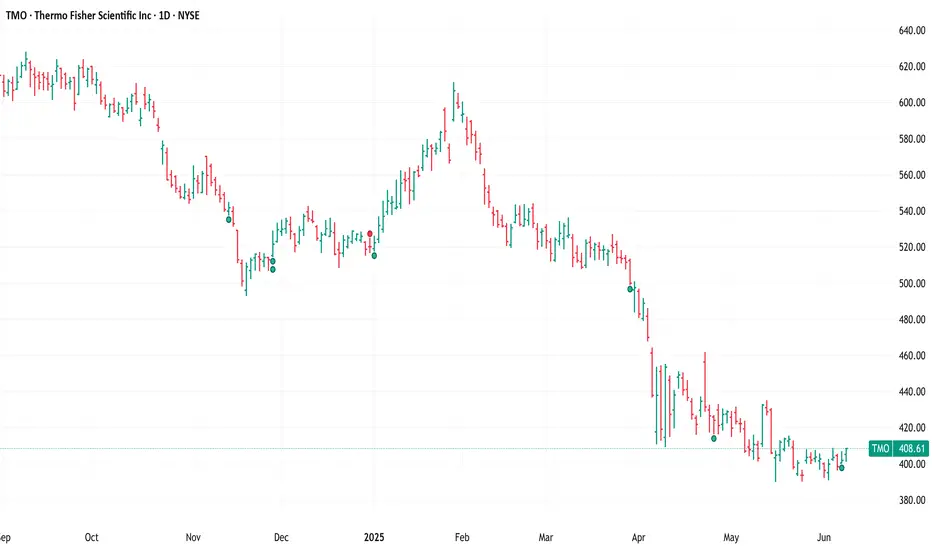
$TMO, Long, TP>15-25%NYSE:TMO , Long, TP>15-25%
Fundamentally the stock is good.
Choose an entry point and do not forget about a protective order if you are trading with leverage.
Don't risk it if you're not sure.
Good luck to everyone.
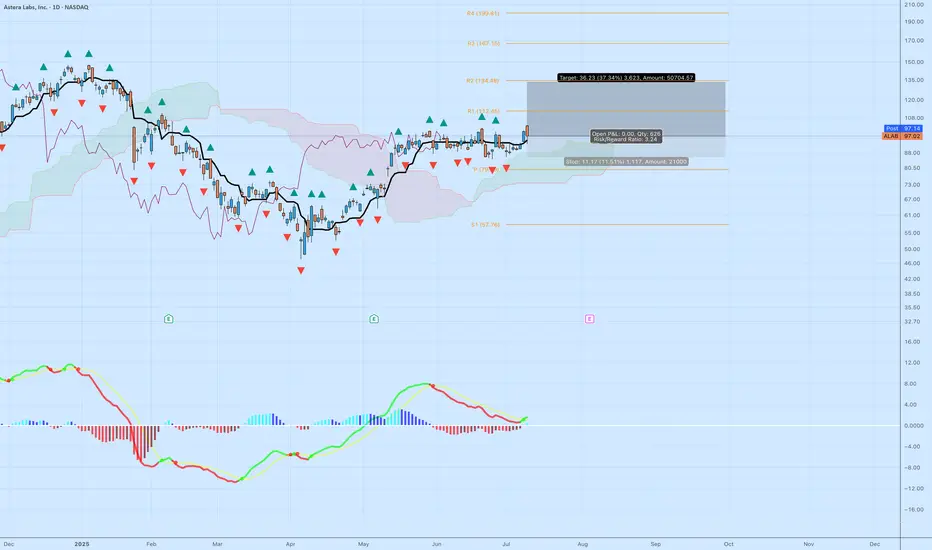
ALAB: High-Quality Breakout With Strong Structure and 3.2 R/RAstera Labs ( NASDAQ:ALAB ) just delivered a clean technical breakout above multi-week resistance, paired with bullish confirmation from momentum and Ichimoku structure. This isn’t a hype trade — this is what a textbook continuation breakout looks like.
📊 Key Technical Breakdown
Base Breakout
After weeks of tight consolidation, NASDAQ:ALAB just broke above horizontal resistance at ~$95. The breakout candle is strong, with above-average range and a decisive close.
Ichimoku Cloud
Price is well above the cloud — this confirms bullish trend.
The Kijun (black line) is sloping upward, and the cloud is thick and rising.
Pullbacks toward $88–90 could act as support if the breakout retests.
MACD Reversal
The MACD has flipped green, signaling a momentum shift.
Histogram is expanding upward again, showing renewed buying pressure.
This is happening as price reclaims the top of the recent range — a great alignment.
🎯 Trade Specs
Entry: $97.02
Target: $133.25 (+37.34%)
Stop: $85.32 (–11.51%)
Risk/Reward: 3.24 — solid skew for a growth name
Context: Strong prior trend, healthy consolidation, and now continuation. This isn’t a bottom-pick — it’s trend-following at a breakout moment.
🧠 Why This Trade Works
Structure: You’re not chasing green candles. This breakout comes after a long base and clears prior congestion.
Asymmetry: A 3.2+ R/R setup means you can be wrong more than half the time and still come out ahead — if you stick to your stops.
Momentum Alignment: Momentum and price are moving together — never fade a breakout with confirmation from both price action and indicators.
📌 Tip for Readers:
If you’re new to swing trading, study how this base formed and what conditions led to the breakout. The goal isn’t prediction — it’s positioning at the right moments with risk defined.