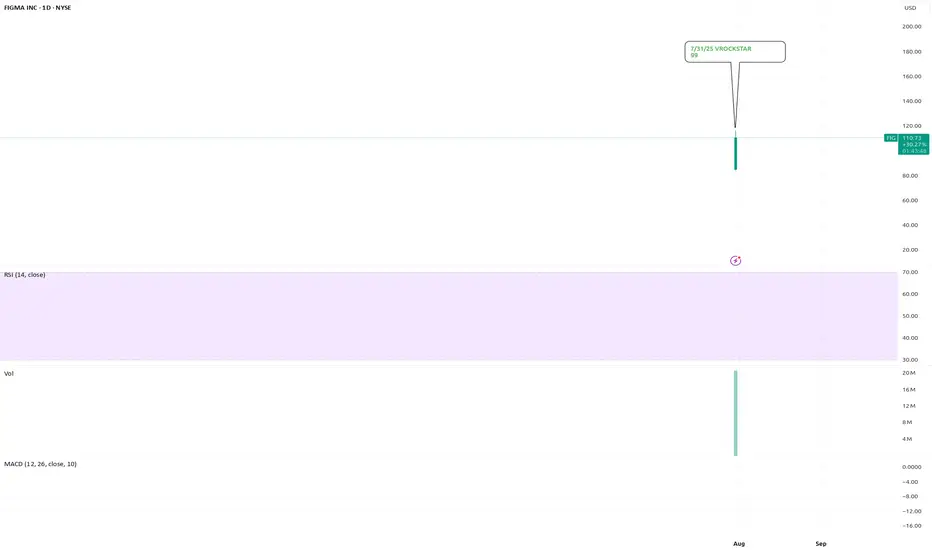
7/31/25 - $fig - gg7/31/25 :: VROCKSTAR :: NYSE:FIG
gg
- didn't even want this at $33 or wherever the money changers filled it
- saw that it opened at like... $90? tf
- now it's $100?
- i'm commenting here to share with you that we're at the point in the market where nothing makes sense if you zoom far enough in
- take a step back, there's a lot of value out there
- but paying 3x the IPO price for this?
- it's an interesting trade, but don't try to make it make sense because it won't and you'll cause some brain damage
- nobody ever went broke taking profits.
- gl to those who bought my bags at over $100. enjoy.
V
Opening - LYFT Aug 8th 15 Covered CallOpened for $13.40 debit.
Notes:
Sold the approx. 40 delta call against shares for an earnings play to take advantage of vol crush. Best case stock moves higher and we can close out at max profit. Should it move against us then we continue rolling the call out and down.
Mostly I trade option strategies that are essentially theta positive and short volatility. But I have never really played around with covered call strategies or letting positions getting assigned on the put side. With the preference to roll out & up/down vs. allowing a position to get assigned. So I am experimenting by just outright getting into a covered call position to experience what it is like to manage an assigned put position with short calls.
Trade Data:
Cost Basis: 13.40
Max ROC: 11.94%
Position Net Delta: Approx. .60 long delta

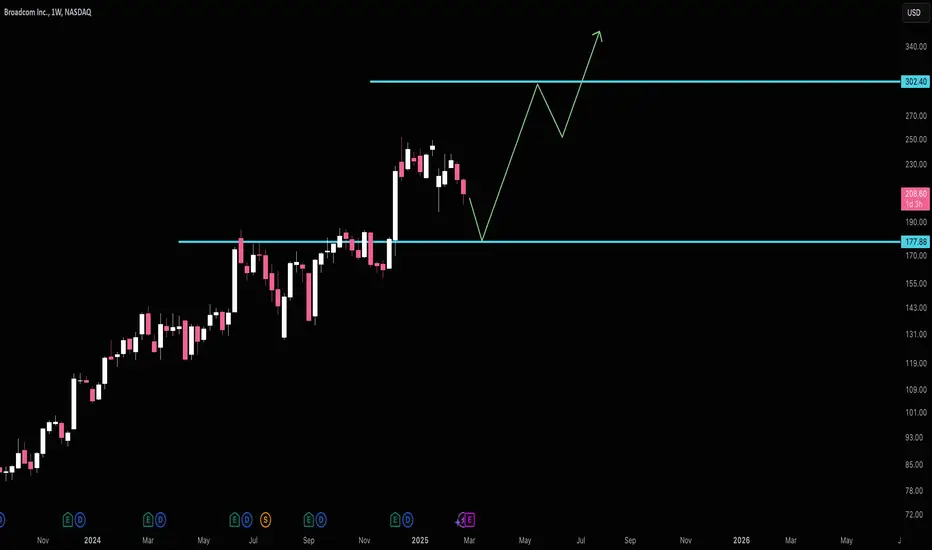
Broadcom Middle of Range RisksI like Broadcom if it gets down to $178. Right now it's still floating from the AAPL news. I wouldn't be inclined to sell here, but if looking to buy (like myself) I'd wait in hopes for $178.
Target (Potential Next Support) $302.
Good luck!
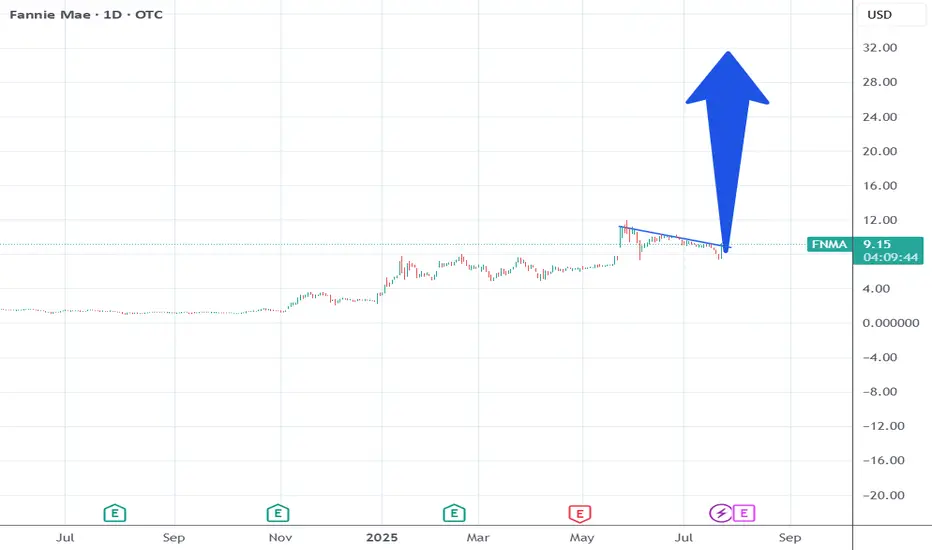
Trump will approve the FNMA privatization within 10 days.Trump works for Wall St. He plans his moves based on what Wall St wants.
He says stuff at certain times to get the markets to react in key times for Wall St.
The overall market is going to correct within the next 30 days.
FNMA just did a shakeout the last 3 weeks.
So Trump will time his announcement to correlate with the events of Wall St.
Remember he was going to do this his 1st term.
18 dollars in the next 3 weeks.
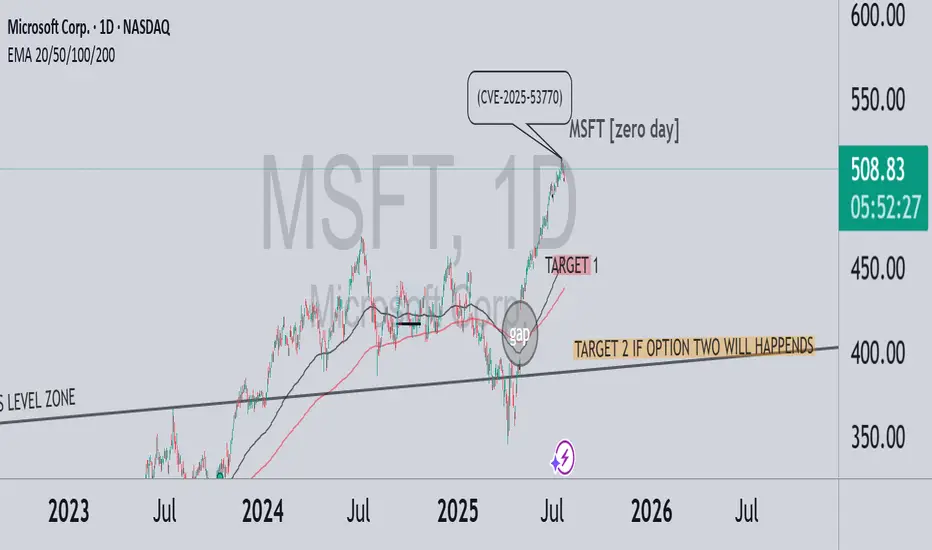
MSFT – A correction brewing? zero day CRWD-like scenario?In July 2025, a critical vulnerability in Microsoft SharePoint (CVE-2025-53770) was exploited by threat actors globally. Although the issue was first reported during the Pwn2Own Berlin competition back in May, Microsoft delayed the patch — allowing attackers a significant head start. Over 400 servers and dozens of organizations were breached, including U.S. and European government entities.
💬 On July 18, Reddit users began discussing the flaw’s severity, comparing it to past vulnerabilities like Log4j. Interestingly, this coincided with the first significant technical deviation from the bullish trend — marking a potential beginning of downside momentum.
🔍 In the chart above:
Strong bullish run until the Zero-Day disclosure
Clear gap beneath current price action
TARGET 1 reflects a natural technical retracement toward EMA 50–100 and the mid-term trendline
TARGET 2 is conditional – it only applies if a massive event occurs, similar to what we saw with CRWD
⚠️ Key distinction:
CrowdStrike: A software update bug caused a global Windows crash — no cyberattack, but massive operational impact
Microsoft: A real, actively exploited security vulnerability — with long-tail risk for data leaks, ransomware, and regulatory backlash
🎯 Conclusion:
If the SharePoint exploit escalates in visibility or consequences, and Microsoft fails to contain the damage — we could see extended downside pressure. TARGET 2 remains valid only under a high-severity scenario, like CRWD’s global meltdown.
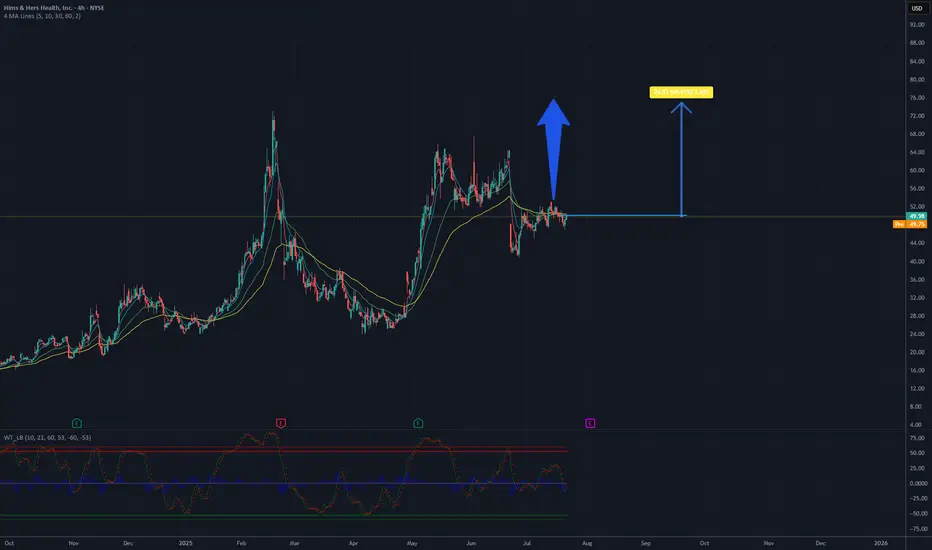
Is it a time for HIMS? Potential 50%,target 75USD.The company has announced plans to introduce comprehensive at-home lab tests, leveraging the acquisition of Trybe Labs, which could enhance service personalization and attract new customers. Additionally, expansion into markets such as Canada and Europe (through the acquisition of Zava) opens new revenue growth opportunities. The company demonstrates continuous financial improvement, including record profitability and a 111% revenue increase since reaching its ATH (All-Time High) in February 2025, which builds investor confidence.
The chart analysis of Hims & Hers Health, Inc. (NYSE: HIMS) indicates a clear upward trend in the recent period. The current price is approximately 49.38 USD. Based on historical data and visible momentum, there is potential for a growth of about 50%, which could bring the price to around 75 USD. Key support is located around 45 USD, while resistance may be tested in the 55-60 USD range before further upward movement. It is recommended to monitor volume and key technical levels to confirm the continuation of the trend.
Potential TP: 75 $
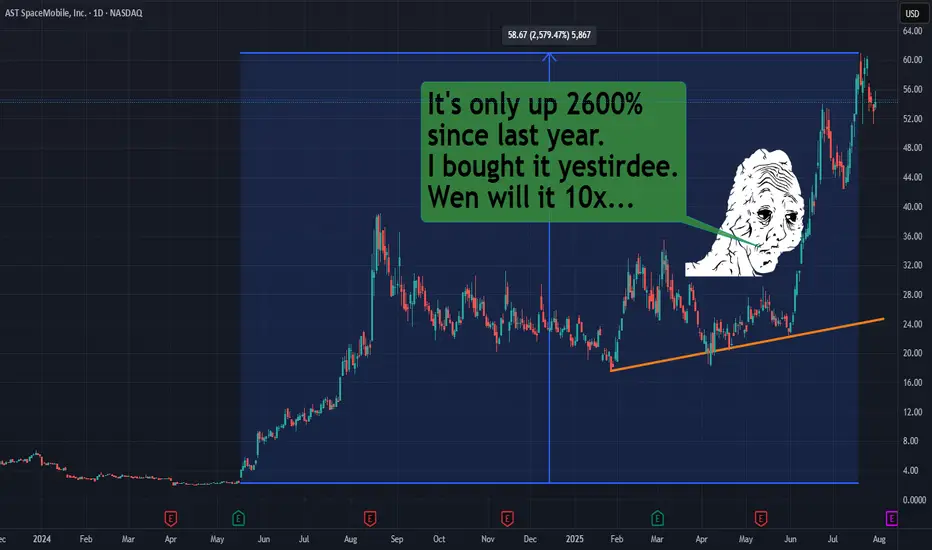
ASTS | Starlink ain't the only game in space no mo!This stock NASDAQ:ASTS is only up like 2600% in a year. That's like nothing. Might as well be losing that paypah.
Yes, it will swing more wildly than a chimpanzee from a vine. And yes my chart is probably effed as heck, but I'm looking for beyondosphere type of returns.
Is there room for more than one big f***y boom batty space phone company? Elon, scoot your bumbie over and let ASTS get in on that space rocket seat.
Play here is direct-to-cell calls between satellites and cell phones. Starlink probably has the advantage like the tide rolling over middle state a&m community college, but just like there was room for many phone companies in the last decades, there will be room for multiple space junkie phone companies.
You will not get rich because you will not HODL!
Live long and prosper. This is not financial advice. I JUST LIKE THE STOCK.
THANK YOU FOR YOUR ATTENTION ON THIS MATTER
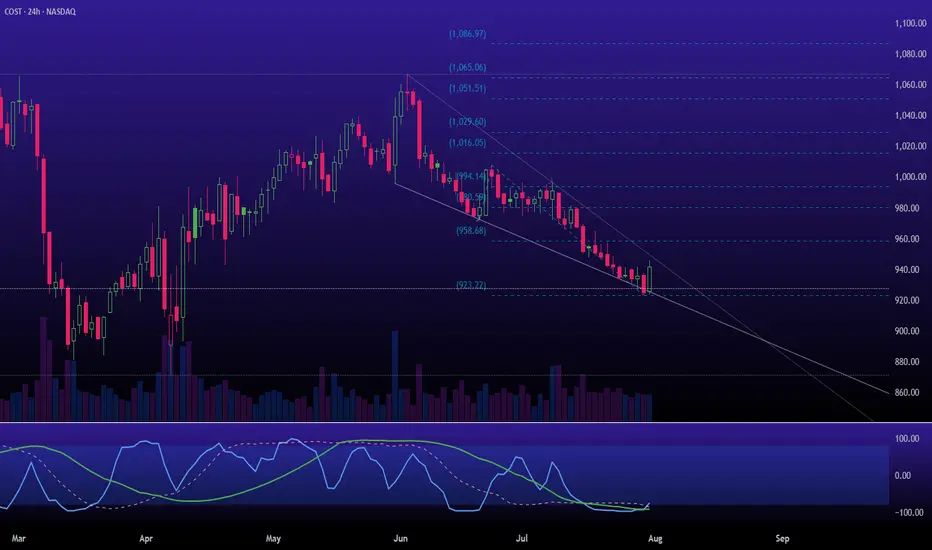
$COST is transiting from the Markup to the Accumulation (A)The squeezing and oversold momentum readings suggest the markdown is losing steam and "stopping action" may be occurring. We could be witnessing the area where a Selling Climax or preliminary support forms. I'm not looking for a new all-time high, but a trip to test resistance seems likely.
Duol to ath?Duol made a retracement to the golden pocket, the last point of support according to the algorithmic expansion theory. This price range may represent a potential opportunity. Where do I see the price heading? All-time high, aligned with the second channel of the algorithmic expansion from the bullish breaker. The MACD is also showing momentum.
Not financial advice

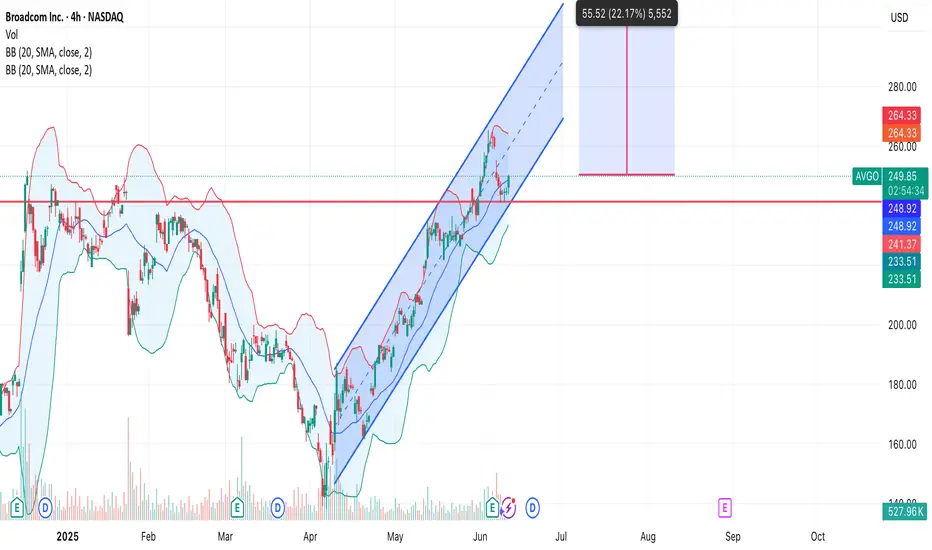
AVGO ( Broadcom.Inc ) NASDAQ:AVGO - Continuation of movement within the ascending channel + potential for a breakout to new historical highs. 🔍 Rationale:
• After a strong correction in the first quarter of 2025, the price formed a reversal and has been moving in a clear ascending channel since the beginning of May.
• The channel support and resistance are clearly being worked out, the price is steadily bouncing off the lower border.
• Bollinger Bands show a narrowing - momentum is possible.
• Trading volume is stable, there are no signs of a strong sell-off.
NVO-Zoomed outZooming out
-100 Monthly SMA trendline
- Weekly bullish divergence in the RSI
Already positioned all in.
Expecting trend reversal to come in a few weeks

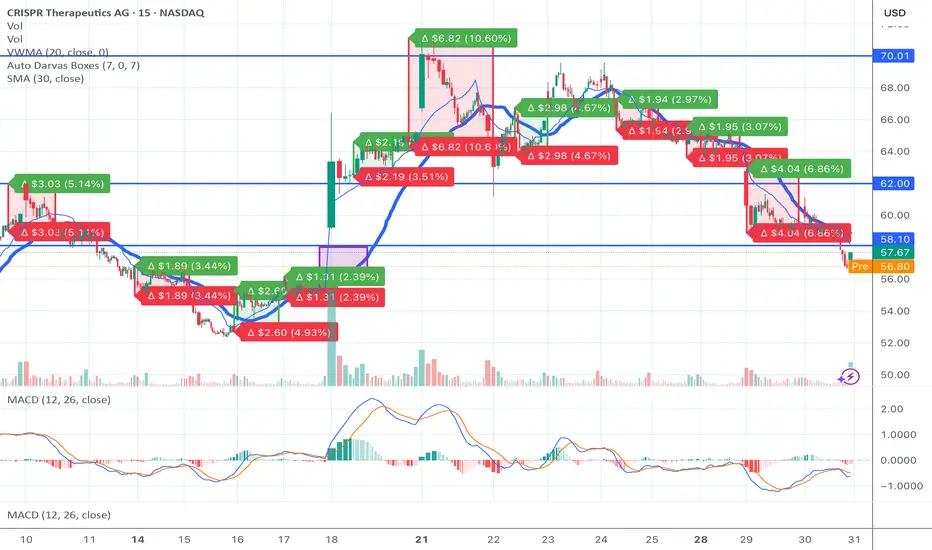
What’s Really Going on with CRSP — And What You Need to KnowIt’s Thursday morning. The stock has been dropping.
You’re asking yourself: What the hell is going on?
You’re seeing red in your portfolio, the option chain bleeding. Retail’s getting nervous. But here’s the thing you need to understand — and I want you to sit with this:
The drop is the setup. Not the end.
This is exactly how squeezes begin
CRSP is down today — not because of bad news, but because the market makers are doing their job.
Implied volatility is elevated ahead of earnings on Monday.
Shorts are trying to apply pressure to shake loose retail hands.
Option dealers are reducing exposure by selling stock — delta neutral hedging.
It’s Thursday before earnings.
This is when they suppress the price on purpose to cheapen contracts, reset expectations, and trap anyone not looking deep enough.
And that’s where the opportunity lies.
The mechanics you’re not being told
Let’s break this down in raw numbers.
CRSP short interest is 29.15 million shares.
That’s about 38 percent of the float — nearly one in every two tradable shares is bet against this company.
Cost to borrow is over 25 percent at peak, averaging 17.2 percent.
Days to cover is 5.3 — meaning if every short had to cover at once, it would take over a full trading week of volume.
Dark pool activity is now over 56 percent of daily volume.
This isn’t retail playing games.
This is big money loading the spring in silence.
And the trap door is earnings.
Why CRISPR Therapeutics is so misunderstood
This isn’t a meme stock. It’s not a pipe dream.
Co-founded by a Nobel Prize winner.
First ever FDA-approved CRISPR gene therapy, exa-cel.
Strategic partnerships with Vertex, Bayer, ViaCyte.
Over 2.1 billion dollars in cash on hand.
Pipelines in sickle cell, beta-thalassemia, solid tumors, diabetes, and early Alzheimer’s.
This is the Tesla of gene editing, but the market still treats it like it’s in the garage.
Why?
Because legacy investors don’t understand how fast biotech is changing.
Because analysts can’t model curing disease.
Because the old guard is still trying to value a revolution using 1990s Excel sheets.
Why the price is falling right now
Let’s be honest.
Shorts want you to sell.
Dealers need to de-risk into earnings.
IV crush is a real threat post-call.
But here’s what they don’t expect.
That retail is watching. Calculating. Waiting.
This dip isn’t about failure — it’s about strategy.
They want cheaper entries. They want to make the breakout more violent. They want to buy your shares at a discount before what could be one of the most important earnings calls in the company's history — this Monday, August 5th.
The setup is unlike anything else on the market
If the stock closes Friday anywhere near 64 to 66 dollars, and Monday earnings beat or hint at expanded trials, we get:
Gamma exposure flipping from neutral to positive
Dealers forced to hedge upward
Shorts squeezed from multiple levels
Price targeting 75 to 90 to 110 in a matter of weeks
And every dollar higher costs shorts tens of millions in floating losses.
They’re already down over 500 million since mid-June.
A move above 75 brings many of those positions to 50 percent losses — the exact pain point where margin calls trigger.
And when that starts? There’s no graceful exit.
Final thoughts
The world is sleeping on CRSP.
But you’re not.
You’re watching. You see the setup. You understand the math. You feel the potential.
This is not financial advice.
This is a call to wake up — to learn, to dig, to question what they want you to believe.
Because just like with Tesla at 30 dollars… Apple in the garage… Amazon when it only sold books…
The next generation of wealth won’t come from playing it safe. It comes from understanding the moment before it arrives.
And this is one of those moments.
Seed
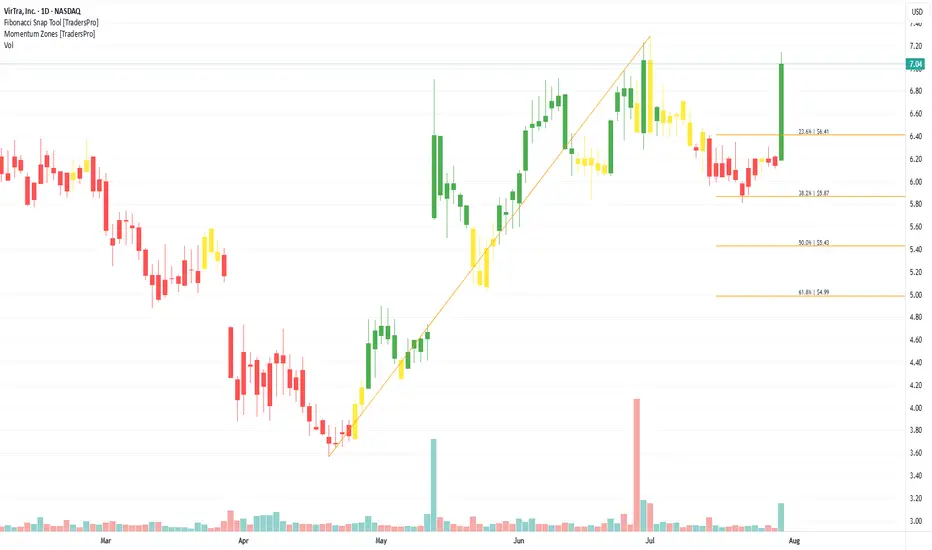
VirTra, Inc. (VTSI) Expands Simulation Training ReachVirTra, Inc. (VTSI) is a leading provider of advanced simulation training systems for law enforcement, military, and security agencies. Known for its immersive VR-based technology, VirTra delivers realistic training scenarios to improve decision-making and situational awareness in high-pressure environments. The company’s growth is driven by rising demand for safe, effective training solutions and increased investment in public safety and defense readiness worldwide.
On the chart, a confirmation bar with growing volume signals bullish momentum. The price has moved into the momentum zone after breaking above the .236 Fibonacci level. A trailing stop can be set just below this Fibonacci level using the Fibonacci snap tool, helping protect gains while leaving room for further upside potential.
NVIDIANVIDIA Corporation is a leading American technology company known for designing and manufacturing graphics processing units (GPUs), system-on-a-chip units (SoCs), and AI computing platforms. Founded in 1993, the company originally focused on gaming graphics but has since evolved into a global powerhouse in artificial intelligence, data centers, autonomous vehicles, and high-performance computing. NVIDIA’s GPUs are widely used not only in gaming and visual computing but also in scientific research, AI model training, machine learning, and cloud infrastructure.
In recent years, NVIDIA has been at the forefront of the global AI boom. Its data center business, powered by its high-end GPU architecture (like the H100 and newer generations), has become a critical backbone for tech companies, cloud providers, and governments seeking to build large-scale AI systems. The company also made major strategic moves through acquisitions and software integration, further solidifying its dominance in the AI hardware space. NVIDIA’s strong financial performance and technological leadership led to rapid growth in its market capitalization, briefly making it one of the most valuable companies in the world.
As of August 2025, NVIDIA’s stock is trading at $173.60 per share, following a stock split that adjusted its price while increasing liquidity. Despite broader market volatility, NVIDIA remains a key player driving the AI revolution and is closely watched by investors and analysts. Its valuation continues to be shaped by demand for AI chips, innovation in GPU architecture, and its ability to maintain technological leadership amid growing global competition. NVIDIA stands at the intersection of multiple megatrends, making it a critical stock in both the technology and semiconductor sectors.

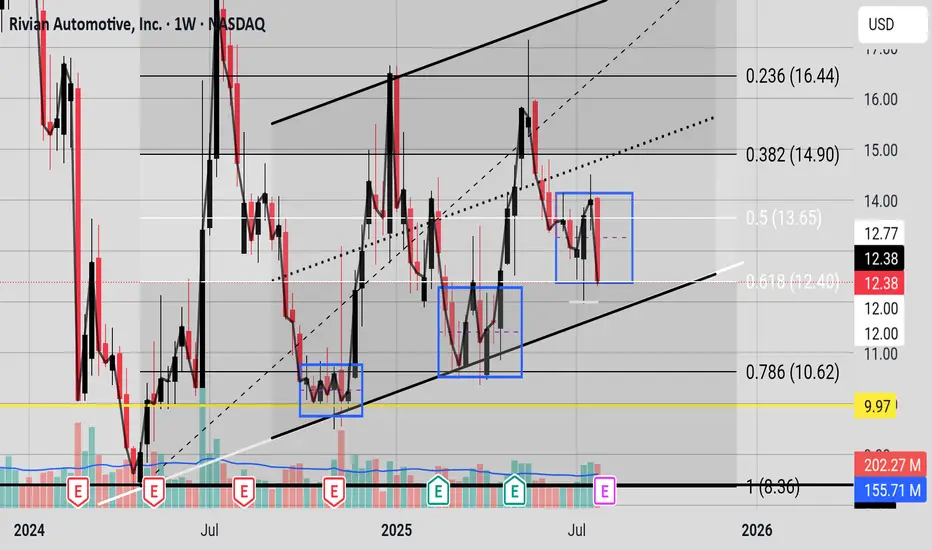
Blue Boxes of ConsolidationIt seems the last two major moves on the chart (in the blue boxes) there was heavy consolidation for seven to 10 candlesticks, in this chart seven to ten weeks before a breakout. The bears now have a strong bearish candle but it is still in a consolidation pattern. The Bulls still have a trendline that held from April 2024 where price has not closed below it (please see SMA curve in black on the chart). If you turn on the 50 EMA price is still oscillating around it. And price is still in the Fibonacci golden zone. The bears need a bearish close with follow through below 12.40 and the bulls need a bullish close above 13.65 to hopefully kick off their party. The Bulls have a historical trendline and the Bears have a bearish MACD(Chris Moody) and a Braid filter that just flashed red and a recent strong bearish candle.
close to receiving grantsWith 19 utility patents close to receiving grants, there is a possibility that Fibrobiologics' shares will suddenly jump at any moment with the news.

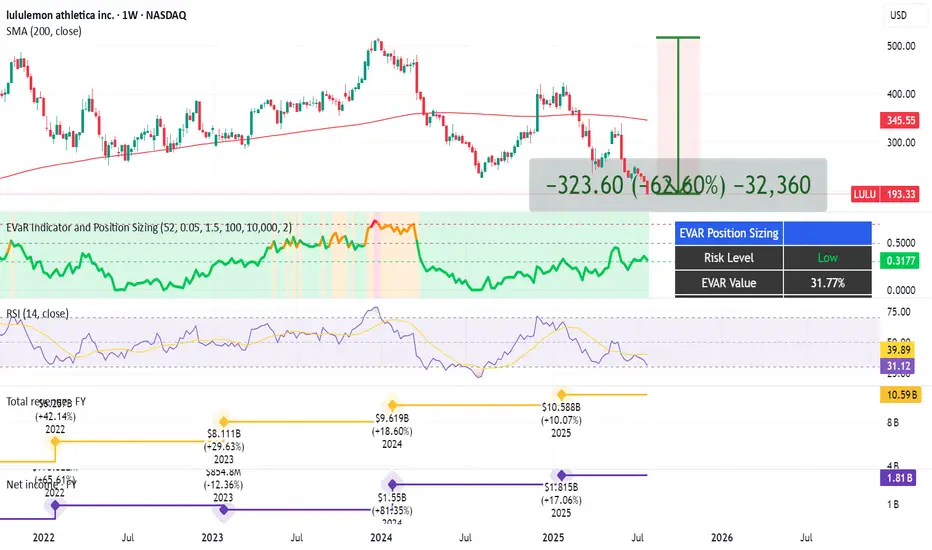
Yoga Pants, Tariffs, and Upside: The $LULU BetLululemon NASDAQ:LULU - My Investment Thesis 👖
Hey team,
I've been keeping an eye on NASDAQ:LULU for a while, and I'm finally going to pull the trigger.
In this market of overhyped MAG 7 stocks, Lululemon dropped 62% since its high in Dec. 2023 until now.
Here's why I'm into LULU:
Revenue has been growing every year for 5 years. Still, the stock is at its lowest in 5 years.
Growth has been slower in the US but good in Asia.
Net income has also been growing over the last 3 years.
P/E ratio is at 13, the lowest in many years.
Stock is also beat up because of the tariffs.
Analysts at Morningstar put its fair value at $305 (now $193, giving it an upside of 58%).
Product Innovation: New franchises like Daydrift, Shake It Out, and Align No Line have been well-received and will continue to drive sales.
Lululemon recently announced an expansion into India for 2026, with plans to open a physical store and a partnership with Tata CLiQ, the e-commerce arm of India’s largest business conglomerate, Tata Group. India can be a huge market for Lulu.
There's also intense competition and margin erosion.
Saying this, I kinda see people around me less excited about Lululemon products.
Technical Analysis:
My EVaR - Entropic Value at Risk - is in a low risk area.
RSI is oversold.
Price has been under the 200 MA for too long.
I'm going to proceed with caution on this one, and allocate approximately. 0.5% of my portfolio into it.
Quick note: I'm just sharing my journey - not financial advice! 😊
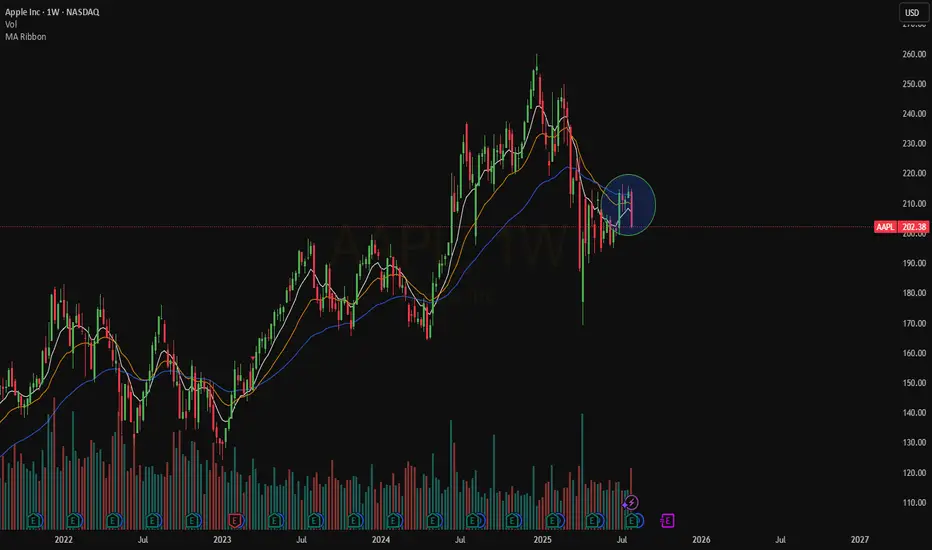
Weekly $AAPLNASDAQ:AAPL on the Weekly is still bearish. The price is trading below our EMAs that are even in a bearish order.
We need a stable move above $217 right now.
Not sure will come soon
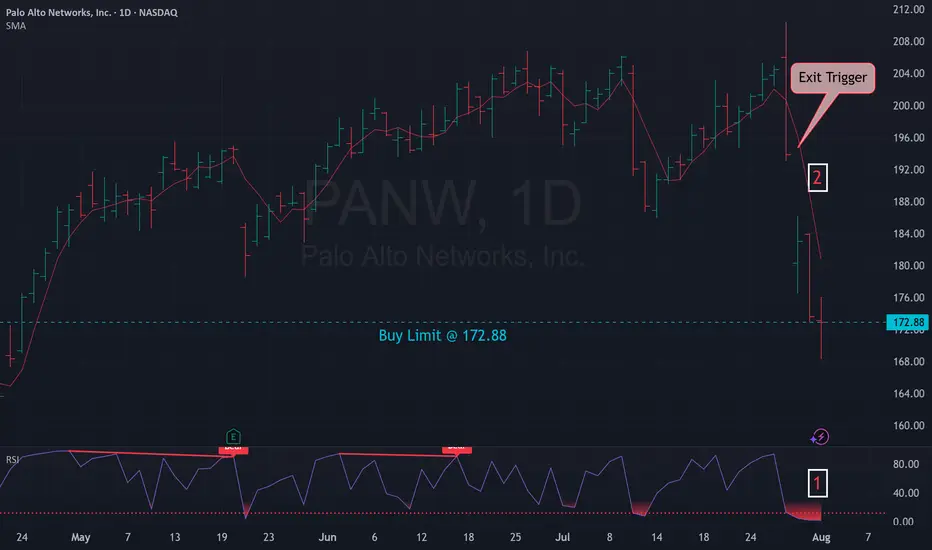
Mean Reversion Trade: PANW1. RSI in oversold region
2. Price likely to rebound back the the mean
Trade Rules:
Entry Trigger - RSI has cross below oversold region, enter limit buy at close price
Exit Trigger - Close at market when close price cross above exit trigger (Red line)
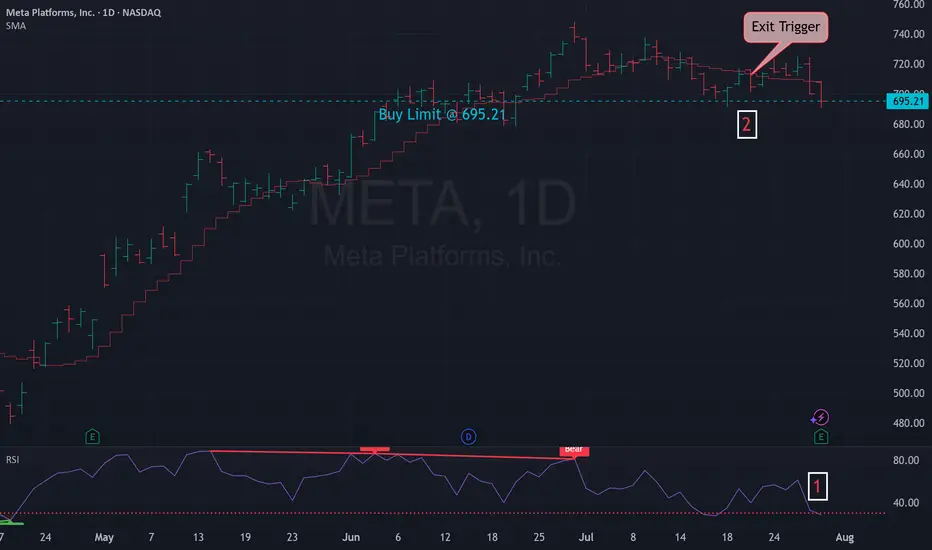
Mean Reversion Trade: META1. RSI in oversold region
2. Price likely to rebound back the the mean
Trade Rules:
Entry Trigger - RSI has cross below oversold region, enter limit buy at close price
Exit Trigger - Close at market when close price cross above exit trigger (Red step line)
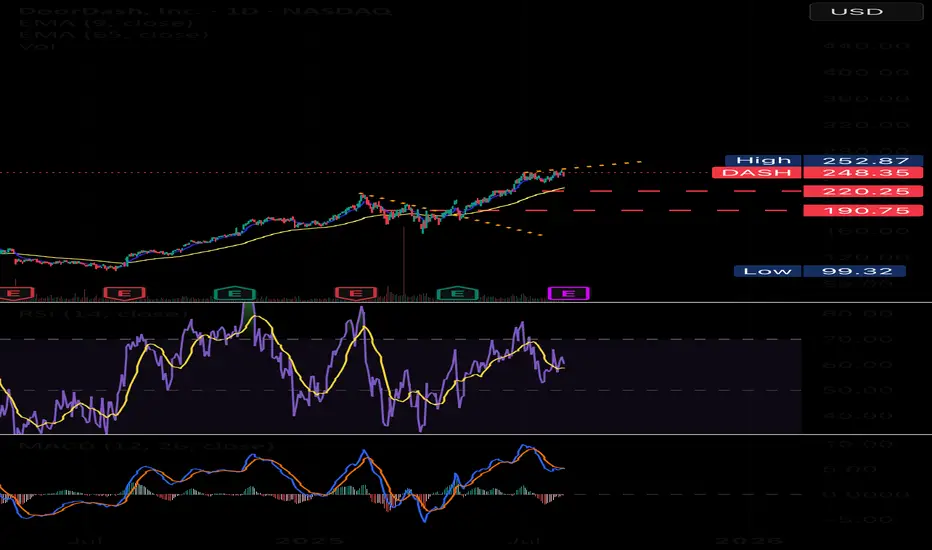
$DASH NASDAQ:DASH buyers look hesitant to buy right now after the weak job report and the Fed signaling no rate cuts anytime soon. This adds pressure on consumer pockets, limiting discretionary spending. If this trend continues, we might see DoorDash consumers slow down their activity, which could impact the company’s revenue growth.
With macro headwinds and reduced consumer demand, NASDAQ:DASH price action could remain under pressure in the short term. A break below key support levels may trigger further downside unless the market sentiment shifts with improved economic data.
GOOGLE BUY SET UPGOOGLE is on an overall WEEKLY uptrend, coming off of a WEEKLY retest. Within that retest, we have a 4HR BOS. Waiting for 4HR retest in on of my zones for continuation to previous high. A WEEKLY candle would have to BREAK and CLOSE below the previous WEEKLY HL for possible reversal. Happy trading
~~~~I want everyone to succeed

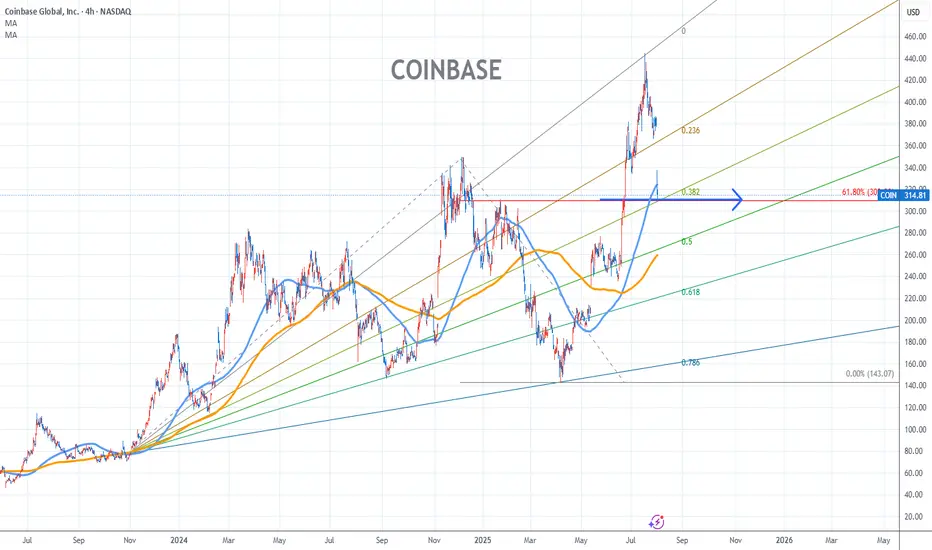
Coinbase Stock Chart Fibonacci Analysis 080125Trading Idea
1) Find a FIBO slingshot
2) Check FIBO 61.80% level
3) Entry Point > 310/61.80%
Chart time frame:C
A) 15 min(1W-3M)
B) 1 hr(3M-6M)
C) 4 hr(6M-1year)
D) 1 day(1-3years)
Stock progress:C
A) Keep rising over 61.80% resistance
B) 61.80% resistance
C) 61.80% support
D) Hit the bottom
E) Hit the top
Stocks rise as they rise from support and fall from resistance. Our goal is to find a low support point and enter. It can be referred to as buying at the pullback point. The pullback point can be found with a Fibonacci extension of 61.80%. This is a step to find entry level. 1) Find a triangle (Fibonacci Speed Fan Line) that connects the high (resistance) and low (support) points of the stock in progress, where it is continuously expressed as a Slingshot, 2) and create a Fibonacci extension level for the first rising wave from the start point of slingshot pattern.
When the current price goes over 61.80% level , that can be a good entry point, especially if the SMA 100 and 200 curves are gathered together at 61.80%, it is a very good entry point.
As a great help, tradingview provides these Fibonacci speed fan lines and extension levels with ease. So if you use the Fibonacci fan line, the extension level, and the SMA 100/200 curve well, you can find an entry point for the stock market. At least you have to enter at this low point to avoid trading failure, and if you are skilled at entering this low point, with fibonacci6180 technique, your reading skill to chart will be greatly improved.
If you want to do day trading, please set the time frame to 5 minutes or 15 minutes, and you will see many of the low point of rising stocks.
If want to prefer long term range trading, you can set the time frame to 1 hr or 1 day.