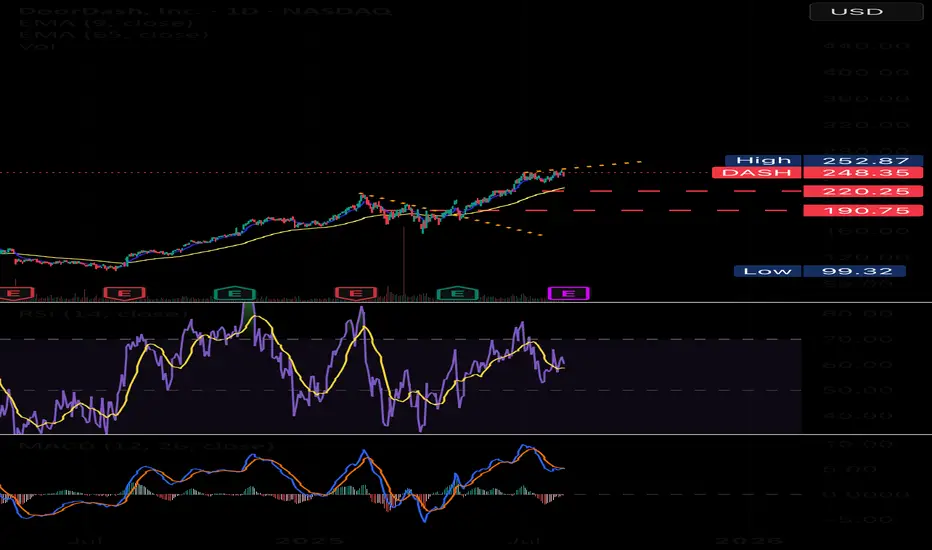
$DASH NASDAQ:DASH buyers look hesitant to buy right now after the weak job report and the Fed signaling no rate cuts anytime soon. This adds pressure on consumer pockets, limiting discretionary spending. If this trend continues, we might see DoorDash consumers slow down their activity, which could impact the company’s revenue growth.
With macro headwinds and reduced consumer demand, NASDAQ:DASH price action could remain under pressure in the short term. A break below key support levels may trigger further downside unless the market sentiment shifts with improved economic data.
GOOGLE BUY SET UPGOOGLE is on an overall WEEKLY uptrend, coming off of a WEEKLY retest. Within that retest, we have a 4HR BOS. Waiting for 4HR retest in on of my zones for continuation to previous high. A WEEKLY candle would have to BREAK and CLOSE below the previous WEEKLY HL for possible reversal. Happy trading
~~~~I want everyone to succeed

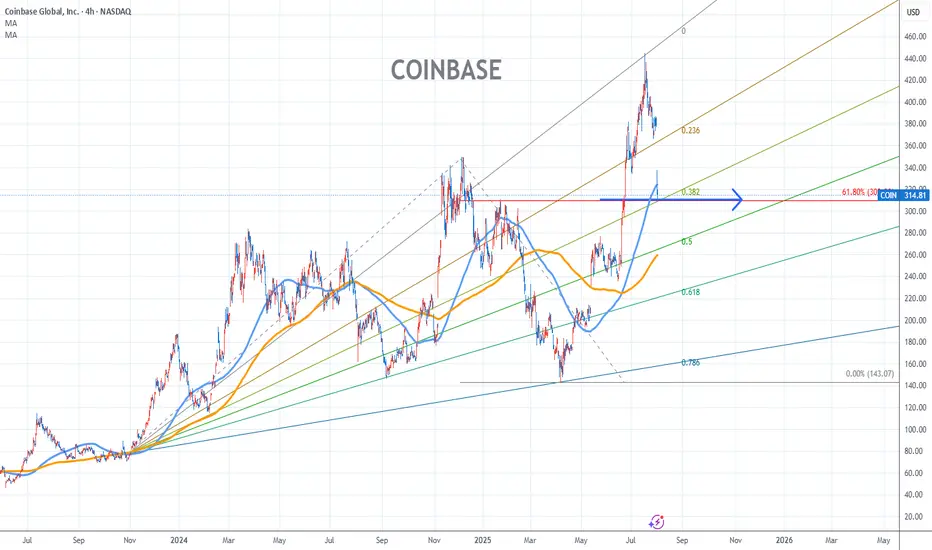
Coinbase Stock Chart Fibonacci Analysis 080125Trading Idea
1) Find a FIBO slingshot
2) Check FIBO 61.80% level
3) Entry Point > 310/61.80%
Chart time frame:C
A) 15 min(1W-3M)
B) 1 hr(3M-6M)
C) 4 hr(6M-1year)
D) 1 day(1-3years)
Stock progress:C
A) Keep rising over 61.80% resistance
B) 61.80% resistance
C) 61.80% support
D) Hit the bottom
E) Hit the top
Stocks rise as they rise from support and fall from resistance. Our goal is to find a low support point and enter. It can be referred to as buying at the pullback point. The pullback point can be found with a Fibonacci extension of 61.80%. This is a step to find entry level. 1) Find a triangle (Fibonacci Speed Fan Line) that connects the high (resistance) and low (support) points of the stock in progress, where it is continuously expressed as a Slingshot, 2) and create a Fibonacci extension level for the first rising wave from the start point of slingshot pattern.
When the current price goes over 61.80% level , that can be a good entry point, especially if the SMA 100 and 200 curves are gathered together at 61.80%, it is a very good entry point.
As a great help, tradingview provides these Fibonacci speed fan lines and extension levels with ease. So if you use the Fibonacci fan line, the extension level, and the SMA 100/200 curve well, you can find an entry point for the stock market. At least you have to enter at this low point to avoid trading failure, and if you are skilled at entering this low point, with fibonacci6180 technique, your reading skill to chart will be greatly improved.
If you want to do day trading, please set the time frame to 5 minutes or 15 minutes, and you will see many of the low point of rising stocks.
If want to prefer long term range trading, you can set the time frame to 1 hr or 1 day.
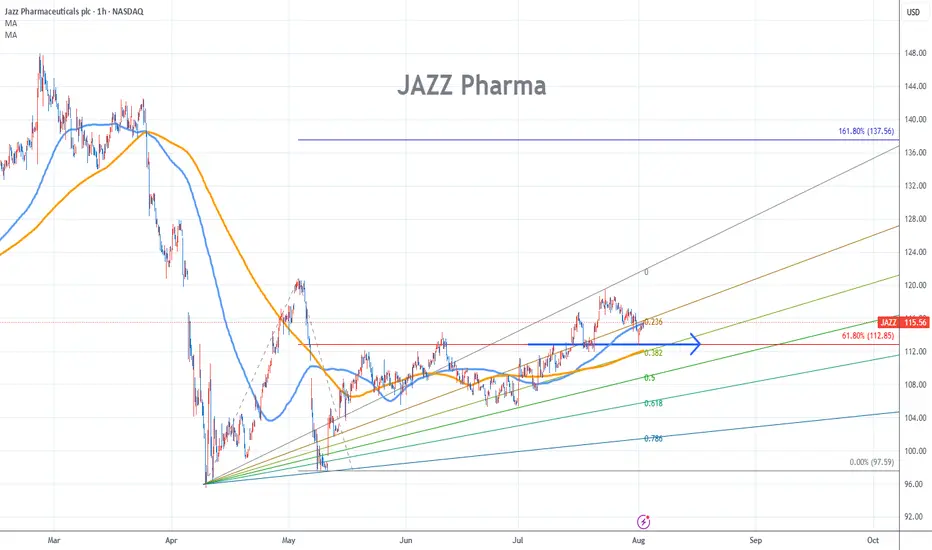
Jazz Pharma Stock Chart Fibonacci Analysis 080125Trading Idea
1) Find a FIBO slingshot
2) Check FIBO 61.80% level
3) Entry Point > 112/61.80%
Chart time frame:B
A) 15 min(1W-3M)
B) 1 hr(3M-6M)
C) 4 hr(6M-1year)
D) 1 day(1-3years)
Stock progress:C
A) Keep rising over 61.80% resistance
B) 61.80% resistance
C) 61.80% support
D) Hit the bottom
E) Hit the top
Stocks rise as they rise from support and fall from resistance. Our goal is to find a low support point and enter. It can be referred to as buying at the pullback point. The pullback point can be found with a Fibonacci extension of 61.80%. This is a step to find entry level. 1) Find a triangle (Fibonacci Speed Fan Line) that connects the high (resistance) and low (support) points of the stock in progress, where it is continuously expressed as a Slingshot, 2) and create a Fibonacci extension level for the first rising wave from the start point of slingshot pattern.
When the current price goes over 61.80% level , that can be a good entry point, especially if the SMA 100 and 200 curves are gathered together at 61.80%, it is a very good entry point.
As a great help, tradingview provides these Fibonacci speed fan lines and extension levels with ease. So if you use the Fibonacci fan line, the extension level, and the SMA 100/200 curve well, you can find an entry point for the stock market. At least you have to enter at this low point to avoid trading failure, and if you are skilled at entering this low point, with fibonacci6180 technique, your reading skill to chart will be greatly improved.
If you want to do day trading, please set the time frame to 5 minutes or 15 minutes, and you will see many of the low point of rising stocks.
If want to prefer long term range trading, you can set the time frame to 1 hr or 1 day.
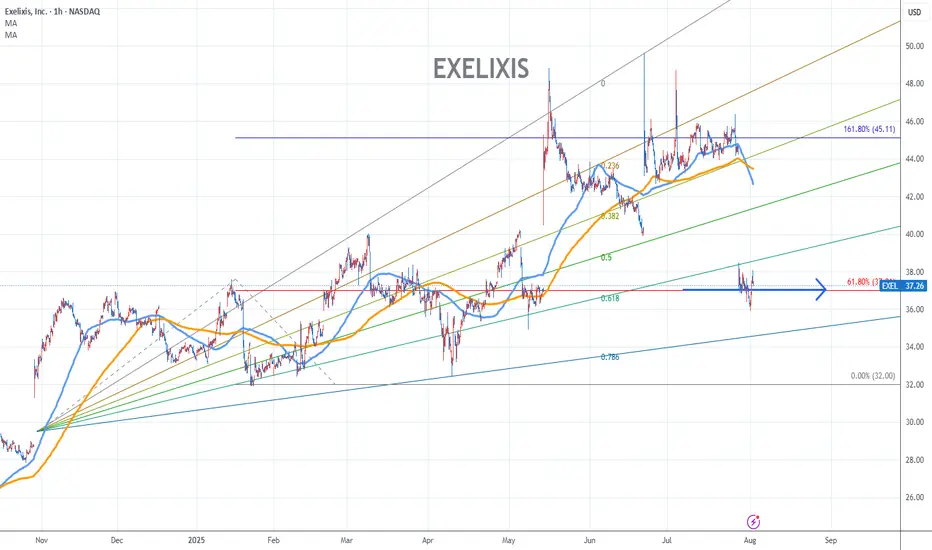
Exelixis Stock Chart Fibonacci Analysis 080125Exelixis Stock Chart Fibonacci Analysis 080125
Trading idea - Entry point > 37/61.80%
Trading Idea
1) Find a FIBO slingshot
2) Check FIBO 61.80% level
3) Entry Point > 37/61.80%
Chart time frame:B
A) 15 min(1W-3M)
B) 1 hr(3M-6M)
C) 4 hr(6M-1year)
D) 1 day(1-3years)
Stock progress:A
A) Keep rising over 61.80% resistance
B) 61.80% resistance
C) 61.80% support
D) Hit the bottom
E) Hit the top
Stocks rise as they rise from support and fall from resistance. Our goal is to find a low support point and enter. It can be referred to as buying at the pullback point. The pullback point can be found with a Fibonacci extension of 61.80%. This is a step to find entry level. 1) Find a triangle (Fibonacci Speed Fan Line) that connects the high (resistance) and low (support) points of the stock in progress, where it is continuously expressed as a Slingshot, 2) and create a Fibonacci extension level for the first rising wave from the start point of slingshot pattern.
When the current price goes over 61.80% level , that can be a good entry point, especially if the SMA 100 and 200 curves are gathered together at 61.80%, it is a very good entry point.
As a great help, tradingview provides these Fibonacci speed fan lines and extension levels with ease. So if you use the Fibonacci fan line, the extension level, and the SMA 100/200 curve well, you can find an entry point for the stock market. At least you have to enter at this low point to avoid trading failure, and if you are skilled at entering this low point, with fibonacci6180 technique, your reading skill to chart will be greatly improved.
If you want to do day trading, please set the time frame to 5 minutes or 15 minutes, and you will see many of the low point of rising stocks.
If want to prefer long term range trading, you can set the time frame to 1 hr or 1 day.
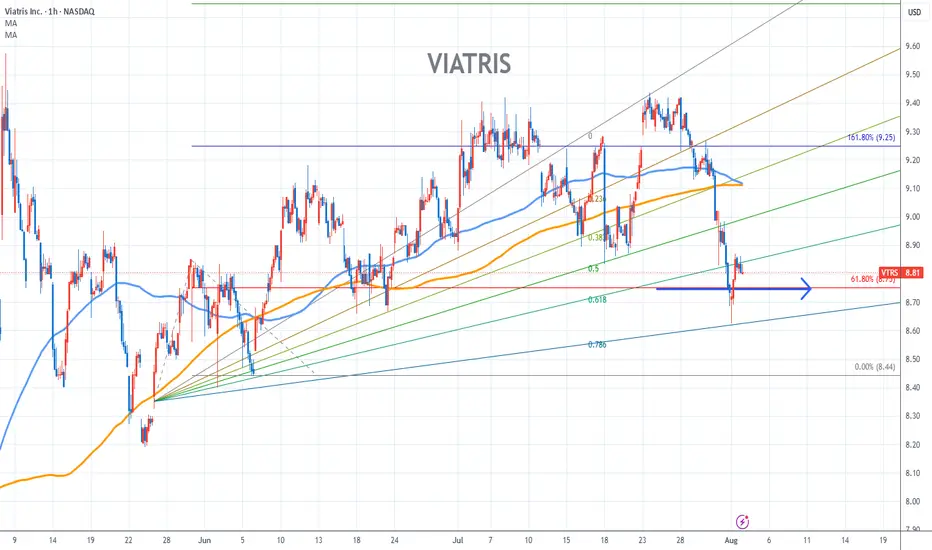
Viatris Stock Chart Fibonacci Analysis 080125Trading Idea
1) Find a FIBO slingshot
2) Check FIBO 61.80% level
3) Entry Point > 8.8/61.80%
Chart time frame:B
A) 15 min(1W-3M)
B) 1 hr(3M-6M)
C) 4 hr(6M-1year)
D) 1 day(1-3years)
Stock progress:A
A) Keep rising over 61.80% resistance
B) 61.80% resistance
C) 61.80% support
D) Hit the bottom
E) Hit the top
Stocks rise as they rise from support and fall from resistance. Our goal is to find a low support point and enter. It can be referred to as buying at the pullback point. The pullback point can be found with a Fibonacci extension of 61.80%. This is a step to find entry level. 1) Find a triangle (Fibonacci Speed Fan Line) that connects the high (resistance) and low (support) points of the stock in progress, where it is continuously expressed as a Slingshot, 2) and create a Fibonacci extension level for the first rising wave from the start point of slingshot pattern.
When the current price goes over 61.80% level , that can be a good entry point, especially if the SMA 100 and 200 curves are gathered together at 61.80%, it is a very good entry point.
As a great help, tradingview provides these Fibonacci speed fan lines and extension levels with ease. So if you use the Fibonacci fan line, the extension level, and the SMA 100/200 curve well, you can find an entry point for the stock market. At least you have to enter at this low point to avoid trading failure, and if you are skilled at entering this low point, with fibonacci6180 technique, your reading skill to chart will be greatly improved.
If you want to do day trading, please set the time frame to 5 minutes or 15 minutes, and you will see many of the low point of rising stocks.
If want to prefer long term range trading, you can set the time frame to 1 hr or 1 day.
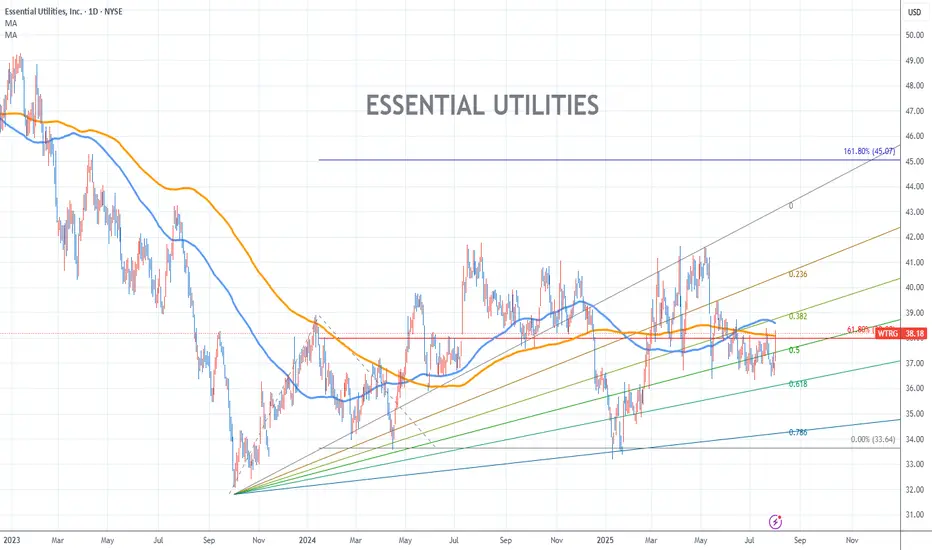
Essential Utilities Stock Chart Fibonacci Analysis 080125Trading Idea
1) Find a FIBO slingshot
2) Check FIBO 61.80% level
3) Entry Point > 38/61.80%
Chart time frame:D
A) 15 min(1W-3M)
B) 1 hr(3M-6M)
C) 4 hr(6M-1year)
D) 1 day(1-3years)
Stock progress:A
A) Keep rising over 61.80% resistance
B) 61.80% resistance
C) 61.80% support
D) Hit the bottom
E) Hit the top
Stocks rise as they rise from support and fall from resistance. Our goal is to find a low support point and enter. It can be referred to as buying at the pullback point. The pullback point can be found with a Fibonacci extension of 61.80%. This is a step to find entry level. 1) Find a triangle (Fibonacci Speed Fan Line) that connects the high (resistance) and low (support) points of the stock in progress, where it is continuously expressed as a Slingshot, 2) and create a Fibonacci extension level for the first rising wave from the start point of slingshot pattern.
When the current price goes over 61.80% level , that can be a good entry point, especially if the SMA 100 and 200 curves are gathered together at 61.80%, it is a very good entry point.
As a great help, tradingview provides these Fibonacci speed fan lines and extension levels with ease. So if you use the Fibonacci fan line, the extension level, and the SMA 100/200 curve well, you can find an entry point for the stock market. At least you have to enter at this low point to avoid trading failure, and if you are skilled at entering this low point, with fibonacci6180 technique, your reading skill to chart will be greatly improved.
If you want to do day trading, please set the time frame to 5 minutes or 15 minutes, and you will see many of the low point of rising stocks.
If want to prefer long term range trading, you can set the time frame to 1 hr or 1 day.
$UNH BEARISH SETUP – WEEK OF AUG 1
🔻 **\ NYSE:UNH BEARISH SETUP – WEEK OF AUG 1** 🔻
**UnitedHealth Group (UNH)** is showing classic breakdown signs. Here’s what the data says:
📉 **RSI Breakdown**
• Daily RSI: **20.6**
• Weekly RSI: **19.3**
→ Deeply oversold + no bounce = 🚨 momentum flush risk
📊 **Volume Surge**
• Weekly Volume: **145M** (1.9x avg)
→ Heavy **institutional selling**, NOT dip buying
🧠 **Options Insight**
• Call/Put Ratio: **1.17** = Slight bullish noise
• But... Expiry Gamma is 🚨HIGH = IV Crush incoming
• VIX: **20.7** = Volatility tailwinds intact
💣 **TRADE IDEA (PUT PLAY)**
• Direction: **BUY PUTS**
• Strike: **\$230**
• Expiry: **08/08/2025**
• Entry: **Monday Open**
• Target Premium: **\$0.10**
• 🎯 PT: \$0.30 | 🛑 SL: \$0.03
• Confidence: **70%**
📌 **Narrative**:
Oversold + High Volume Dump + No support bounce = Perfect storm for continuation dump. This is a high gamma play, time-sensitive, low-cost lotto setup. Risk small. Aim big.
---
💥 **Watchlist Tag**: ` NYSE:UNH AMEX:SPY AMEX:XLV `
🧠 **Strategy Tag**: #OversoldFlush #PutPlay #0DTETrap
🚀 Follow for more weekly earnings & options breakdowns!

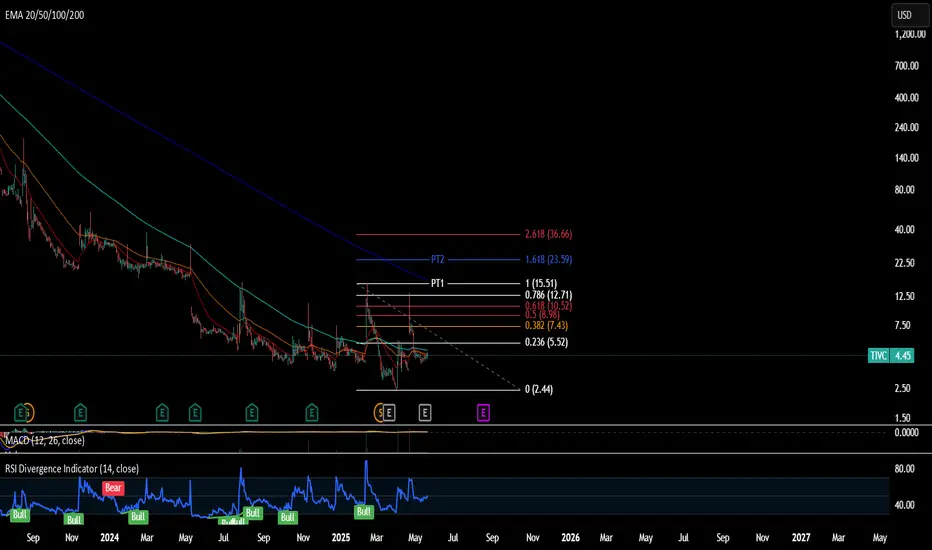
TIVC - Long Short-squeeze play
As this is my lotto play, I will let half of my shares run to the max. Considering taking your profit when it hits 0.5 or .618 fib
PT1: ~15.51
PT2: ~23.59
Stop loss : $3.8
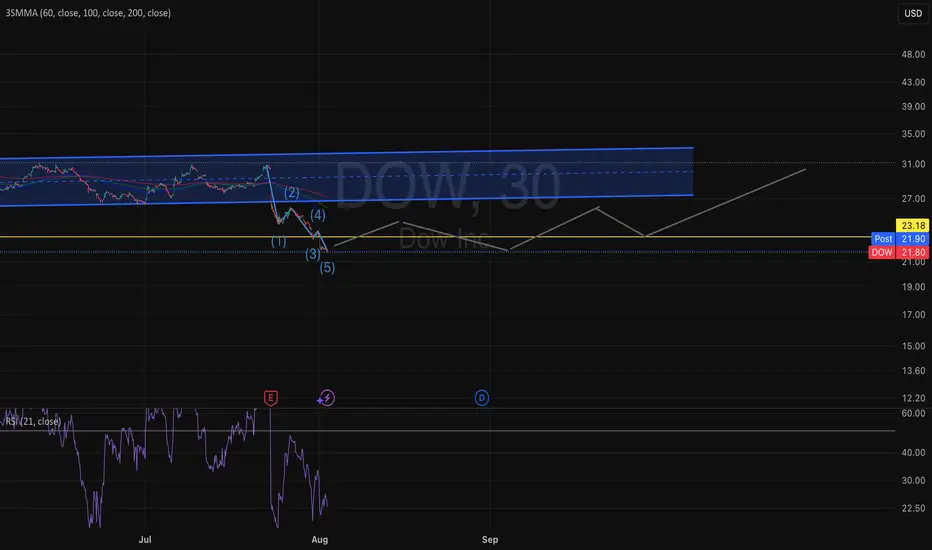
Will the DOW every Rally after Tariffs?Disclaimer: I do NOT know what I am doing.
Based on Elliot Wave, recent consolidation, and Phi sequencing, the pullback for 'Merican production should fire up the movement.
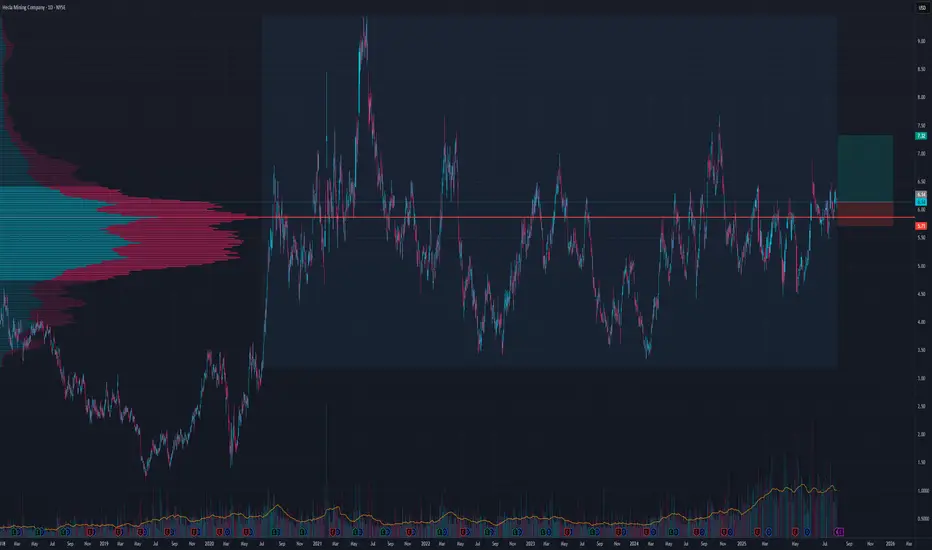
Another HL winner?I like this patter and potential push away from POC
Even tho tp could be higher and setup is still valid until 5.4 for a shorter term SL is at 5.7 and TP at 7.33 for a good risk to reward
$DUOl Bottomed? PT $600 Bounced off where it is supposed to on the lower trendline. This is on linear scale and if
DUOL manages to reclaim the 8SMA, things will start looking better to the upside. One step at a time! ;)
PT $600+ (Top of the channel)

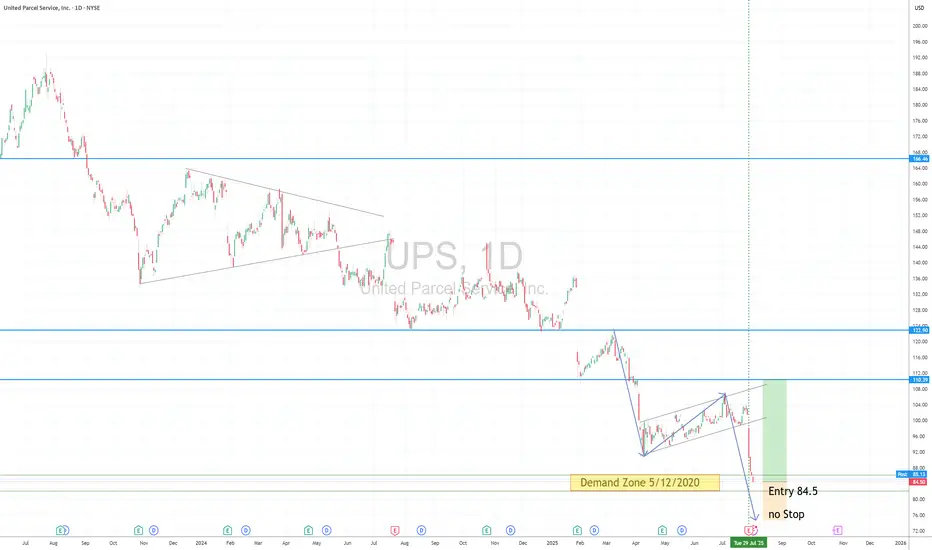
UPS Longdemand Zone (5/12/2020 drop based rally),
Long entry 84.5
no Stop ,
Target 110
Risk management is much more important than a good entry point.
I am not a PRO trader.
In my trading plan, the Max Risk of each short term trade should be less than 1% of an account.
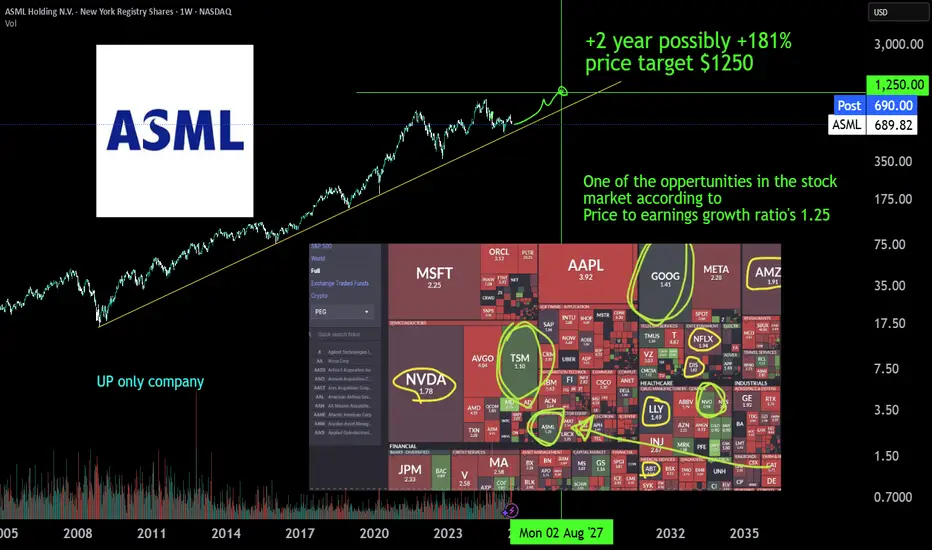
ASML monopolist, AI expanding +181% | 2Y oppertunity ASML is the monopoly Extreme ultra violet machinery company. There is no one close to it's technology or there is no one investing enough to R&D a thing like it. The whole AI datacenter and cloud chip growth depends on EUV machinery of ASML developed in 2013 (>10y of PhD level R&D deveopment). The first new High-NA EUV systems have been deployed at Intel in July 2025 for research purposes and will scale just like the EUV already does to keep pace with moore's law. TSMC has stated it will not yet depoly the machines but has to expand with to 10 year older tech EUV machines just to get the AI chip demand going. AI chip demand at NVIDIA is growing harder than expected comfirmed by latest earnigns of alphabet, microsoft, meta and amazon.
Also don't sleep on BESI a packing machinery wonder due to hydrid bonding technology, which makes 3D chip staking possible.
#GoHighTechNetherlands
AMZN dip buyAMZN was one of the names hit the most after today's/this weekly drop. over 8% fall. no need to check the RSI to see how oversold it is lol. I think the market will see a mag 7 stock drop this large as a buying opportunity which made me look at TA. the 4 hr has a red hammer and has a new higher high on the 15m.

Abbvie, maybe this time...
NYSE:ABBV has been very hard to trade...but with earnings behind us and good beat and guidance, I think this will run..
creating an ascending triangle here with higher highs into equal lows and a close above 197 next week could send this way past 200 IMO
healthcare sector is beaten down as it is, so any rotation into the sector will also help the stock

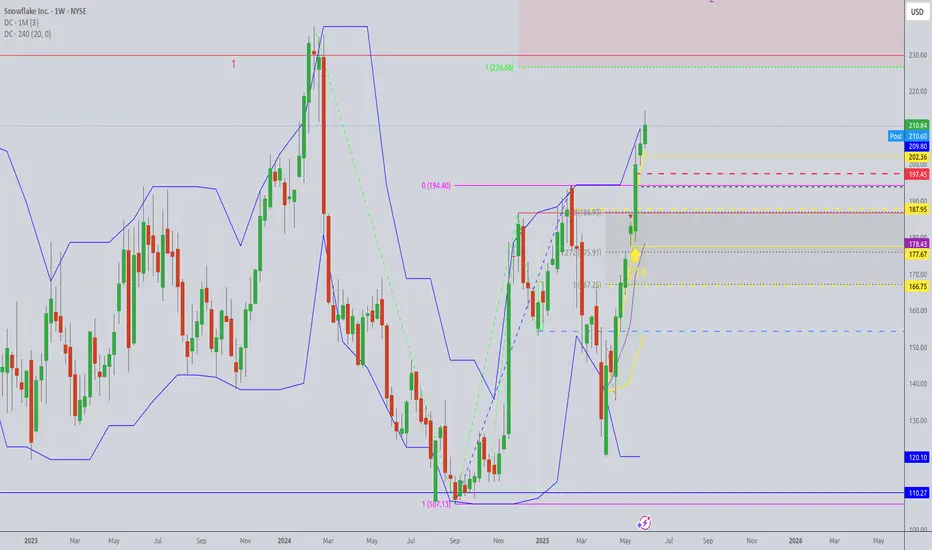
Put a lid on what smells badWe are within a resistance range that is as old as 5 years. It has been confirmed impressively in February 2024 again. Perhaps we will test these high again within the next weeks. But I oubt that we may decisive exceed the 230-240 level as this resistance is very strong and even stronger due to the 2024 Fibonacci extension.
The top on Wednesday could no be overcome. This means to me that we are in a decisive zone now with a possible correction attempt towards the open window of mid May.
Another upward attempt may be followed then.
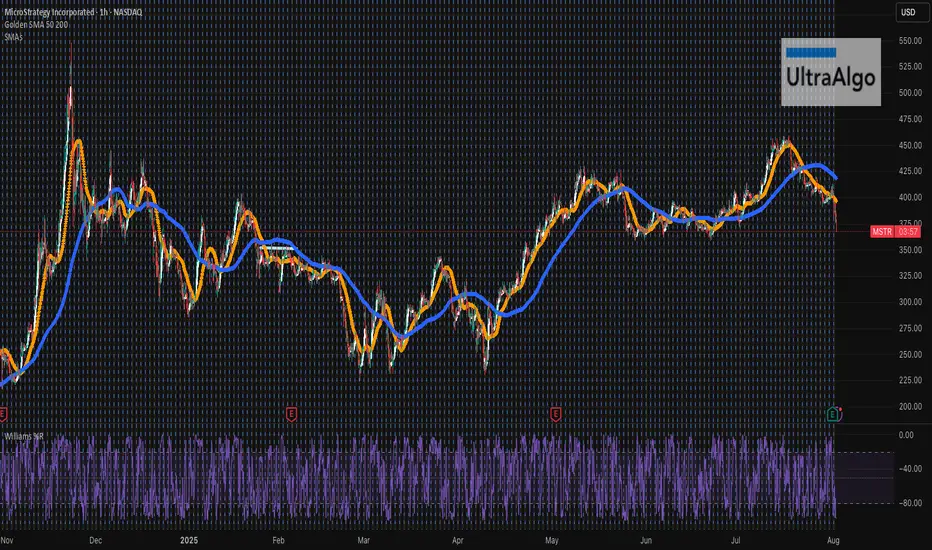
MSTR....Free FallingMSTR looks like it is nosediving straight down. When one is bullish on BTC, it is important to also understand that volatility is a big part of the game - a very costly game with many losers! BTC has past several key TAs and we only just started - crossing $300 is in the horizon. Always do your own due diligence, and received ultrabear signal earlier to exit, and cut your losses soon.
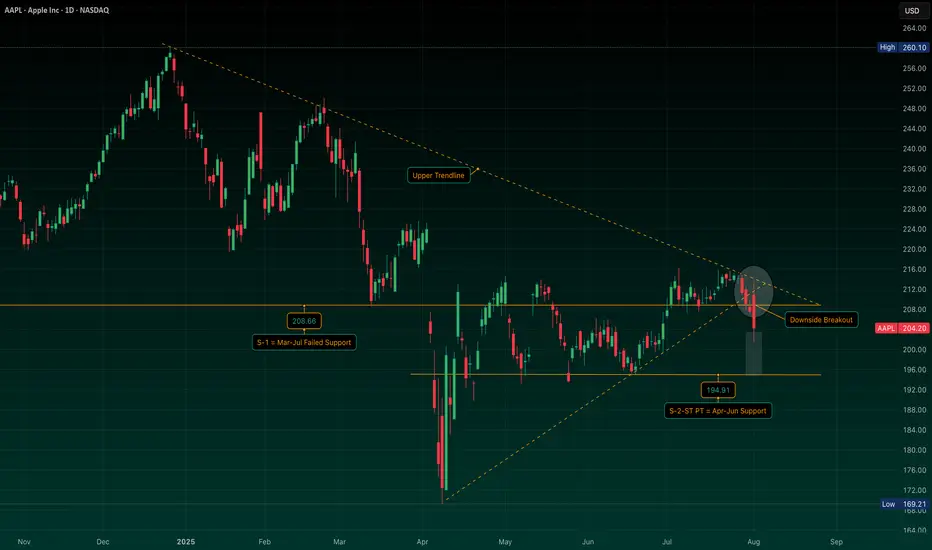
AAPL: Symmetrical Triangle Breakdown with S-2 in FocusAAPL has now broken below a well-defined symmetrical triangle structure, as well as the ~$208 S-1 support area I’ve highlighted.
I’m watching the $194.91 zone (S-2), which served as a key support and pivot earlier this year. If price heads into that area, I’ll be looking for confirmation and stabilization before initiating a position.
If the setup aligns, I plan to trade it via Sep/Oct put sales around the $170/$175 strikes -- targeting levels I’d be comfortable owning if assigned, and collecting premium if not.
Not stepping in early here… just tracking structure, respecting price action, and planning around risk-defined entries. We’ll see how this one plays out. Stay tuned.
Bottom Feeding or FALLING KNIFE?Looking at this chart, we see a HUGE selloff this week, with significant volume, leading to oversold levels on the daily RSI.
Technically, this chart looks terrible, but this could actually be a big ploy to get weak hands to sell their shares right before the company has a fundamental change in their business operations. Potential naked shorting by institutions to push down the price, and they scoop up shares for cheap. They have literally laddered this down the ENTIRE WEEK.
It did not help that the entire market was showing weakness after plenty of froth - but I believe this is short term noise.
This should revisit 3.50-4.00 within the next 2-3 weeks - but it could absolutely go lower and break the all time lows.
I personally think this at or near the bottom, that this selloff is testing shareholders conviction, and any sale here is being offset by a buyer who believes in what they own.
If the ER release comes out and they guide for 400m in EBITDA or above for the next 12mo, you can expect a relief rally as the stock will rerate from down in the dumps/going bankrupt, to a potential multi-bagger.
If the ER shows that they were slow to bring the oil wells online and that they're producing significantly less oil than they projected at the time of acquisition, this will be trading sub $2. This is Management's time to shine and show the world they're not fucking idiots.
Best of luck.

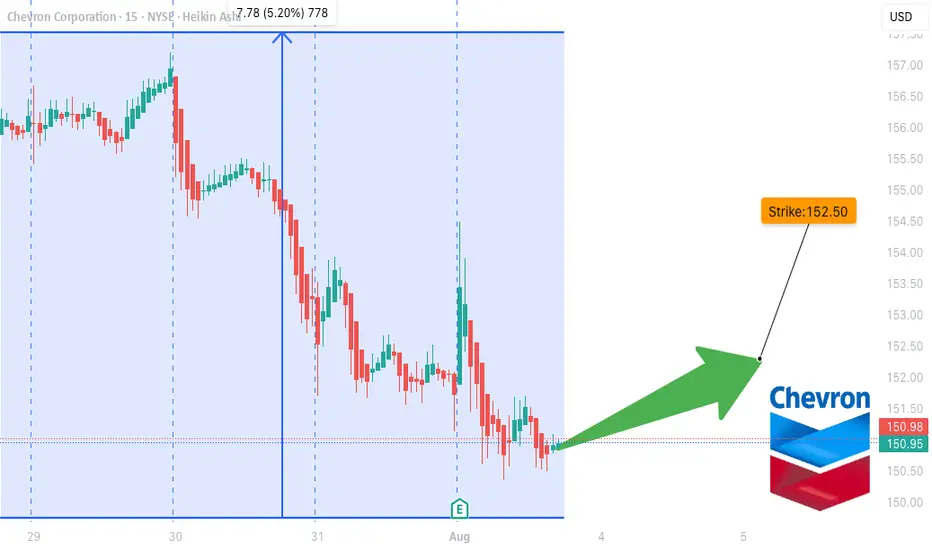
CVX Earnings Trade Setup — August 1, 2025
## 🚨 CVX Earnings Trade Setup — August 1, 2025 🚨
🔍 **Chevron (CVX) Earnings Analysis | High Conviction Call Play**
### 🧠 Model Consensus (Multi-LLM Blend)
* 📉 **Revenue Trend:** -1.0% TTM growth, margin pressure from falling oil
* 📈 **Analyst EPS Expectation:** \$11.04 with 26.2% YoY growth est.
* ⚠️ **Miss Rate:** 50% EPS beats w/ average surprise -2.2%
* 💬 **Consensus Sentiment:** ⚖️ *Moderate Bullish (Confidence: 60%)*
---
### 🔥 Options Heatmap
* 🟢 **Most Active Call:** \$152.50 strike, 🔥 ask volume at 152
* 🔺 **IV Rank:** 63% → *Moderate move expected*
* 🧊 **Put/Call Skew:** Defensive bias with light bullish divergence
* 🕵️♂️ **Dark Pool:** Mild accumulation hints by institutions
---
### 📉 Technical Breakdown
* 🔹 Near 50/200 MA — Neutral Pre-Earnings Drift
* 🔸 Support: \$150 | Resistance: \$155
* 🔻 Volume: 0.53x avg → *Weak conviction*
---
## 🎯 TRADE SETUP
🛠️ **Strategy:** Long Call (Pre-Earnings Entry)
💰 **Strike:** \$152.50
📅 **Expiry:** 2025-08-01
💸 **Entry Price:** \$3.70
🧠 **Profit Target:** \$11.10+ (200–300%)
🛑 **Stop Loss:** \$1.85
📊 **Risk/Reward:** \~2.5:1
🕓 **Exit Timing:** 1–2 hrs post-earnings (to avoid IV crush)
---
### 🧪 Earnings Catalyst Trade
Chevron’s setup shows a **classic low-volume/high-upside IV play**. Risk tightly managed with a defined stop, but room for explosive move if earnings surprise to upside.
---
📦 **Trade JSON Snapshot:**
```json
{
"instrument": "CVX",
"direction": "call",
"strike": 152.50,
"expiry": "2025-08-01",
"confidence": 60,
"profit_target": 11.10,
"stop_loss": 1.85,
"size": 1,
"entry_price": 3.70,
"entry_timing": "pre_earnings_close",
"earnings_date": "2025-08-01",
"earnings_time": "AMC",
"expected_move": 5.0,
"iv_rank": 0.63,
"signal_publish_time": "2025-08-01 13:05:25 UTC-04:00"
}
```
---
📈 **#OptionsFlow #CVX #EarningsPlay #TradingViewSetups #LongCall #EnergySector #IVCrushProtection #PreEarningsTrade**
APLD 0DTE TRADE IDEA (AUG 1, 2025)
## 🔥 APLD 0DTE TRADE IDEA (AUG 1, 2025)
**💡 Multi-AI Model Consensus | High Risk-Reward | Gamma Alert**
### 🧠 AI Model Summary
✔️ **Bullish Momentum** confirmed across all models
📉 **Volume Weakness** = key caution signal
⚠️ **Gamma Risk HIGH** → Most recommend entry *next session* (Monday)
---
### 🛠 TRADE SETUP (Based on Consensus Call)
| Field | Value |
| -------------- | ------------------------------ |
| 📈 Direction | **CALL (Bullish)** |
| 🎯 Strike | **\$13.50** |
| ⏰ Expiry | **Aug 1 (0DTE)** |
| 💰 Entry Price | **\$0.23** (ask) |
| 🎯 Target | **\$0.35** |
| 🛑 Stop Loss | **\$0.12** |
| 🔁 Size | 1 Contract |
| 📊 Confidence | **75%** |
| 🕒 Entry Time | **Next session OPEN (Monday)** |
---
### 🔍 Key Model Insights
* 📊 **Call/Put Ratio Bullish** across all platforms
* 📉 **Weak Volume** warns of unsustainable moves
* 🧨 **High Gamma Sensitivity** → rapid profit/loss shifts
* 🧠 **Claude / Grok / DeepSeek** all flag for rapid exit if entered today
---
### 📌 TradingView Viral Caption
> ⚠️ \ NASDAQ:APLD 0DTE 🔥
> Models agree: 🚀 bullish trend, 💀 dangerous gamma
> ✅ \$13.50 CALL @ \$0.23 → Target: \$0.35
> ⏱️ Most say: **WAIT ‘til Monday open**
> 🔍 Risk tight. Exit fast. Volume light.
> \#APLD #OptionsTrading #0DTE #FlowTrading #AIModels #GammaSqueeze #FridayTrades #TradingViewIdeas

Reddit breaks out for bullish run I have been watching Reddit for a couple of weeks and identified that we had put in the .786 low from the correction since February and then formed a range that was well respected for the past 4 months .
In this video I highlight zones where i expect price to gravitate too and where a nice entry will be if you are looking to long reddit.
Tools used Fib suite , trend based fib , tr pocket , 0.786 + 0.382 and fixed range .
