This is going down to $8, When.. sooner or later!This name has popped up a lot lately. Just be careful not to be the bag holder when the music stops!

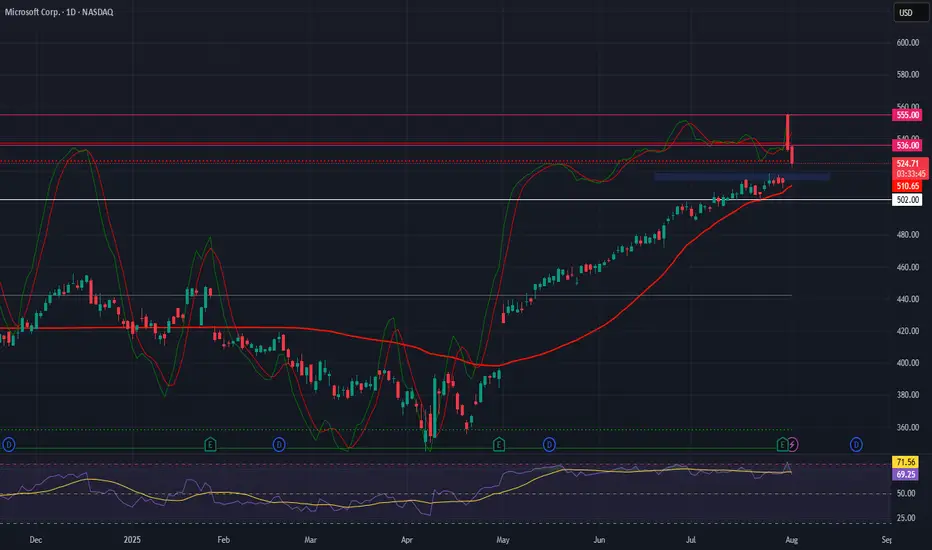
Microsoft (MSFT)–Watching for Pullback Entry After $4T MilestoneMicrosoft Corp. NASDAQ:MSFT has become the second company after Nvidia to cross the $4 trillion market cap, powered by strong AI and cloud demand.
Azure revenue grew 34% to $75B in 2024, with a $30B AI infrastructure investment fueling future growth. Q4 EPS came in at $3.65 on $76.4B revenue, showing strong fundamentals.
We are looking for a pullback to key support for a long entry:
Trade Plan:
Entry Zone: $515 – $518
Take Profit: $536, $555
Stop Loss: $502
#Microsoft #MSFT #Stocks #Trading #StockMarket #TechnicalAnalysis #AI #Cloud #BigTech #NASDAQ
Quantum's TSLA & NVDA Trades 8/1/25Simply breaking down what I look at going into the trading day. Premarket watchlist was short but nailed TSLA short for 150% and could have made double that on TSLA and NVDA longs. Due to hitting my daily goals I had to walk away to avoid overtrading but what an amazing day.

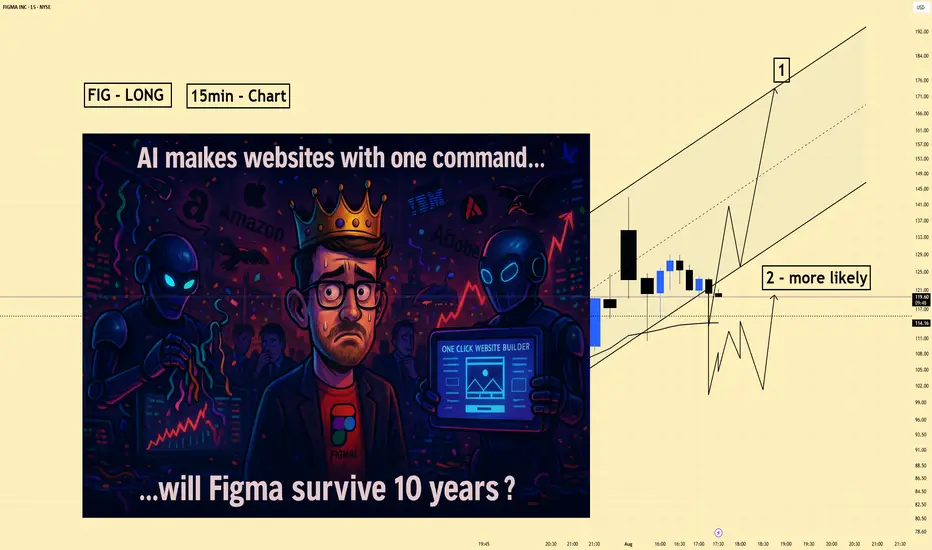
Figma (FIG) | Short Bias | AI Pressure on Design (Aug 2025)Figma (FIG) | Short Bias | AI Pressure on Design Platforms (Aug 2025)
1️⃣ Short Insight Summary:
Figma just went public with a huge IPO pop, but the company faces serious long-term questions. With AI rapidly changing design workflows and tech giants aggressively cutting costs through automation, the design-collaboration market could look very different in a few years.
2️⃣ Trade Parameters:
Bias: Short
Entry: Watching for re-tests near $110–$115 (post-IPO highs)
Stop Loss: Above $120 to protect against strong breakout continuation
TP1: $95
TP2: $80
(These levels can adjust based on broader market reaction and SPX performance)
3️⃣ Key Notes:
Figma is an incredible platform, but it must keep up with AI-powered design tools that can build full websites and products in minutes. We’re already seeing major tech companies (IBM, Amazon, Apple) laying off staff because AI is streamlining operations. If Figma doesn’t stay ahead, its massive IPO valuation could be hard to justify.
S&P 500 reaction is also key—if the index weakens, high-flying IPO names like Figma could see sharper corrections.
4️⃣ Follow-up:
I’ll revisit this trade idea after we see how price reacts around the $110–$115 zone and how broader market sentiment plays out.
Please LIKE 👍, FOLLOW ✅, SHARE 🙌 and COMMENT ✍ if you enjoy this idea! Also share your ideas and charts in the comments section below! This is best way to keep it relevant, support us, keep the content here free and allow the idea to reach as many people as possible.
Disclaimer: This is not financial advice. Always conduct your own research. This content may include enhancements made using AI.
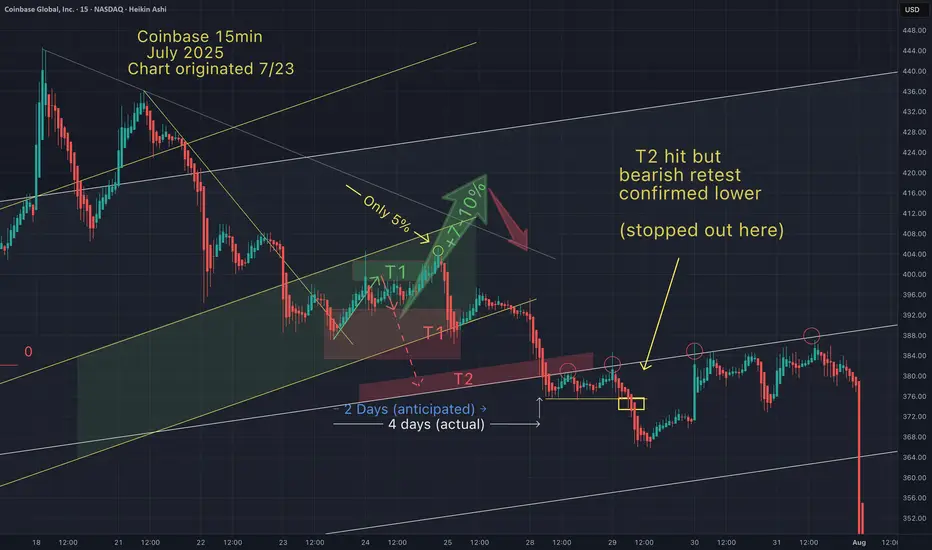
Coinbase - T2 hit (but stopped out)We can't win them all, but I can limit my losses by knowing where are the best entry points, and quickly understanding how/when my strategy gets invalidated. So I know where to set my stop losses and minimize risk. Proper risk management is key.
I'm more focused on Btc and alts, but if anyone is interested in more of my Coinbase trading ideas let me know.
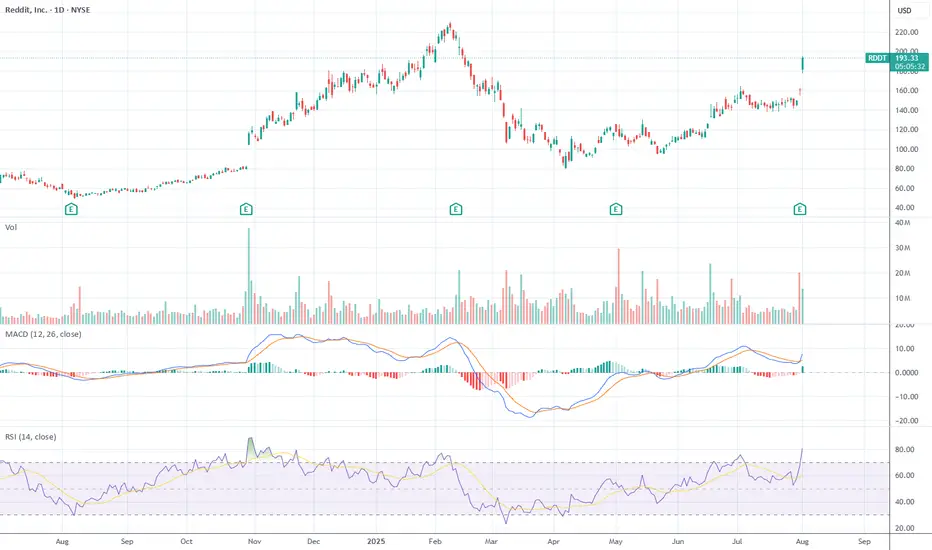
Reddit (RDDT) – Technical + Earnings + Macro Breakdown Just finished breaking down Reddit (RDDT) after today’s big move, and I think it’s worth laying out the full picture — technicals, earnings, macro — because this one’s got real substance underneath the headline jump.
TL;DR: this is a real breakout, not meme hype, but it's happening in a fragile macro context, and you absolutely shouldn't chase it blindly.
Let’s start with the chart. Today’s candle, so far, is textbook bullish — almost marubozu-style — opening near the lows and closing near the highs, up 4.74% on serious volume. No upper wick, which means buyers were in control all day. This came right after earnings and broke out of a multi-month range that had been holding since April. Price smashed through the $170–175 zone, which was the prior swing high from March. That’s a legitimate breakout. And the volume confirms it’s not retail FOMO. Technically, it’s a continuation move, not a reversal, but it’s also coming at the tail end of a very sharp thrust. This is a bullish continuation pattern, but one where you start looking for digestion, not acceleration.
Momentum-wise, everything is flashing green — but maybe too green. MACD just made a fresh bull cross with an expanding histogram, and RSI is screaming at 88.69. That’s extreme, no two ways about it. But when you get this kind of breakout on strong earnings, RSI can stay overbought for days or even weeks. The trend since May has been a clean stair-step move higher — no parabolic blow-off yet — but today might be the first sign of euphoria starting to creep in.
If you’re a box fan, this move also fits the mold. The $110 to $175 range held from April through July, and we just broke out of that box with volume confirmation. Logic would project a target by adding the range width (~$65) to the breakout level — that puts a rough upside target at $240. Of course, these moves rarely go straight up — you usually see a break, a retest, and then a continuation. So don't expect a clean shot to $240. Still, the technical structure is legit.
Now let’s zoom in on some Fib levels from the May swing low at $110 to today’s high of $191. If we get a pullback, the first dip zone is the 23.6% retracement at $171.52. That’s close to today’s breakout level, so watch that carefully. Below that, $157.27 (38.2%) is the major reload zone, and $150.50 (50%) is where trend-followers should probably stop out if it breaks with volume. On the upside, the 127.2% extension sits at $215.76, then 161.8% at $241.39, and finally 200% at $272. Realistically, $191 is acting as the first resistance cap, since it's the full 100% extension from the move.
Now here’s where things get even more interesting — fundamentals. This earnings print was strong. No massaging, no fancy adjustments — just raw numbers. Revenue was up 78% year-over-year, hitting $500M. Net income? $89M GAAP. Yes, actual profits. And Reddit’s positioning in the AI narrative is no joke — they’re now the most cited domain for AI model training across the board. Wall Street is obsessed with “data moats” right now, and Reddit has one of the deepest UGC data pools available. Ads are booming too — ad revenue up 84% YoY. CFO basically said they’ve found the balance between growth and profitability, which ticks boxes for both value and growth investors. Bottom line: this is the quarter where Reddit starts getting re-rated from “weird social media” to “AI-leveraged data platform with real margins.”
But — and this is important — macro risk is back. Today wasn’t just a feel-good market day. We got downward payroll revisions (which makes the labor picture look worse in hindsight), and tariffs are being reintroduced, which is never good for risk appetite — especially in tech. If yields spike or markets start pricing in more Fed tightening, high-growth names like Reddit will feel it. You can't ignore that RSI is already 88 — meaning if the macro starts rolling over, Reddit is at real risk of a fade purely due to liquidity rotation.
So tactically, this is a setup where you respect the breakout, but you don’t chase it. First support is $171.52 — that’s your first pullback buy zone. Then $157.27 is your deeper dip/reload level. On the upside, $191 is resistance. If it breaks cleanly above and holds with volume, $215 is the next stop. If it slices below $157 with volume, that’s a red flag and probably invalidates the trend for now.
Final take? RDDT is one of the best fundamental stories this quarter, and today’s move was backed by structure and volume. But we’re late in the thrust, macro is fragile, and sentiment is stretched. Be patient. Wait for a pullback or tight consolidation above $171. If that holds, $215+ is on deck. If it doesn’t, sit back and wait for the dust to settle — this trend isn’t dead, but it’s not invincible either.
Rackspace Technology inc. W2 of W1 completed.
We are facing a Motive powerful 3rd Wave of W1 now.
Target price of W1 = 3$
Highly recommended for Buying Right Now ✅️ 👌

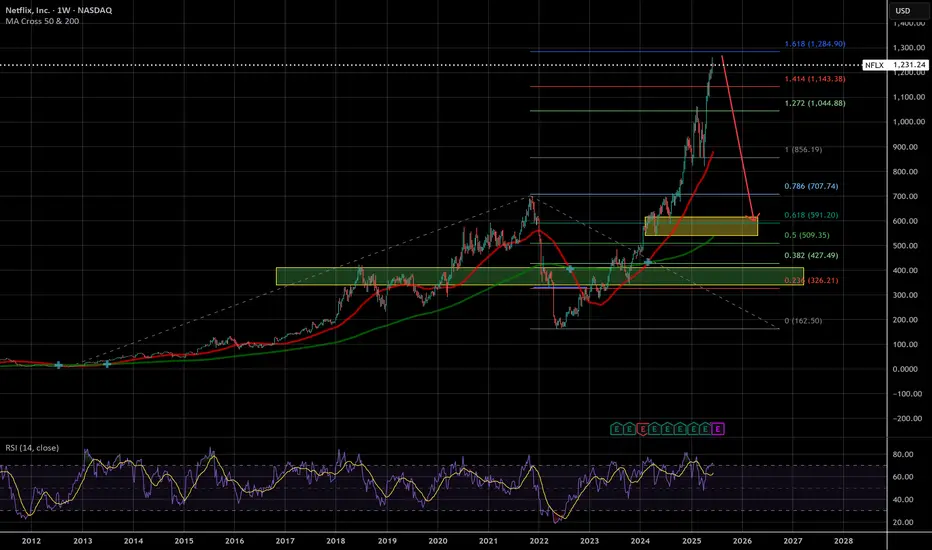
Unsustainable GrowthMy buy zones are below, as we approach the 1.618 extension this insane wave looks like it may out of steam soon. As a best-guess approach I will wait for the 0.618 price or go look for another stock if that doesn't materialize
Ocean Pal, Inc $OP going to .01 centThis one will soon be at .01 cent. Why? Outstanding shares went from 7 million to over 170 million as of a July 31st filing! OceanPal is based is Greece (not known for their financial accountability). There are others posting about an upswing to $3 based on TECHNICAL analysis. However, they are ignoring the fundamentals. Short this one if you can!

WeBull Look Ahead $BULLRecently took a look at WeBull and I believe there is a huge arbitrage opportunity from NASDAQ:HOOD to $Bull.
Although RobinHood is building something much much bigger than anticipated, including banking, I think WeBull can take some of $HOODS market share depending on their direction.
-Webull's total revenues grew 32% year-over-year to $117 million in the first quarter of 2025, according to SEC filings
-Customer assets increased 45% year-over-year, reaching $12.6 billion at the end of Q1 2025, according to Webull
-The number of registered users grew by 17% year-over-year, according to Webull
-Partnership with prediction market Kalshi will grow profits for WeBull exponentially.
www.nasdaq.com
This Might be the best price to get in today depending on WeBull's Success.

TradeUSAsignals RecommendationsLong (5% of your portfolio) GLXY (Order filled @ 29.57)
We have an up trend under Time traders control (brown arrow) with a correction more than 38.2%.

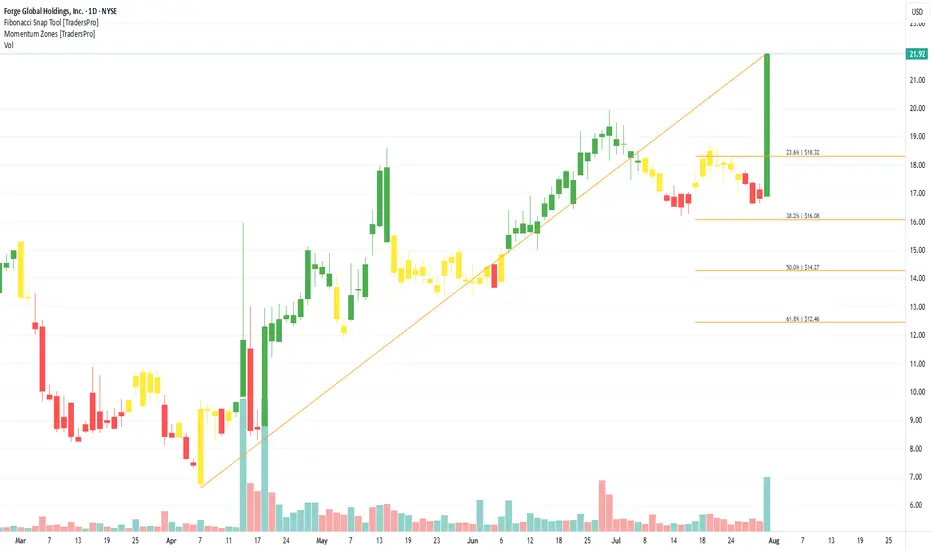
Forge Global Holdings, Inc. (FRGE) Unlocks Pre-IPO AccessForge Global Holdings, Inc. (FRGE) is a leading marketplace for trading private company shares, connecting investors and institutions to pre-IPO opportunities. The platform provides access to data, insights, and trading solutions that help investors navigate the private market space. Forge Global’s growth is fueled by increasing demand for alternative investments, more companies staying private longer, and a rising interest in unlocking liquidity from private equity holdings.
On the chart, a confirmation bar with rising volume indicates strong buyer momentum. The price has moved into the momentum zone after breaking above the .236 Fibonacci level. A trailing stop can be set just below this Fibonacci level using the Fibonacci snap tool, allowing traders to secure profits while leaving room for further gains.
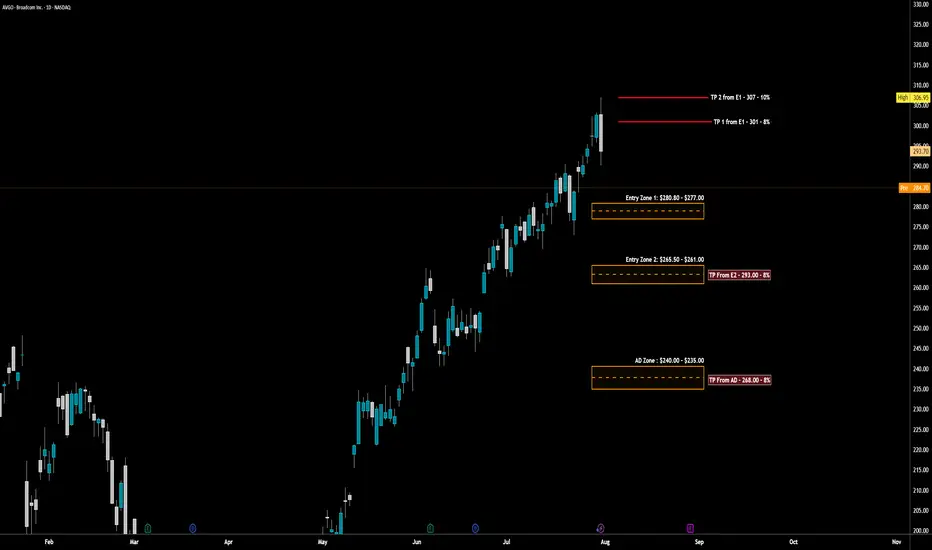
AVGO - LONG Swing Entry Plan NASDAQ:AVGO - LONG Swing Entry Plan
Entry Zone 1: $280.80 – $277.00
→ Open initial position targeting +8% from entry level.
Entry Zone 2: $265.50 – $261.00
→ If price dips further, average down with a second equal-sized entry.
→ New target becomes +8% from the average of Entry 1 and Entry 2.
AD Zone : $240.00 – $235.00
→ If reached, enter with double the initial size to lower the overall cost basis.
→ Profit target remains +8% from the new average across all three entries.
Risk Management:
Stop Loss:
Risk is capped at 12% below the average entry price (calculated across all executed positions including the Edit Zone).
Position Sizing Approach:
Entry 1: 1x
Entry 2: 1x
AD Zone: 2x
→ Total exposure: 4x
→ Weighted average determines final TP and SL calculations.
______________________________________
Legal Disclaimer
The information provided in this content is intended for educational and informational purposes only and does not constitute financial, investment, or legal advice or recommendations of any kind. The provider of this content assumes no legal or financial responsibility for any investment decisions made based on this information. Users are strongly advised to conduct their own due diligence and consult with licensed financial advisors before making any financial or investment decisions.
Sharia Compliance Disclaimer: The provider makes no guarantees that the stocks or financial instruments mentioned herein comply with Islamic (Sharia) principles. It is the user’s responsibility to verify Sharia compliance, and consultation with a qualified Sharia advisor is strongly recommended before making any investment decisions
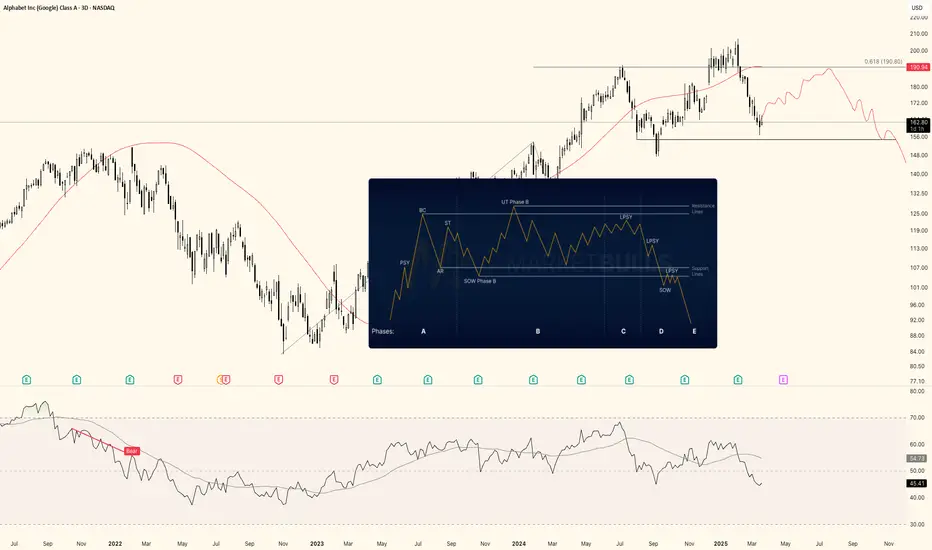
Google in a distributive phase?Could be printing a distribution here. Early signs, so very early on this idea. Would need to see PA evolve like showed in the graph. Alternatively if it makes a HH, it could be printing a UTAD. Either way, I'll be looking for signs whether Wyckoff Distribution does indeed play out.
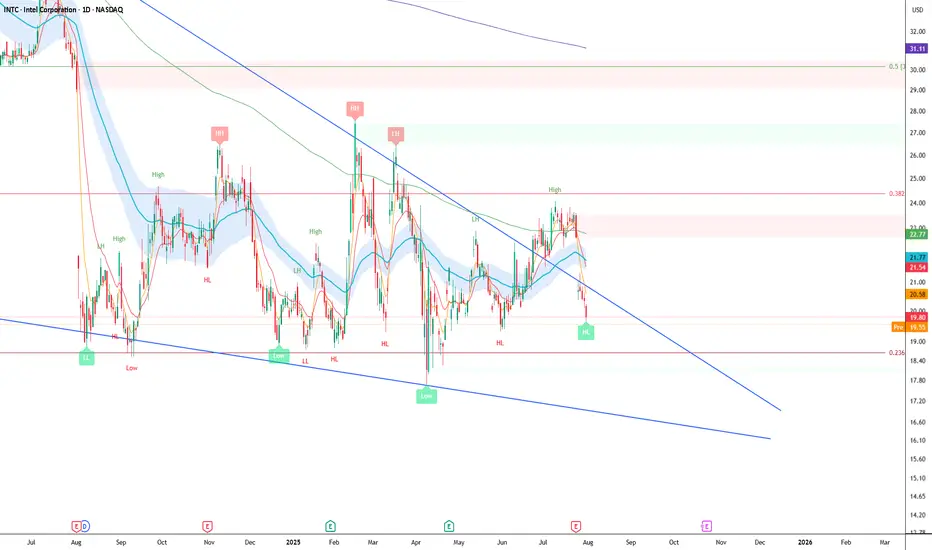
Intel Falling Wedge UpdateIntel Falling Wedge Pattern is not finished and still valid.
Failed to get above 0.382 so we could see $16-18, nice little gap to fill above the falling wedge trendline.
The pattern is valid on the weekly time scale.
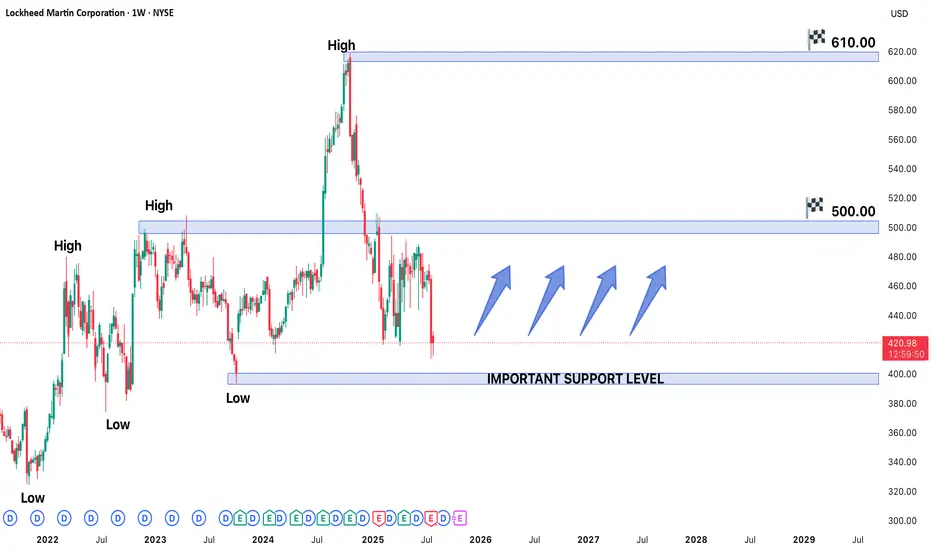
Lockheed Martin (LMT) Stock in Strong Bullish TrendLockheed Martin (LMT) Stock in Strong Bullish Trend - Key Levels to Watch
Lockheed Martin's (LMT) stock is currently exhibiting a well-defined bullish trend, trading near a recent higher low that may serve as a crucial support level for the next upward move. The defense giant continues to benefit from robust global military spending and a strong contract pipeline, positioning the stock for potential further gains.
Technical Structure & Key Levels
- Higher Low Support: The current price zone represents a critical support area where buyers have previously stepped in, maintaining the upward trajectory
- Upside Targets:
- Near-term: $500 (previous resistance zone)
- Long-term: $610 (potential breakout extension)
- Major Support: $375 would act as strong demand zone if any deeper pullback occurs
Bullish Catalysts Supporting the Trend
1. Defense Sector Strength:
- Record US defense budget allocations for 2024-2025
- Increased NATO military spending amid global tensions
2. Contract Backlog:
- F-35 program continues to drive revenue
- Hypersonic weapons and space systems development
3. Technical Momentum:
- Price trading above key moving averages (50/200 DMA)
- Higher highs and higher lows confirm uptrend structure
Trading Strategy Considerations
- Optimal Entry:
- On bounces from current support level
- On breakout above $460 confirmation
- Risk Management:
- Stop-loss below $375 for longer-term positions
- Partial profit-taking near $490-500 resistance
- Confirmation Signals:
- Volume increase on upside moves
- Sustained closes above $460
Potential Risks to Monitor
- Geopolitical shifts affecting defense budgets
- Program delays (particularly in F-35 production)
- Broader market corrections impacting defense sector
Long-Term Outlook:
The combination of fundamental strength and technical positioning suggests LMT could progress toward 500 near-term, with $610 as a viable long-term target if the bullish structure holds. Traders should watch price action around current levels for continuation signals while remaining mindful of the $375 support as a critical level for the bullish thesis.
What The 3 Step Rocket Booster Strategy Is In Short SellingTrading is not easy at all.
But with practice you will get it.
These past few days have been horrible because
i was so stressed i nearly fainted away not only
my body but also my spirit.
Sleeping is your number one goal.
I dont care if you have money or not.YOU HAVE TO SLEEP.
Because of this personal sleeping campaign am
off coffee and tea.These beverages are high in caffeine.
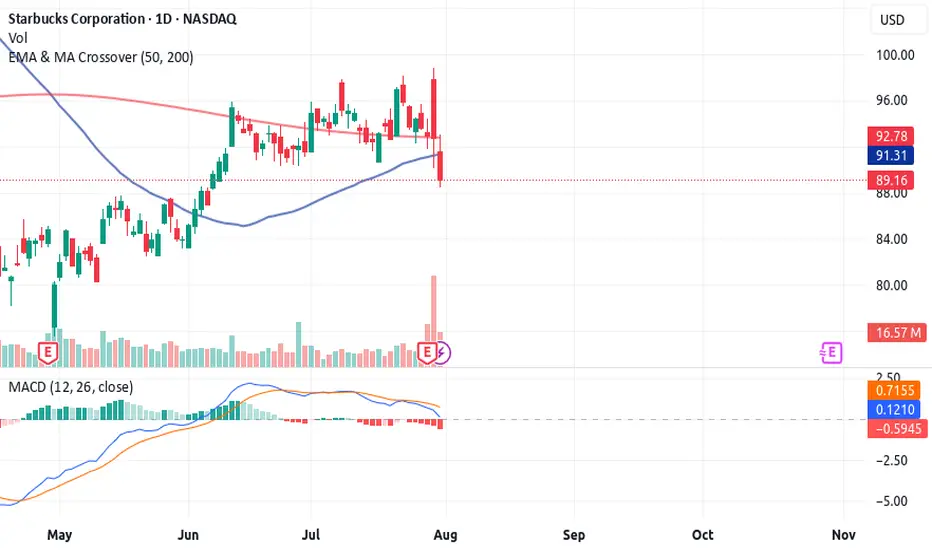
Speaking of coffee this company NASDAQ:SBUX isn't
doing well in USA.
It looks like Gen- Z are not using coffee spots
to socailise. As a 4% decline in business
transactions was recorded.
Even-though in China this store has an
Increase of
about 6% Has been recorded
thanks to delivery options.
Gen Z Still wants to stay at home.They
dont want to go outside and mingle.
Either way look at this stock price.
The candle stick pattern looks like
the falling three soldiers.
This pattern has been favored by the MACD
crossover above the zero line
It has to be above the zero line because
It indicates that the price is in a selling season.
Another catalyst:
-Negative earnings report.
Also to put the hammer on the nail.
This price is following the rocket booster strategy
from the sell side.
SO what is the rocket booster strategy?
The price has to be below the 50 EMA
The price has to be below the 200 EMA
The price should gap down
Remember to place a limit sell stop order
@$88.34
below the lowest low of the day.
Market orders are too expensive in the long term.
Rocket boost this content to learn more.
Disclaimer:Trading is risky please learn
risk management and profit taking
strategies.Also use a simulation trading account
before before you trade with real money.
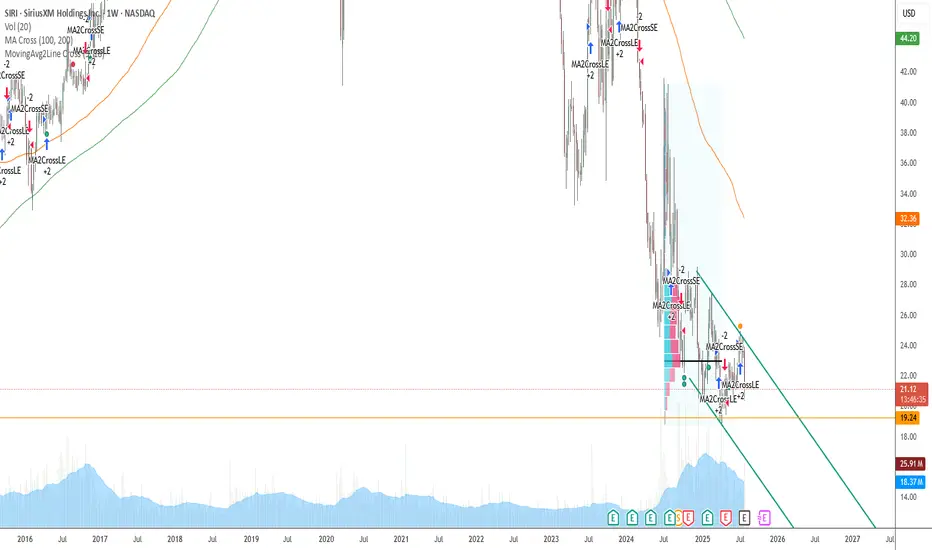
SIRI on the way down , correction begunThis stock is have a consistent Berkshire position and looks good to buy on a dip...
MARA in channelMARA seems to me to be in a bullish channel
since April, now on the lower edge of the channel

AMZN – Wedge Complete, Decision Imminent📦 AMZN – Wedge Complete, Decision Imminent
Price action has carved out a clean rising wedge into a known inflection zone. The top of this formation aligns with a macro breakdown level from Q1—likely to attract both breakout chasers and smart sellers.
📍 Key Levels:
Bull Break Target: $242.52
Bear Breakdown Target: $216.20
Decision Point: ~$228
This is a textbook volatility pocket. WaverVanir's DSS signals suggest we're nearing exhaustion. Watch for confirmation before positioning.
⚙️ VolanX Protocol – Predictive AI meets Market Structure.
#AMZN #WaverVanir #VolanX #SmartMoney #TradingView #NASDAQ #WedgePattern

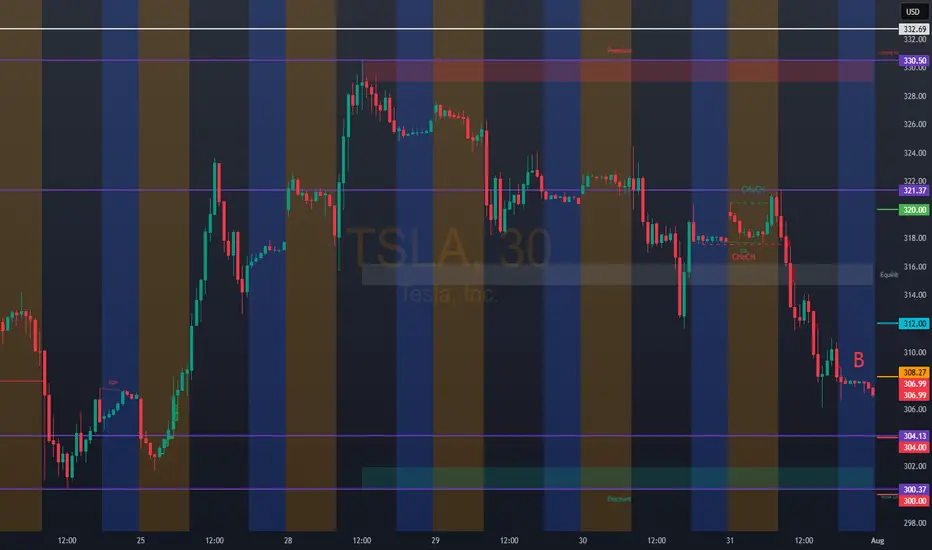
TSLA: 308.27Bullish Entries: 312.00/318.00 Stop 316.00 / Target 322.00–325.00
Bearish Entries: 304.00/300.00 Stop 302.00 / Target 296.00–292.00. Note: If the open starts above 312.00, we should wait for it to touch 318.00. Then, 320.00 is the entry for the previous day's bearish trend reversal and the new uptrend.
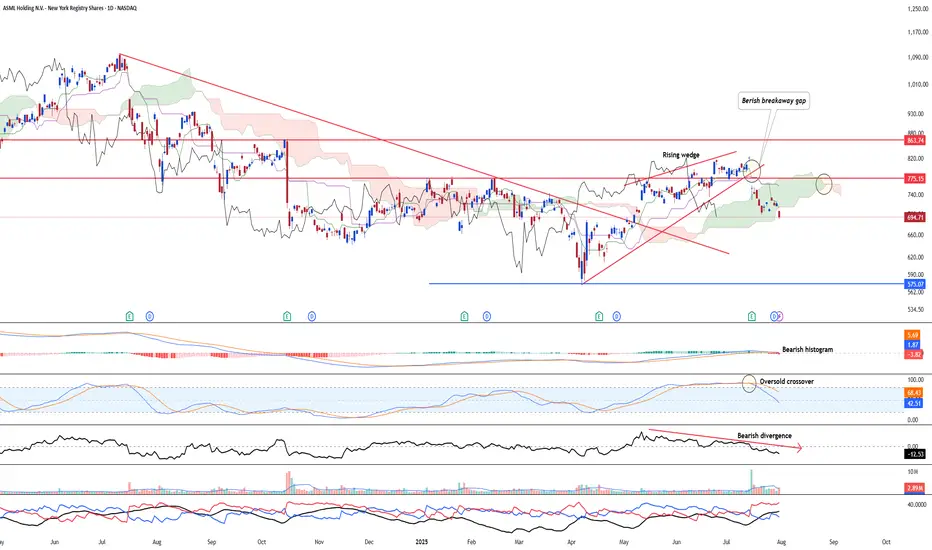
ASML - Resuming its bearish trendASML NASDAQ:ASML saw a strong bearish continuation after the stock has broken below its rising wedge formation. Ichimoku has shown a clear three bearish death cross right after yesterday's gap down below the kumo.
Bearish divergence is in on the 23-period ROC.
Long-term MACD has performed a bearish crossover at the top and histogram is negative.
Stochastic Oscillator has confirmed the overbought signal.
23-period ROC turns negative and forms a bearish divergence. Directional movement index saw increased bearish trend strength signal.
Target is at the next support of 575
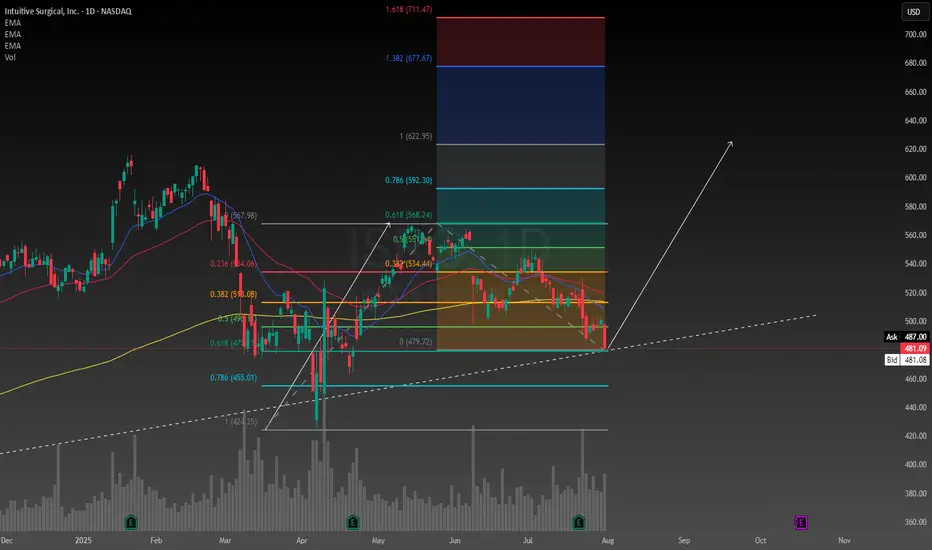
Technically Intuitive Surgical looks like it has found supportBecause I don't know much about the healthcare industry I have been avoiding it thus far. However I have done some research on Intuitive Surgical and was surprised to learn about what they do. The company is a mix between technology and healthcare, there's nobody to compete with them either which was something I found to be valuable at this time.
I have conducted a technical analysis using a trendline and a Fibonacci measurement. The risk is high, fundamentally the stock is very overvalued, but I believe this may be because of the potential the company has to grow. Every hospital is saying the same thing, they are understaffed. I feel like this company might have a positive influence to healthcare and hospitals in the future.
I have calculated the intrinsic value using the discounted cash flow model. Assuming a discount rate of 6.4%, with a 5 year exit the intrinsic value is $365. After running the numbers with a discount rate between 5.8% and 7.0% the range of the intrinsic value is between $235 and $1070 so there is clearly a potential for a significant upside. But I am taking a cautious approach because like I mentioned it is still looking over valued. I want to take the risk of owning this stock but I will monitor the company closely to make sure the fundamentals do not change as to why I decided to buy it in the first place.
I think the technical analysis I have drawn on the chart speaks for itself no need to explain much I think most people know technical analysis. I want to buy it tomorrow but I might wait a week or so to see how the tariff drama plays out and whether I can get a better deal or not I will probably enter with a stop order because I want to enter when the price is going up maybe above the next green bar on the daily we shall see I am being very cautious this time. I will start by allocating 5% of my portfolio to ISRG but that's always subject to change in the future.