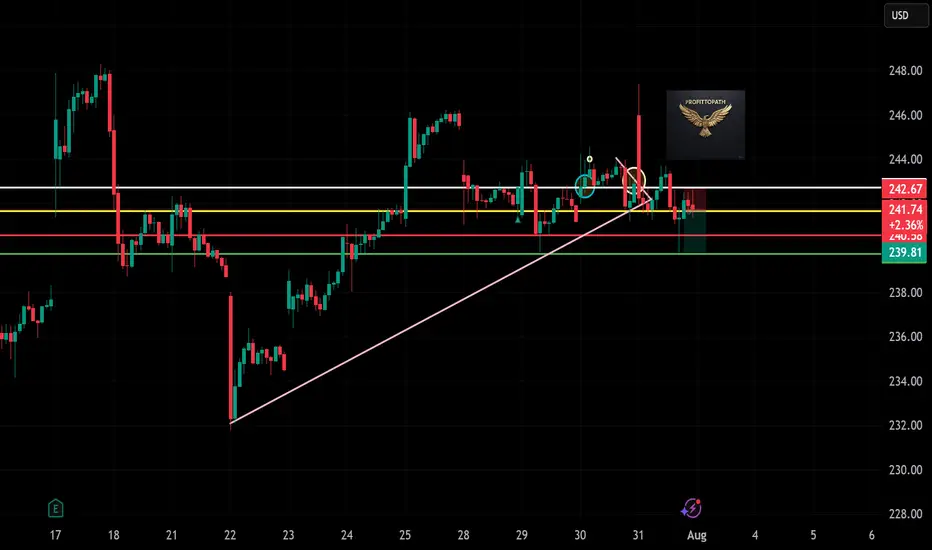
TSM Breakdown — Short Trade in Motion!“”
🎯 Setup:
→ Entry: ~$241.74
→ SL: ~$243.00
→ Target: $239.81
📌 Bearish rejection + trendline break = short opportunity.
CYBN had a green day!CYBN is in a daily downtrend but bounced form just above our key weekly 7.11 support level. What can we expect tomorrow an d into next week and what are the levels that matter?
Support: 7.11
Resistance: 8.18, 8.84

Wild action on CMPS earnings day. What's next?CMPS Weekly bull flag into new low of day is a short term red flag, but is there cause for concern in the longer outlook? Click to watch the free video for more details
I provider regular chart analysis of the psychedelics sector. Be sure to Like and Follow, and Subscribe to future updates so you don't miss a post!
Support: 3.92
Resistance: 4.60, 4.78

Review a Few of our Trades & Update Overall Market PerspectiveIn this video, I review some of the trades taken over the past 1-2 weeks, and discuss in more detail the current technical and geopolitical/macro thesis on AMEX:SPY NASDAQ:QQQ NASDAQ:SQQQ AMEX:SOXS , and the overall market. Exciting times, and ripe with opportunity to *potentially* BTD (again).

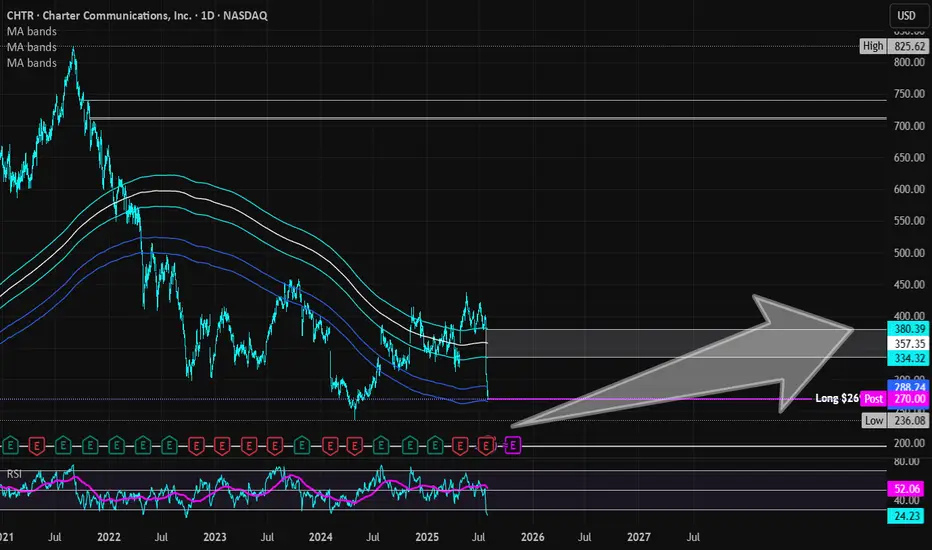
Charter Communications (Revised) | CHTR | Long at $269.50 **This is a revised analysis from December 26, 2024: . My stop was triggered in that original trade after the recent price drop (some gains were taken at 13%, as noted).**
Charter Communications NASDAQ:CHTR stock recently dropped due to a disappointing Q2 2025 earnings report, with earnings per share of $9.18 missing estimates of $9.58 and a larger-than-expected loss of 111,000 residential internet customers. Despite the recent subscriber losses and increased competition, the following factors suggest long-term growth potential:
Network Expansion: Launch of 2x1 Gbps service in eight markets in 2025, boosting competitiveness.
Rural Growth: Rural revenue projected to reach 10–15% of total revenue by 2025.
Cox Acquisition: $34.5B merger expected to close by mid-2026, yielding $500M in annual cost savings by 2028 and enhancing market share.
Mobile and AI Strategies: Strong mobile growth and AI-driven customer service tools to improve retention and efficiency.
Lower Interest Rates: Reduced bowering costs to help with profit margins.
Charter's President/CEO recently grabbed $2.5 million in shares under $300. From a technical analysis perspective, there is an open price gap near $195 that could be of concern in the near-term. I foresee that being closed if the whole market flips or more bad news for the company arises. But, with a P/E of 7x and the industry average being near 13x, I believe NASDAQ:CHTR is a good value at the moment.
Thus, at $269.50, NASDAQ:CHTR is in a personal buy zone with a note of "risk" of a drop near $195 (a second personal entry point if it hits that level before targets are reached).
Targets into 2028:
$330.00 (+22.4%)
$375.00 (+39.1%)
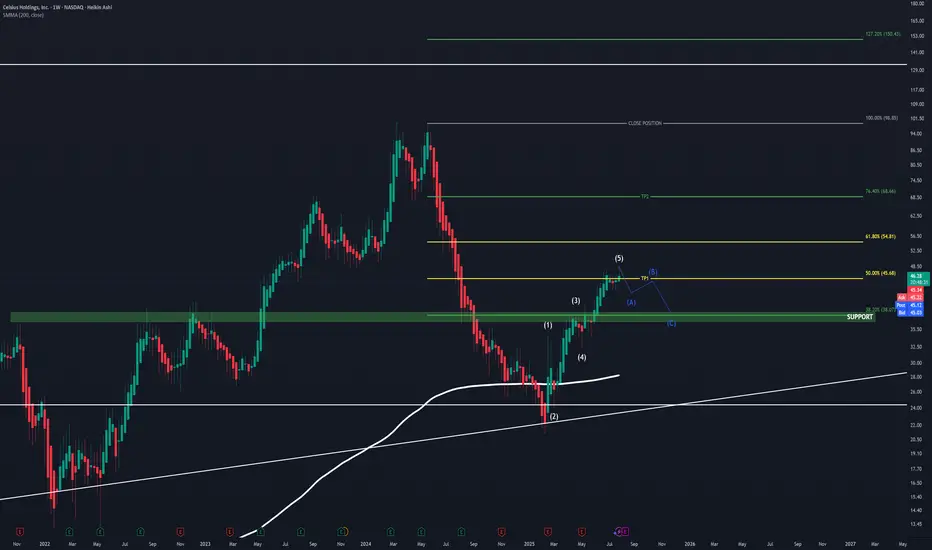
CELH UpdateAs mentioned in my old CELH post, I'm still holding.
On my new projections, assuming CELH is done for now due to it now testing the golden ratio 50.00% - 61.80% , a famous POI which more often than not results in a change in trend, and basing off of CELH's history, this area is respected.
So with this knowledge I have trimmed here, and I soon expect an ABC correction moving down to my level of support sitting at $38 , the 38.20% also sits here, which has also been proven to be a strong support level. If we find this level being tested, I will add back to my position and hold firm up toward $68.
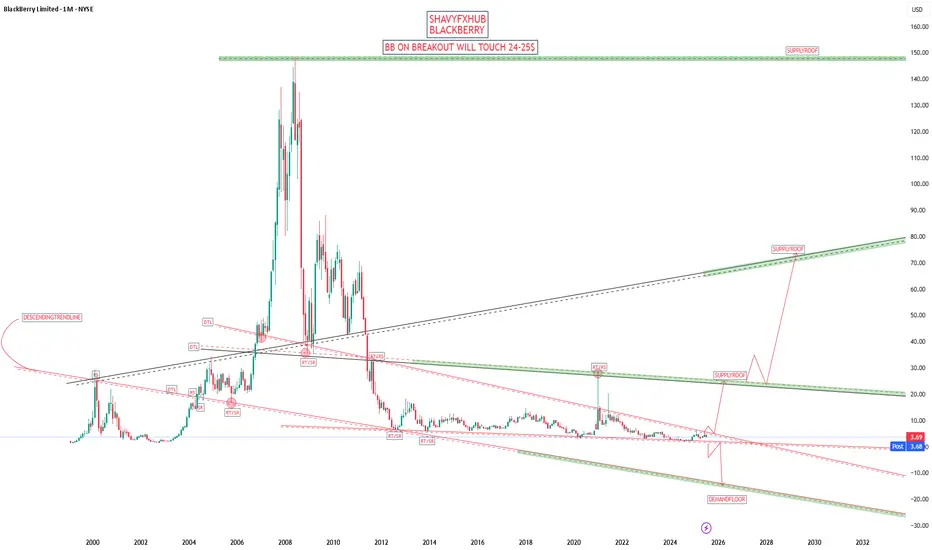
BLACKBERRY BREAKOUT OF DESCENDING TRENDLINE COULD SEE 22$-24$
BlackBerry today is a Canadian technology company specializing in cybersecurity software and Internet of Things (IoT) services for enterprises and governments worldwide. Formerly renowned as a mobile device manufacturer, BlackBerry Limited (formerly Research In Motion, RIM) exited the smartphone business in 2016 and now focuses on secure communications, endpoint management, and embedded systems, especially for industries like automotive, healthcare, and government.
Company Profile & Business
Headquarters: Waterloo, Ontario, Canada
Core products: Cybersecurity solutions, BlackBerry Unified Endpoint Management (UEM), QNX operating systems, secure messaging (BlackBerry Messenger Enterprise, BBMe), and automotive software platforms.
Global presence: Products and services are sold worldwide across the Americas, Europe, Middle East, Africa, and Asia-Pacific.
Recent Financials & Stock
Stock ticker: NYSE/TSX: BB
Recent price: As of July 30, 2025, BlackBerry closed at $3.74 per share, reflecting a decline from earlier in the month. Price targets for the company now range from $2.71 to $4.75, with analysts citing positive revenue growth and the company's first positive cash flow in three years after its recent quarterly results.
Business momentum: The company recently posted about 10% higher revenue compared to forecasts for the third quarter fiscal year 2025, with a shift to positive earnings and cash flow—highlighting improvements in its cybersecurity and IoT software businesses.
Notable News & Developments
End of smartphones: BlackBerry-branded mobile devices are officially discontinued. The company fully exited the hardware business by 2018 and stopped supporting BlackBerry 10 in 2022.
Nostalgia revival: In 2025, a separate company (Zinwa Technologies) is reviving classic BlackBerry devices (like the BlackBerry Classic and Passport) by retrofitting them with modern Android internals. These are not officially affiliated with BlackBerry Limited, but appeal to enthusiasts for the classic design and QWERTY keyboard, albeit with privacy caveats due to non-BlackBerry software.
Enterprise focus: BlackBerry remains a leader in secure software for businesses, including automotive OS (QNX), endpoint security, and secure messaging. Major clients include automotive OEMs, financial corporations, and government agencies.
Quick Facts Table
Aspect Details
Industry Cybersecurity, IoT software, enterprise services
Founded 1984 (as Research In Motion, Canada)
Consumer Phones Discontinued; brand revived unofficially by others
Current Stock Price $3.74 (July 30, 2025)
Latest Product Focus Automotive software, secure endpoint management
BlackBerry is no longer a phone maker, but remains a significant player in secure enterprise and automotive software, with stock prices and business outlook reflecting its transition into these fields.
#BB
charge fees on patentsTrump's decision to charge fees on patents exposes IDCC shares to long-term decline

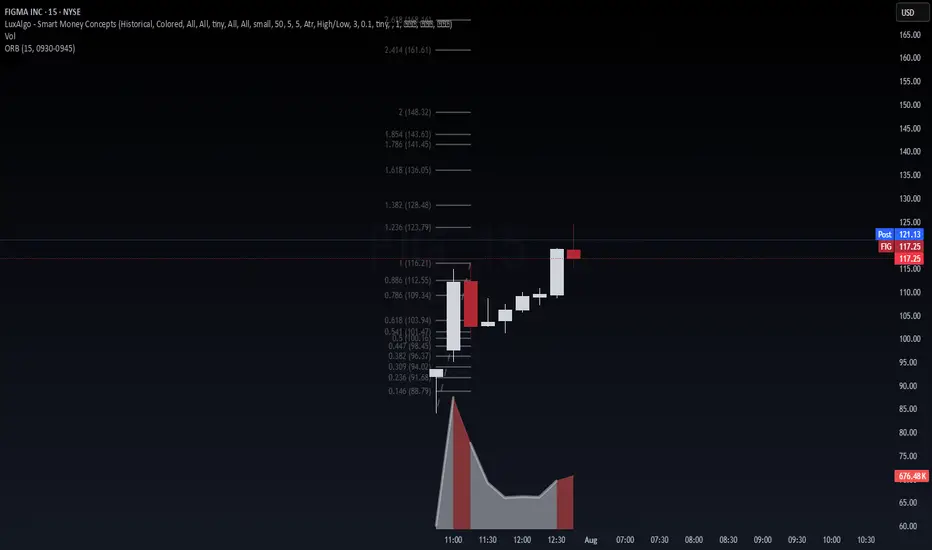
FIGMA INC. (FIG) – IPO Day Momentum + AI Design Wave📈 FIGMA INC. (FIG) – IPO Day Momentum + AI Design Wave
Figma just launched its IPO at $33/share, raising over $1.2B with intense demand (reportedly 40× oversubscribed). The stock opened explosively around $85 and surged past $115 within hours—marking one of the strongest SaaS IPOs in recent memory.
This debut is powered by:
The failed $20B Adobe acquisition (2023), which boosted Figma’s independence and cash position via a ~$1B break-up fee.
Accelerated AI integration: new tools like Figma Make, Draw, and Buzz debuted at Config 2025, reinforcing its leadership in collaborative design.
A rebound in tech valuations and strong market timing for IPOs, with Figma now positioned as a bellwether for high-growth SaaS.
🔍 Technical View (15-min chart):
After the opening range breakout (0930–0945), price cleanly moved through the 0.618 and 1.00 Fibonacci levels. FIG is now hovering near 1.236 ($123.79) with next key extension at 1.382 ($128.48). Volume confirms sustained interest. A hold above $116 signals strength. Watch for:
Breakout continuation above $123.79 → $128.50
Retest of VWAP/Fib levels ($112–$109) for re-entry
Lock-up risk, but low near-term float = volatile upside
🎯 Thesis: This is institutional-grade price action backed by AI momentum, macro timing, and a clean technical base. Trade the trend, not the headline.
#FIG #IPO #AI #SaaS #Breakout #Fibonacci #VolanX #WaverVanir #TradingStrategy #MacroSignals
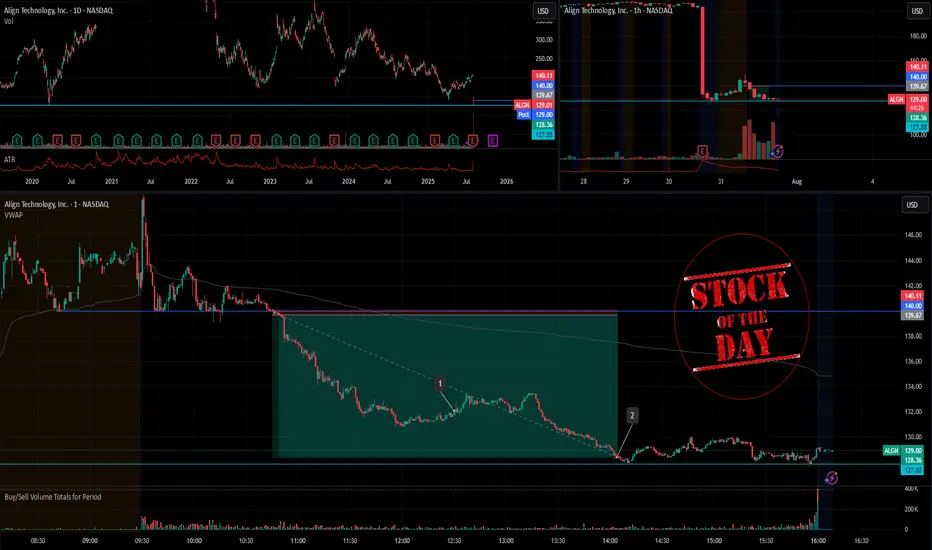
Stock Of The Day / 07.31.25 / ALGN07.31.2025 / NASDAQ:ALGN
Fundamentals. Suspected of possible violations of federal securities laws on the back of a negative earnings report.
Technical Analysis.
Daily Chart: Downtrend. Level 127.88 formed by the trend break in March 2020 is ahead.
Premarket: Gap down on increased volume. We mark the trend break level in the premarket at 140.0.
Trading Session: The price held the 140.0 level twice during the first hour after the opening of the trading session. Note the clear hold in the first case and the hold with false breakouts in the second. Also note that each subsequent pullback was smaller than the previous one. We are considering a short trade to continue the downward movement in case of the breakdown and hold of the 140.0 level.
Trading scenario: breakdown with retest (tightening with retest) of level 140.0
Entry: 139.67 after breakdown and hold the price below the level.
Stop: 140.11 we hide it above the tail of the retest candle.
Exit: We observe the strong downtrend. Cover the part of the position at 132.08 when the structure of the downtrend is broken (RR 1/17), after the downtrend resumes, hold the rest of the position until level 127.88 (1/25).
Risk Rewards: 1/21 (max. 1/25)
P.S. In order to understand the idea of the Stock Of The Day analysis, please read the following information .
Broke 4 year trend.Retesting and resetting.
May launch to 9, retest 9, if we break maybe we can hit 12 to 15.
Earnings is always a dice roll though...

XOM Short (-33%)XOM is likely to Sharp decline from $112, aligning with its target within the FVG zone and the leg of the Crab pattern.

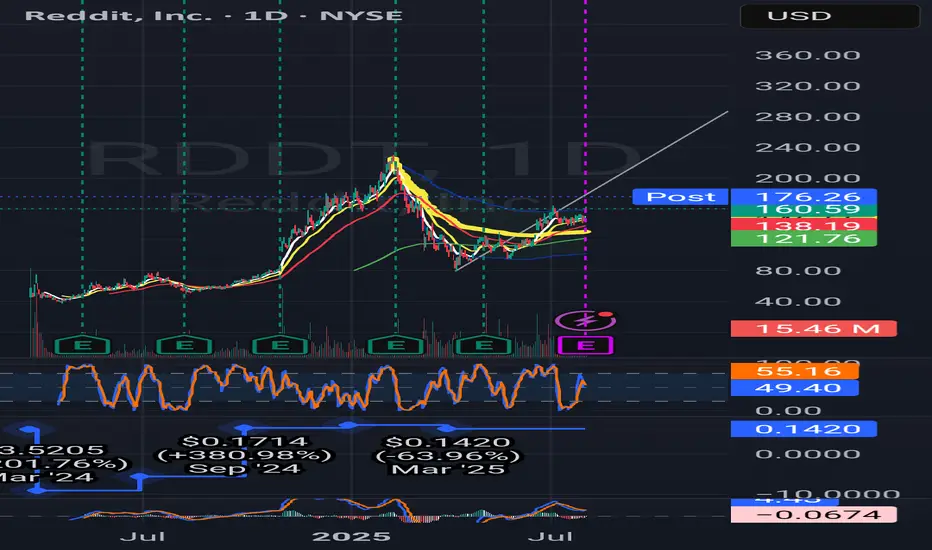
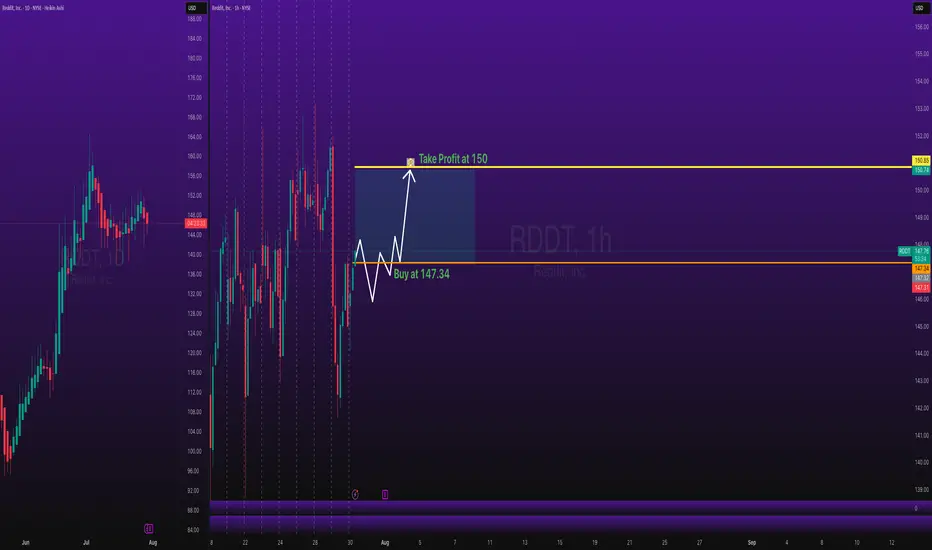
Stocks SPOT ACCOUNT: Reddit stocks BUT ENTRY with TAKE PROFITStocks SPOT ACCOUNT: NYSE:RDDT stocks my buy trade with take profit.
This is my SPOT Accounts for Stocks Portfolio.
Trade shows my Buying and Take Profit Level.
Spot account doesn't need SL because its stocks buying account.
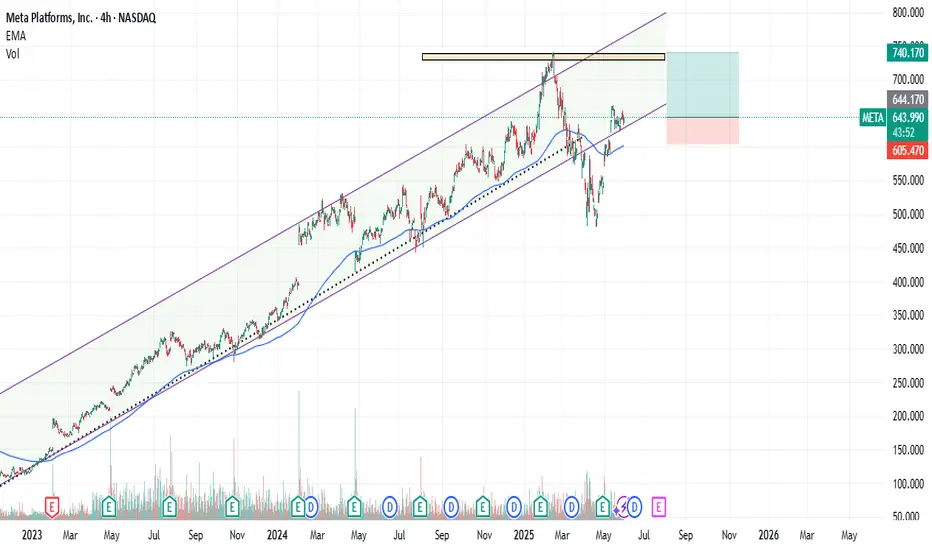
META : Old Peak can be TestedMeta platform has lost altitude from the channel it has formed since 2023, but has gained momentum and re-entered the channel. The possibility of testing the old peak contains a good RR rate.Of course, with a stop-loss close to the 200-period moving average.( Risk/Reward Ratio : 2.48)
Stop-Loss: 605.47
Target : 740.10
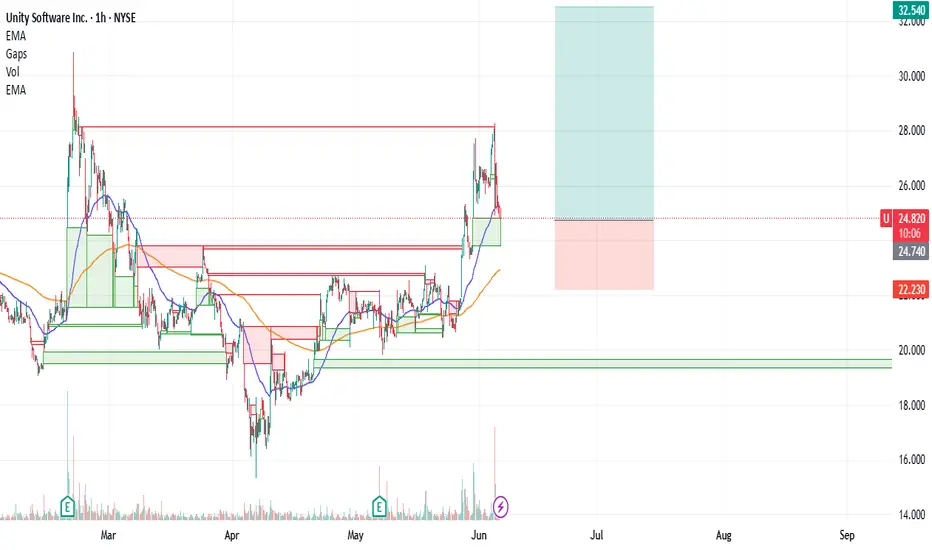
U : Long There were both good and bad developments for Unity.
While the joint project opportunity with BMW Group is very positive news,
Departure of the current CEO was negative news.
Technically, it is above the 50 and 200 period moving averages, and the 50 period ema is also above the 200 period ema.
A risk/reward ratio of 3.00 can be evaluated, with the Stop-Loss being close to the 200-period ema and the target price being targeted at the large gap closing value.(Small position size)
Entry : 24.76 - 24.81
Risk/Reward Ratio : 3.00
Stop-Loss : 22.23
Take Profit Level: 32.54
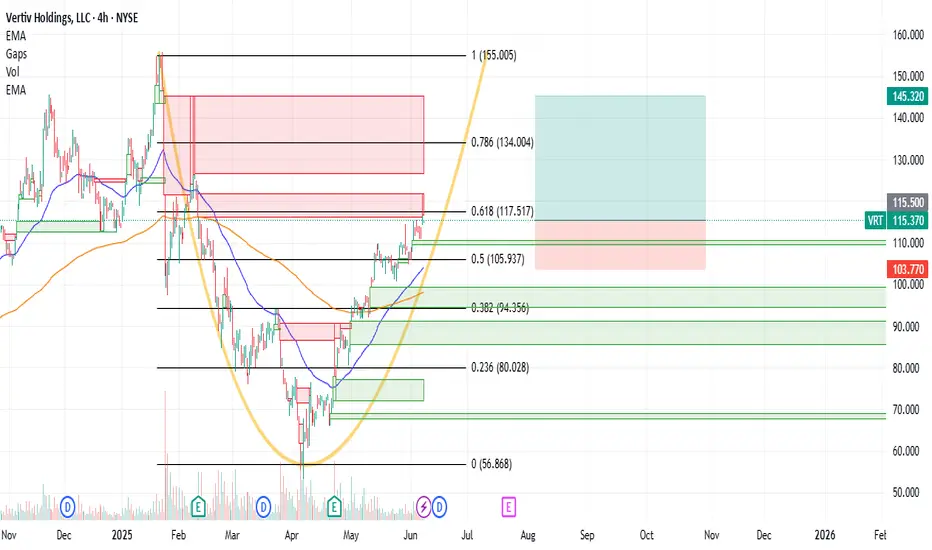
VRT : Long Position Vertiv Holdings is trading above the 50 and 200-period moving averages.
It has overcome the resistances one by one without being exposed to a very high IV.
It has started to draw a cup.
However, it is much better to focus on the big gap rather than the cup formation because with good chances it can encounter a big resistance there.
Targeting the 50-period ema and the 0.5 level of the short-term Fibonacci retracement levels as a stop point gives us the opportunity to try trading at a not bad risk/reward ratio.
With a small position size or small portfolio percent :
Risk/Reward Ratio : 2.54
Stop-Loss : 103.77
Take-Profit : 145.32
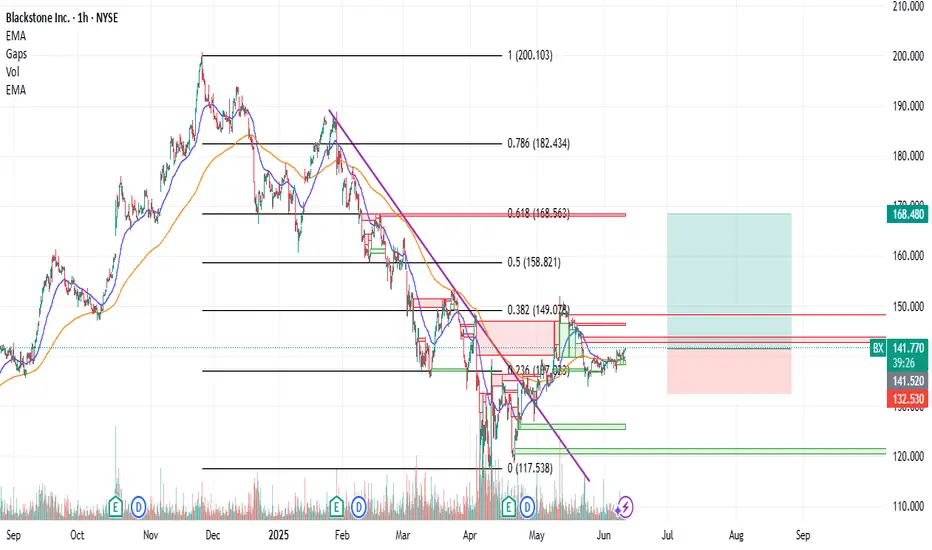
BX : First Attempt at Silent StockBlackstone has now decided to invest in Europe.
The stock is technically above the 50 and 200 period moving averages.
After leveling the trend line, an increase in volume was also observed.
In that case, holding a short-medium term or opening a long position with a reasonable risk/reward ratio in a small position size will not hurt us.
I have kept the stop-loss a little tighter now because even if the stop level comes in a sudden drop, it can be tried again. If that happens, I will share it as a new idea.
Risk/Reward Ratio : 3.00
Stop-Loss : 132.53
Take-Profit : 141.73
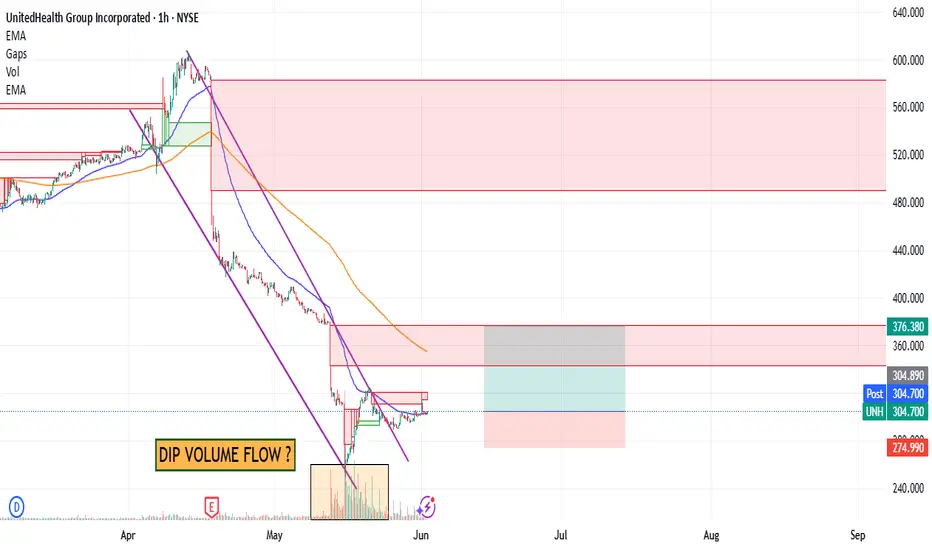
UNH : Are Bad Days Over ? (Cautious)UNH shares have moved above the 50-period moving average but are trading below the 200-period moving average.
For now, since the 200-period moving average is very high, a small trade can be tried by keeping the stop-loss level a little tight.
A few weak movements may pull the average down and the price may break the average.
Therefore, small position sizes are ideal.
NOTE : If we can maintain persistence on 376(Which will take a few days),
then we will look at the other gaps.
Risk/Reward Ratio : 2.39
Stop-Loss : 274.99
Take- Profit Level : 376.38
Regards.
APPL/METAHi every one
You should gradually sell Apple and buy Meta.
From now on, I will call this type of analysis inter-market analysis.

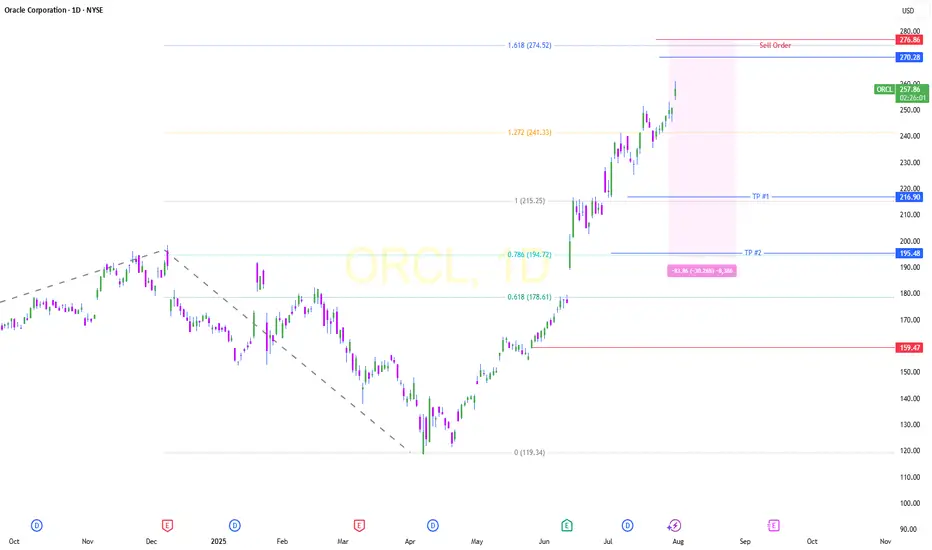
ORACLE ShortORCL might decline from $276 toward its target, as indicated by the Fibonacci extension tool.
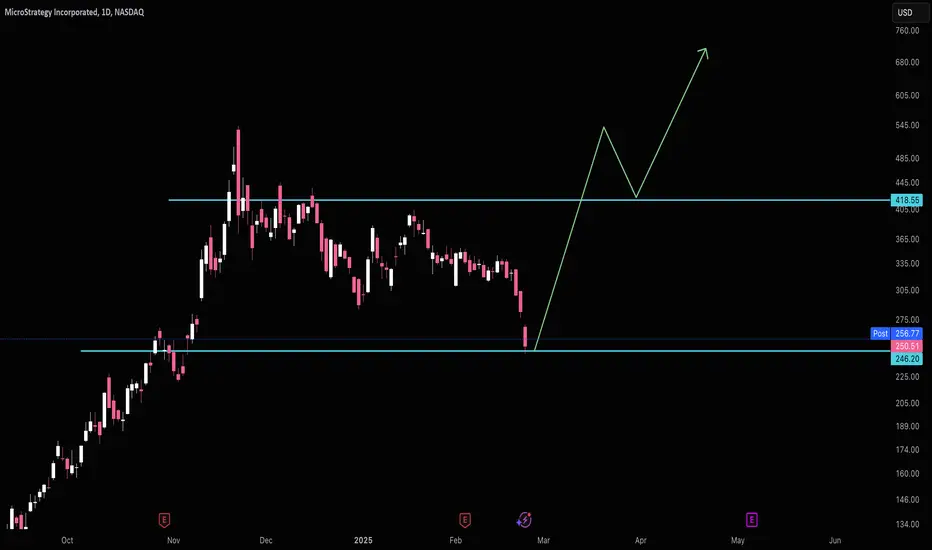
Strategy Hit SupportMSTR should easily hold $246 and make its way back up to $418 and form it's next support there.
Good luck!
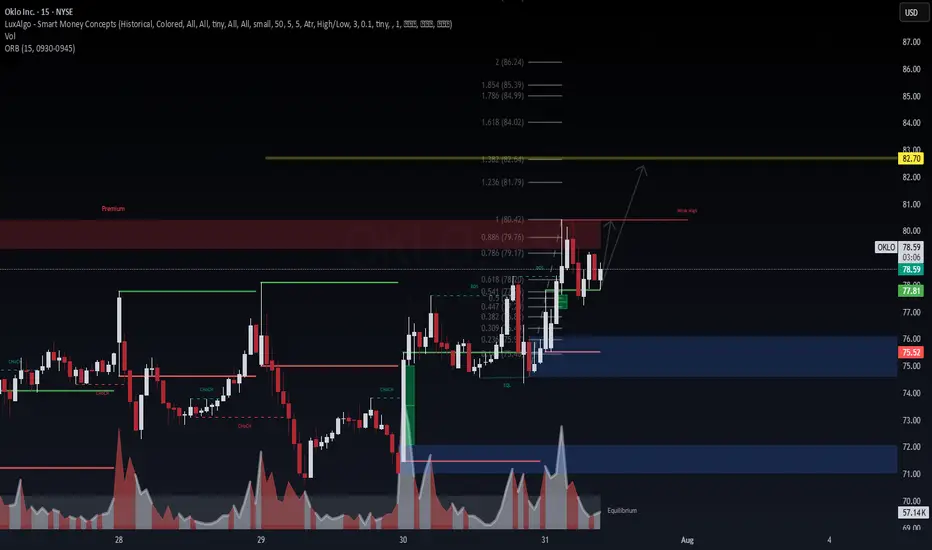
OKLO (NYSE: $OKLO) – 15M Liquidity Hunt & Expansion Path📈 OKLO (NYSE: NYSE:OKLO ) – 15M Liquidity Hunt & Expansion Path
Chart by WaverVanir International LLC | VolanX Protocol
We're observing clean SMC structure post-CHOCH (Change of Character) with strong demand defense off equilibrium. Price just reclaimed the ORB high (77.81) and is consolidating under a weak high near $80.42, inside a premium rejection block.
🧠 Institutional Narrative
CHoCH → BOS confirms bullish intent post-manipulation.
Volume spike on reclaim of fair value gap shows potential absorption and re-accumulation.
Fib confluence at 0.618 (78.20) with bullish rejection and internal liquidity grab.
🎯 Targets
Minor: 80.42 (weak high), expect sweep.
Primary: 82.70 (Fib 1.382 extension) aligns with prior premium inefficiency.
Aggressive: 84.99–86.24 (1.786–2.0 extension zone).
🛡️ Invalidation
Break below ORB low 75.52 would invalidate current bullish structure short term.
🧭 VolanX Signal
This aligns with a Liquidity Expansion Playbook inside the institutional price delivery model. Watching for continuation if $80.42 sweep holds with strength.
Disclaimer: For educational purposes only. Not financial advice. #VolanX #SMC #Trading #OKLO #Stocks #LiquidityHunt #MarketStructure #InstitutionalTrading