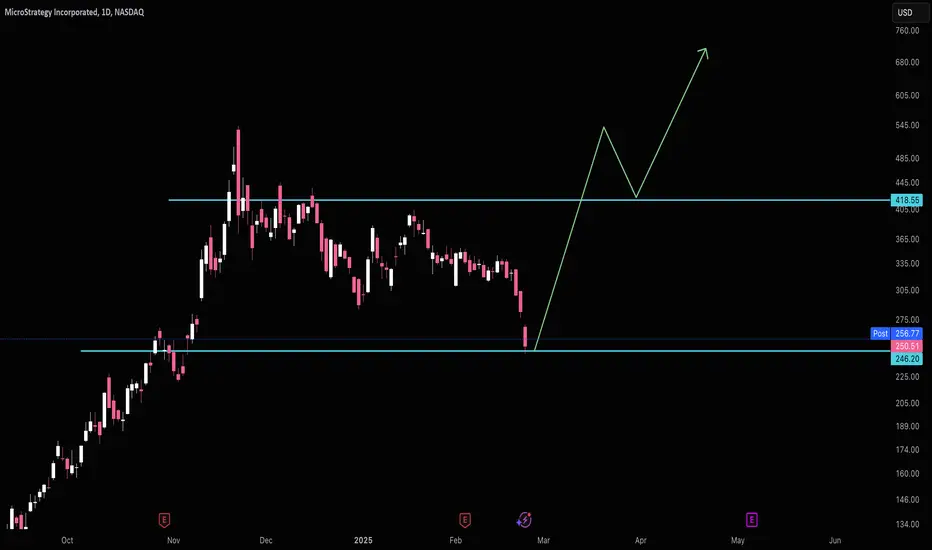
Strategy Hit SupportMSTR should easily hold $246 and make its way back up to $418 and form it's next support there.
Good luck!
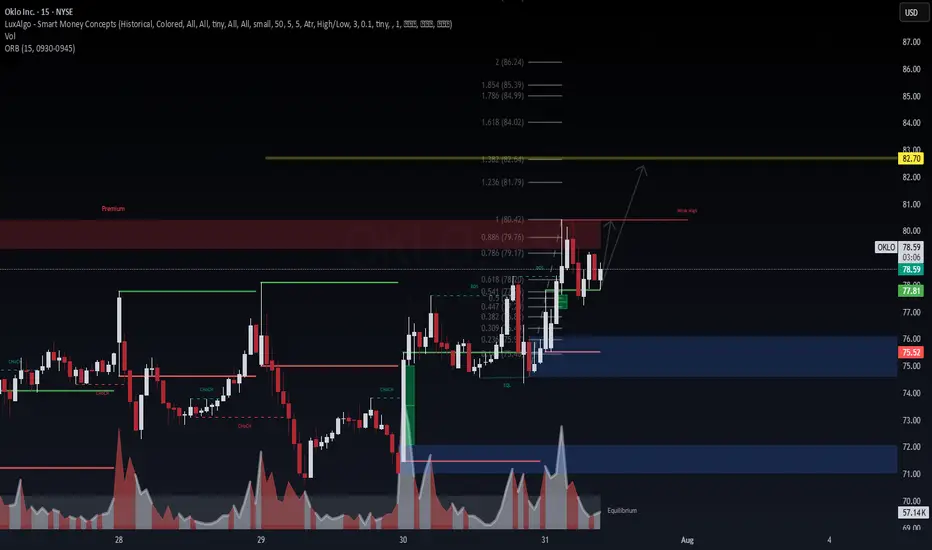
OKLO (NYSE: $OKLO) – 15M Liquidity Hunt & Expansion Path📈 OKLO (NYSE: NYSE:OKLO ) – 15M Liquidity Hunt & Expansion Path
Chart by WaverVanir International LLC | VolanX Protocol
We're observing clean SMC structure post-CHOCH (Change of Character) with strong demand defense off equilibrium. Price just reclaimed the ORB high (77.81) and is consolidating under a weak high near $80.42, inside a premium rejection block.
🧠 Institutional Narrative
CHoCH → BOS confirms bullish intent post-manipulation.
Volume spike on reclaim of fair value gap shows potential absorption and re-accumulation.
Fib confluence at 0.618 (78.20) with bullish rejection and internal liquidity grab.
🎯 Targets
Minor: 80.42 (weak high), expect sweep.
Primary: 82.70 (Fib 1.382 extension) aligns with prior premium inefficiency.
Aggressive: 84.99–86.24 (1.786–2.0 extension zone).
🛡️ Invalidation
Break below ORB low 75.52 would invalidate current bullish structure short term.
🧭 VolanX Signal
This aligns with a Liquidity Expansion Playbook inside the institutional price delivery model. Watching for continuation if $80.42 sweep holds with strength.
Disclaimer: For educational purposes only. Not financial advice. #VolanX #SMC #Trading #OKLO #Stocks #LiquidityHunt #MarketStructure #InstitutionalTrading
HOOD WEEKLY OPTIONS TRADE (7/31/25)
### ⚡️HOOD WEEKLY OPTIONS TRADE (7/31/25)
📈 **Setup Summary**
→ Weekly RSI: ✅ Rising
→ Daily RSI: ❌ Falling (⚠️ Short-term pullback risk)
→ Call/Put Ratio: 🔥 **1.89** (Bullish flow)
→ Volume: 📉 Weak — fading conviction
→ Gamma Risk: 🔥 High (1DTE)
---
💥 **TRADE IDEA**
🟢 Direction: **CALL**
🎯 Strike: **\$110.00**
💰 Entry: **\$0.82**
🚀 Target: **\$1.62** (+100%)
🛑 Stop: **\$0.41**
📆 Expiry: **Aug 1 (1DTE)**
🎯 Entry: Market Open
📊 Confidence: **65%**
---
🧠 **Quick Insight:**
Mixed signals = *Scalper’s Playground*
✅ Weekly trend favors upside
⚠️ Weak volume & daily RSI divergence = TRADE LIGHT
---
📌 Posted: 2025-07-31 @ 11:53 AM ET
\#HOOD #OptionsTrading #WeeklyPlay #GammaScalp #TradingViewViral #HighRiskHighReward

ALAB WEEKLY TRADE IDEA (2025-07-31)
### 🚨 ALAB WEEKLY TRADE IDEA (2025-07-31)
🧠 **Smart Money Snapshot**
→ RSI: **76+** = Strong Momentum
→ Call/Put Ratio: **2.19** = Bullish Bias
→ Volume: 📉 **0.6x last week** = Momentum may fade
→ Gamma Risk: ⚠️ High = Expect **fireworks**
---
📈 **TRADE SETUP**
💥 Ticker: **\ NASDAQ:ALAB **
🟢 Strategy: **Buy Call**
🎯 Strike: **\$149.00**
💰 Entry: **\$0.65**
🎯 Target: **\$0.97** (50%+)
🛑 Stop: **\$0.39**
📆 Expiry: **Aug 1 (1DTE)**
📊 Confidence: **75%**
---
⚠️ **Risk Note:**
1DTE = 💣 High gamma = **big reward / big risk**
🧯 Size small. Exit fast. Ride momentum.
---
📌 Trade posted: **2025-07-31 @ 10:58 AM ET**
\#ALAB #OptionsTrading #WeeklyPlay #GammaSqueeze #MomentumTrade #TradingViewViral

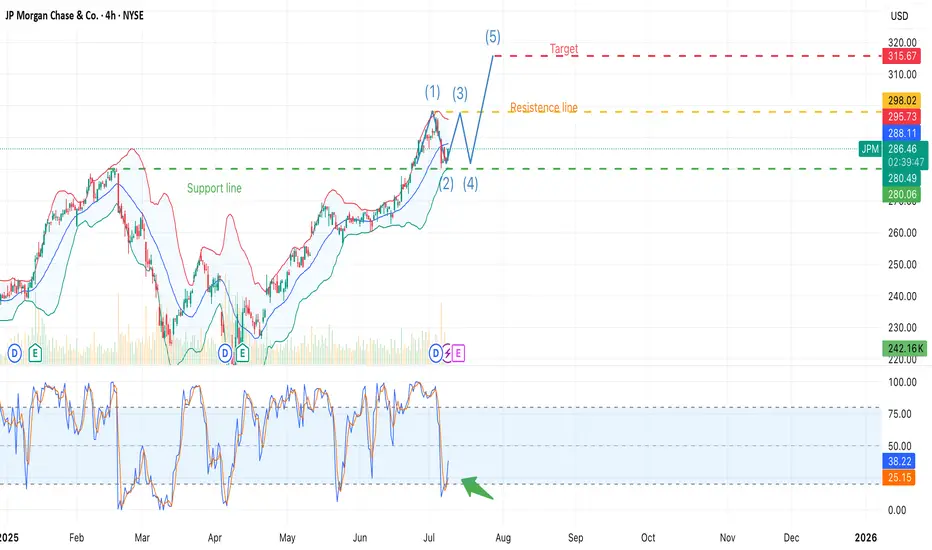
JPM + $500B Capital Forecast + Banks to Profit from Tar NYSE:JPM , 4H chart
ALVO13 Insight: A strong mix of technical structure and positive fundamentals.Technical Setup (Elliott Waves):
The chart suggests a potential start of wave (5) after a completed correction (4).
Stochastic is in the oversold zone, and $280 support is holding — a key signal for a possible reversal.
Key Levels:
• Support: $280.00–280.47
• Resistance: $295.73–298.02
• Target (Wave 5): $315.67
Fundamental Factors:
JPMorgan forecasts up to $500B in new equity inflows from retail and institutional investors during H2 2025. This could lift the market, especially financials.
Banks are likely to benefit from upcoming trade tariffs — via increased demand for hedging, transaction fees, and advisory services.
PM remains one of the most solid U.S. banks, with strong dividend policies and excellent return on equity (ROE).
ALVO13 Trade Idea:
• Entry: $282–286 (confirmation-based)
• Stop-loss: below $280
• Take-profit: $315+
• Risk/Reward: 3:1
Break below $280 invalidates the bullish wave 5 scenario.
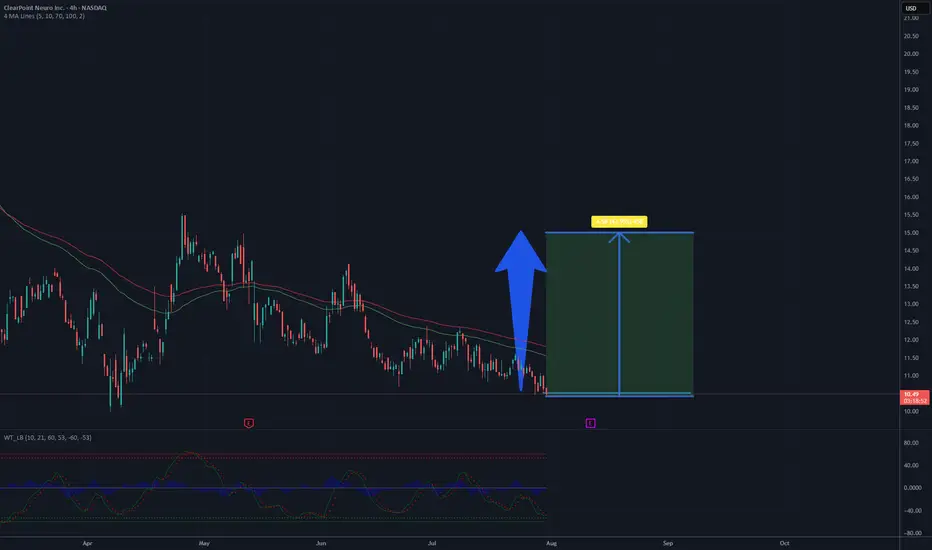
Is a time for CLPT? Around 50% profit - 15 USD targetThe chart depicts a 4-hour candlestick pattern for ClearPoint Neuro Inc. (CLPT) on NASDAQ, covering late 2024 to mid-2025. The stock has recently declined from a peak near 10.7 USD, with the price currently around 10.07 USD as of July 31, 2025. The moving averages (red and green lines) show a bearish crossover, indicating short-term downward momentum, but the price is close to a support level around 10 USD. The oscillator at the bottom suggests oversold conditions with a slight upward bounce, hinting at potential reversal. If buying volume increases and the support holds, a recovery to 15 USD appears feasible in the coming weeks, supported by historical resistance levels near that mark.
The continued expansion of clinical sites globally and the commercialization of the ClearPoint PRISM Neuro Laser Therapy System may broaden the company’s market reach, potentially boosting sales and partnerships in the neurosurgery and gene therapy sectors.
Mara Push higher expectationWith recent outstanding earning report MARA is a undervalue bitcoin mining play offering better risk and Elliott wave count on wave 4 completion looking for wave 5 push up. anytime to see a green reversal day and further movements above the current redline, the hold can last over 1 to 2 weeks. the upmove can last over 27 days. looking over the trendwave. so it's better to seek 60 days options contract

APP Earnings Triangle BreakoutWith APP breaking key resistance to the upside. There is a possibility for an aggressive move to the upside. This will NOT be a straight line up, but does show the possibility of the measured move. If I were to enter this, todays candle would be my entry and my stop loss would be an aggressive close back under the trendline.
Let's see what happens.

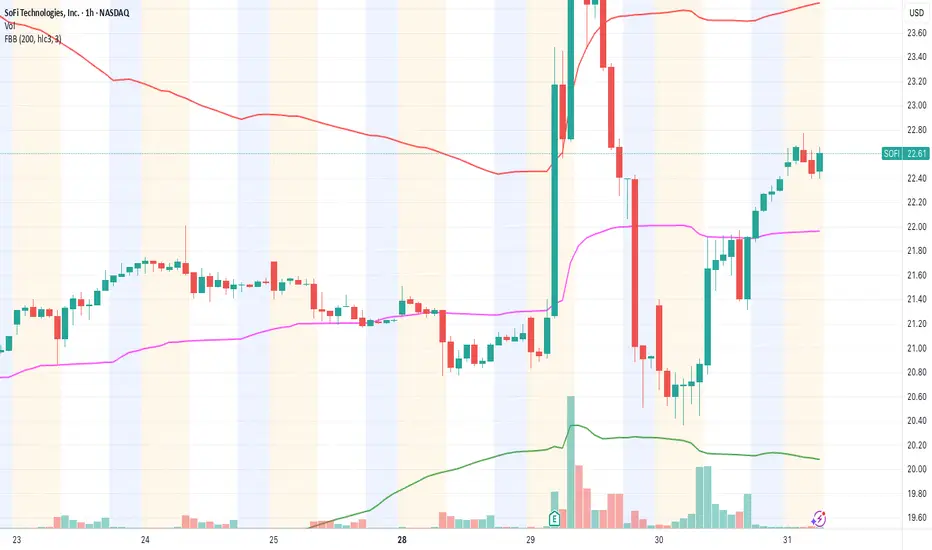
SOFI meets 25 out of 28 technical & fundamental criteria – SwingEntered at $22.55 after full validation through our 28-criteria system.
✅ Strong earnings (positive revenue growth & stable forward guidance)
✅ Dilution concerns cleared (no new share offering)
✅ Breakout confirmed above VWAP with clean pullback
✅ Accelerated momentum and rising premarket volume
✅ Healthy RSI (no overbought in 4h or daily chart)
✅ No major resistance until the $24.90–$25.20 zone
📍Key Levels:
🎯 Entry: $22.55
🛑 Stop Loss: $21.80
🎯 Target: $25.00
⏳ Expected duration: 1–2 days (swing)
🔁 Risk/Reward: 2.5:1
Fibonacci insight:
Price respected the 38.2% level during the pullback. The 161.8% extension points right to the $25 zone.
📊 Context:
Fintech sector is gaining strength, and SOFI is leading with strong fundamentals and bullish momentum.
If we open above $22.50 with strong volume, I expect a bullish continuation.
I'm tracking every trade as part of a new system currently under test.
If you want to follow this signal to the end, feel free to follow along. ✌️
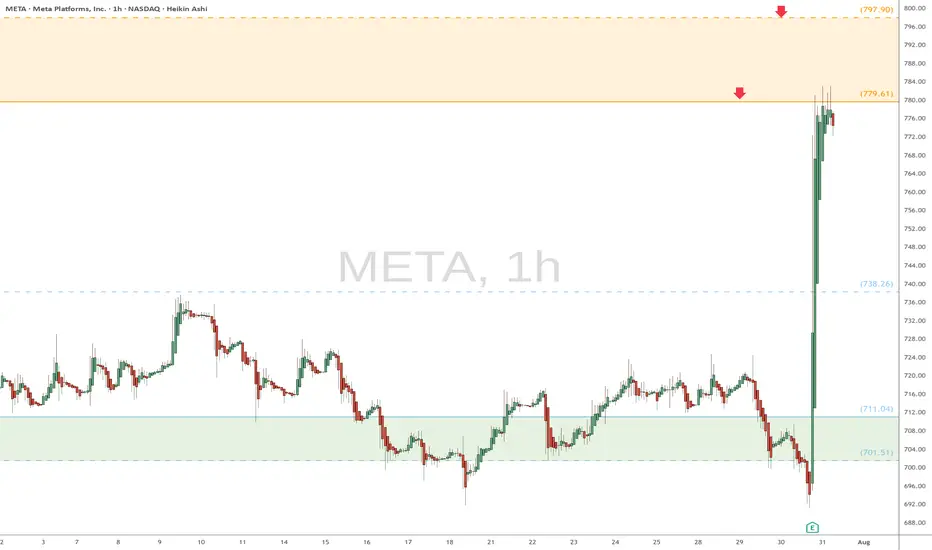
META watch $779 then 798: Dual Golden fib barrier to 800 round META earnings blew away the analyst expectations.
Surged into dual Golden fibs at $779.61 then 797.90
This "high gravity" zone will likely hold price for a bit.
.
See "Recent Publications" for previous charts ------------>>>>>>>>>
Such as this one that caught an HUGE BREAKOUT
Hit BOOST and FOLLOW for more such PRECISE and TIMELY charts.
=========================================================
.
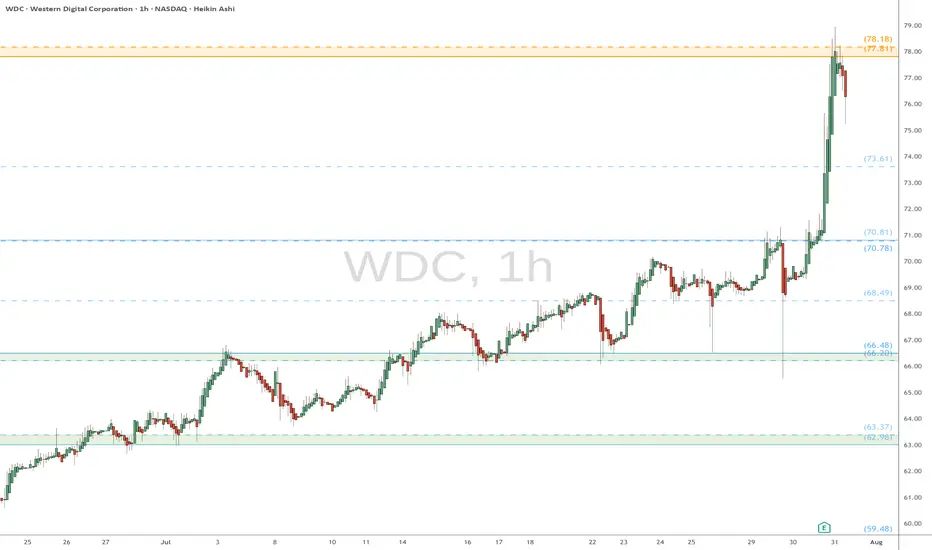
WDC eyes on $78: Double Golden fib zone should slow the surge WDC earnings report caused a break out from consolidation.
Price spiked into a Double Golden fib zone at $77.81-78.18
This "very high gravity" confluence should hold price for a bit.
Previous analysis that caught HUGE BREAKOUT
Hit BOOST and FOLLOW for more such PRECISE and TIMELY charts.
=========================================================
.
$SGD Interesting hourly trendNASDAQ:SGD Interesting hourly trend holding up. Following for a bounce off of trend support to scalp towards trend resistance / previous high.

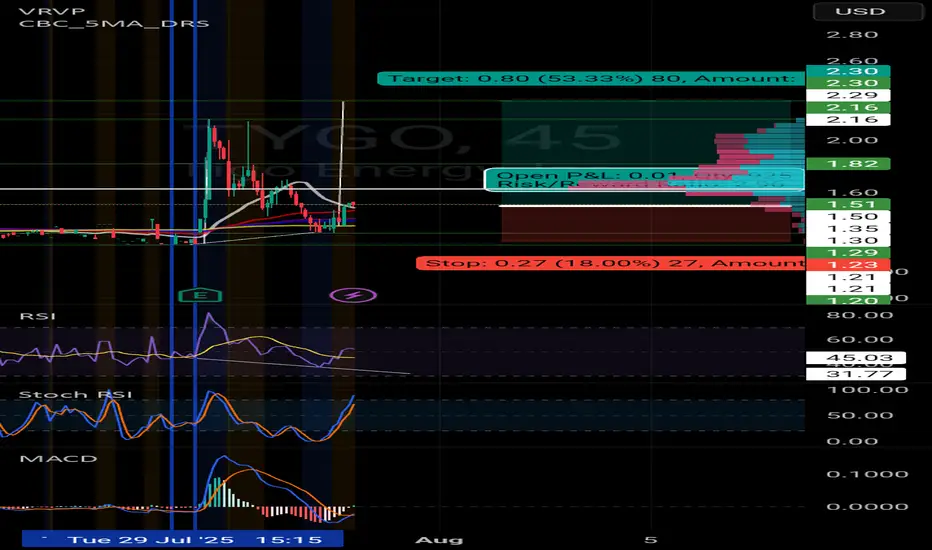
TygoPotential 50% gains coming for Tygo
Falling wedge on this 1hr time frame
I see stochastics, macd, Rsi all in favor .
Let's see if the bullish trend can continue.
Sling shot above trendline If we go above the yellow resistance with good volume, potential target prices are indicated. Practice safe stop loss (-10%) in these speculative moves.

FIG IPO: Is it Worth the Hype?IPO Highlights
IPO pricing & volume
-Figma priced its IPO at $33 per share on July 30, 2025 (above its revised range of $30–32 and the initial $25–28 range—raising over $1.2 billion by selling approximately 36.94 million shares.
Valuation
-This pricing placed its valuation at around $19–19.5 billion fully diluted, close to the US $20 billion Adobe had once offered in a failed acquisition attempt.
Financial Profile & Business Strengths
Revenue and profitability
-Figma posted US $749 million in revenue for 2024 (up 48% YoY), and revenue in Q1 2025 grew by 46% to $228.2 million. It also delivered $44.9 million in net income during Q1 2025, signaling improved profitability after a net loss the prior year (inflated by a one‑time $1 billion breakup fee from Adobe).
Customer base & margins
-The company boasts 13 million monthly active users and covers 95% of Fortune 500 companies, with strong 91% gross margins and approximately 18% operating margins.
Cryptocurrency holdings
-Figma holds $69.5 million in a Bitcoin ETF and $30 million in USD Coin, planning to reinvest these into Bitcoin, a strategy similar to that of MicroStrategy.
Strategic & Market Implications
Signal for IPO revival
-Figma is the largest enterprise-software IPO since 2021 and is seen as a potential catalyst for a broader IPO rebound, potentially opening the floodgates for other companies such as Canva, Databricks, and more.
Market perception & analyst viewpoints
-Analysts, including Gil Luria at D.A. Davidson, view Figma as well-positioned in the AI/design space. Others caution that rising usage of generative AI could disrupt future margins, creating both potential and uncertainty.
Competitive landscape
-The IPO sets the stage for Figma to directly compete with Adobe. Despite Adobe’s recent stock decline, analysts expect both companies to potentially thrive given growing demand for creative tools.
-Disclaimer: This analysis is for informational and educational purposes only and does not constitute financial advice, investment recommendation, or an offer to buy or sell any securities. Stock prices, valuations, and performance metrics are subject to change and may be outdated. Always conduct your own due diligence and consult with a licensed financial advisor before making investment decisions. The information presented may contain inaccuracies and should not be solely relied upon for financial decisions. I am not personally liable for your own losses, this is not financial advise.

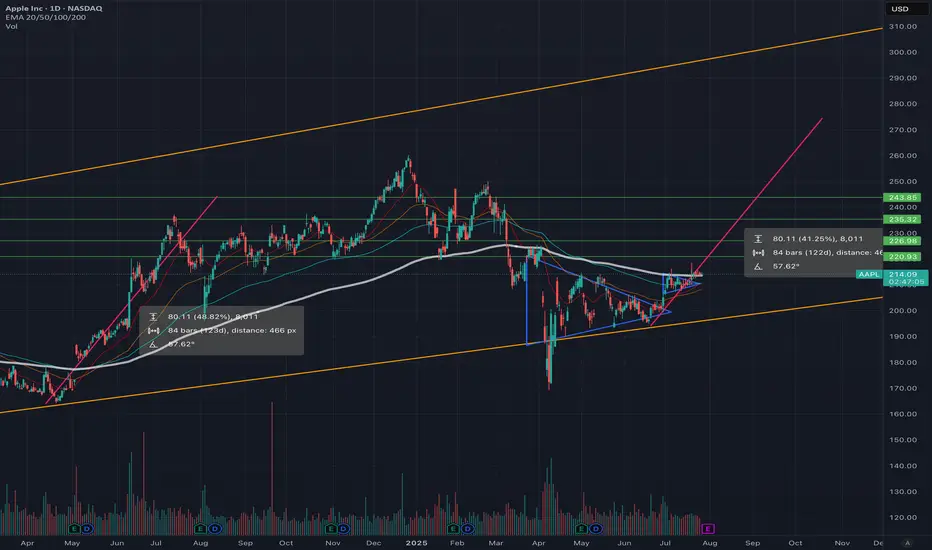
Time to buy? Too much negative press. Buy in Fear- Updated 28/7Apple has been making steady gains since April 8th. Trading volume has been consistently strong, increasing intermittently, with sell pressure exhausted at the 200 USD mark. The price point is now sitting above the 200 daily EMA support, which indicates strong potential for continued upward movement. Apple's earnings are in focus this week, with predictions that they will exceed expectations, but the extent of that exceedance is the question.
Regardless of the competition from Chinese-made phones or Samsung, once you are in the Apple ecosystem, it is rare to leave. Even if buying cycles slow down, Apple often provides innovative solutions to problems that no other provider can. The focus on Apple regarding AI appears slightly biased and carries some elements of fear, uncertainty, and doubt (FUD). It would be foolish to bet against Apple in the long term, even if the necessary technology is obtained through acquisition. With a strong cash position, this should not be an obstacle.
So far, the charts have shown us two positive moves after flag patterns, with resistance just below and around the EMA 200 level, which is now acting as support. The RSI is in the upper regions but is far from overbought, indicating we have a good level of momentum. The accumulation distribution chart also suggests strong support for Apple from institutions. No clear pattern is yet forming on the charts, except for a possible ascending triangle on the weekly, which would be very bullish.
The 50-day EMA is likely to cross the 200 EMA in mid-August, drawing a lot of attention as this would create a Golden Cross. This event would occur just prior to the Apple launch in September, which is rumored to introduce significant updates and advancements. Considering all these factors, I anticipate that Apple will continue its upward momentum for the next six weeks, with some substantial moves followed by pullbacks to support levels. The launch events will likely propel Apple to reach an all-time high (ATH). NFA
Target price is >260
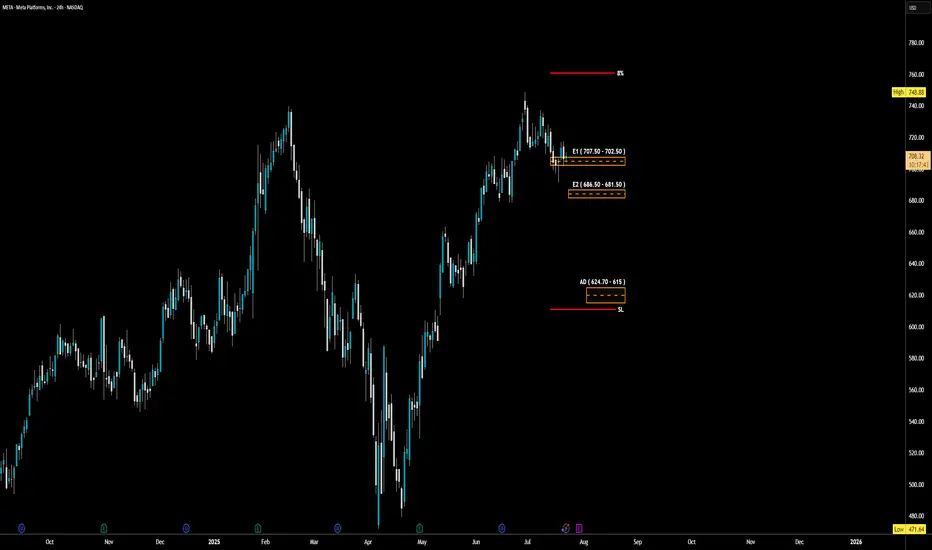
META - LONG Swing Entry PlanNASDAQ:META - LONG Swing Entry Plan
Entry Zone 1: $707.50 – $702.50
→ Open initial position targeting +8% from entry level.
Entry Zone 2: $686.50 – $681.50
→ If price dips further, average down with a second equal-sized entry.
→ New target becomes +8% from the average of Entry 1 and Entry 2.
Edit Zone (Aggressive Demand): $624.70 – $615.00
→ If reached, enter with double the initial size to lower the overall cost basis.
→ Profit target remains +8% from the new average across all three entries.
Risk Management:
Stop Loss:
Risk is capped at 12% below the average entry price (calculated across all executed positions including the Edit Zone).
Position Sizing Approach:
Entry 1: 1x
Entry 2: 1x
Edit Zone: 2x
→ Total exposure: 4x
→ Weighted average determines final TP and SL calculations.
______________________________________
Legal Disclaimer
The information provided in this content is intended for educational and informational purposes only and does not constitute financial, investment, or legal advice or recommendations of any kind. The provider of this content assumes no legal or financial responsibility for any investment decisions made based on this information. Users are strongly advised to conduct their own due diligence and consult with licensed financial advisors before making any financial or investment decisions.
Sharia Compliance Disclaimer: The provider makes no guarantees that the stocks or financial instruments mentioned herein comply with Islamic (Sharia) principles. It is the user’s responsibility to verify Sharia compliance, and consultation with a qualified Sharia advisor is strongly recommended before making any investment decisions
THIRD TIME IS A CHARM (SUPPORT BREAK OR FURTHER ADVANCE)Price action has been holding the one year support line from July 2024 until now. A break will see GameStop price declining further to the old support at 10.00 USD. However, price is favourably expected to rise further to test the 47.00 USD and an extension to the old high if this support holds.
Set tight stop-loss below support line.
Use reasonable margin as per account size.
Trade safe

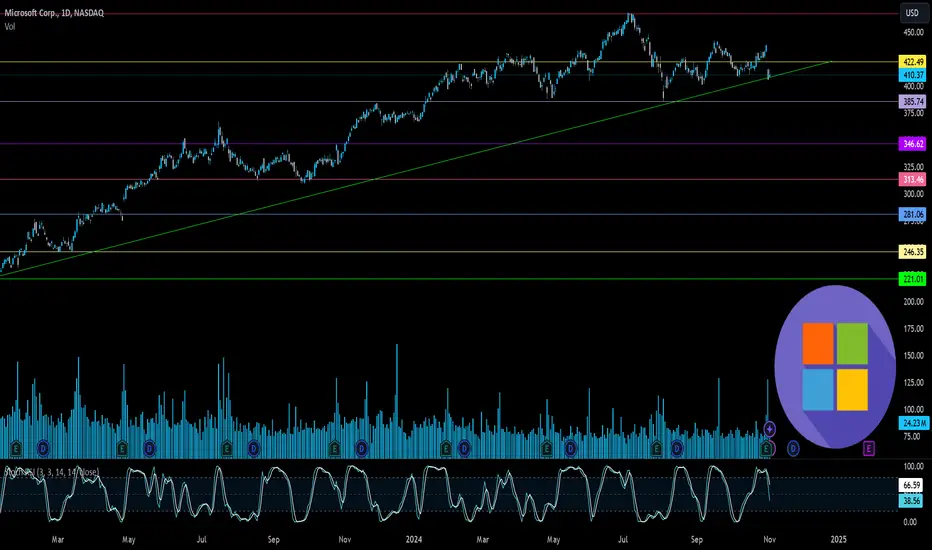
Microsoft’s Big Moves This Quarter | From Activision to AI AgentMicrosoft’s Revenue Surge: The Power of AI, Gaming, and Strategic Investments
Microsoft has released its Q1 FY25 earnings for the quarter ending in September
The stock saw a 6% drop, indicating the results fell short of investors' high hopes. Trading at over 30 times projected earnings for next year, expectations for Microsoft were significant.
CEO Satya Nadella stated
“Our AI business is set to exceed an annual revenue run rate of $10 billion next quarter, making it the fastest business in our history to reach this milestone.”
This means that AI will soon account for about 4% of Microsoft's total revenue in under three years a remarkable feat for a global giant.
If you need a quick summary, here are three main points:
1. ☁️ Azure’s growth is slowing. As Microsoft’s key player in the AI competition, Azure grew 34%, down slightly from 35% in the prior quarter (after adjustments). This comes as Google Cloud raised the bar, with its growth accelerating from 29% to 35% during the same period.
2. 🤖 AI growth is limited by hardware supply, as capacity struggles to meet demand. Data center expansion is a long-term process, and Microsoft is investing heavily in infrastructure, aiming for a growth boost by 2025.
3. 👨👩👧👦 Consumer-focused products like Gaming and Devices are underperforming. Although not essential to Microsoft's core business, their poor performance has impacted overall results.
Here’s a breakdown of the insights from the quarter.
Overview of today’s insights:
- New segmentation.
- Microsoft’s Q1 FY25 overview.
- Key earnings call highlights.
- Future areas to monitor.
1. New Segmentation
Revised Business Segments
In August, Microsoft announced a reorganization of its business segments, effective this quarter. The purpose? To better align financial reporting with the current business structure and strategic management.
Summary of the main changes
- Microsoft 365 Commercial revenue consolidation: All M365 commercial revenue, including mobility and security services, now falls under the Productivity and Business Processes segment.
-Copilot Pro revenue shift: Revenue from the Copilot Pro tool was moved from Productivity and Business Processes to the More Personal Computing segment under Search and news advertising.
-Nuance Enterprise reallocation: Revenue from Nuance, previously part of Intelligent Cloud, is now included in Productivity and Business Processes.
-Windows and Devices reporting combination: Microsoft now reports Windows and Devices revenue together.
Impact of These Changes:
Core Segments Overview:
In summary:
- The Productivity and Business Processes segment has grown significantly.
- The Intelligent Cloud segment has decreased due to the reallocation of Nuance and other revenue.
Products and Services Overview:
- M365 Commercial now includes Nuance, shifted from the Server products category, along with integrated mobility and security services.
- Windows & Devices have been merged into a single, slower-growth category.
Additional Insights:
- Azure, Microsoft's cloud platform, is reported within 'Server products and cloud services.' Although its growth rate is shared by management, exact revenue figures remain undisclosed.
Azure’s past growth figures have been adjusted for consistency, with the last quarter’s constant currency growth recast from 30% to 35%, setting a higher benchmark. Tracking these metrics is challenging due to limited revenue disclosure, but this recast indicates Azure's raised growth expectations.
2. Microsoft’s Q1 FY25 Performance
Financial Summary:
-Revenue: Up 16% year-over-year, reaching $65.6 billion (exceeding estimates by $1 billion). Post-Activision Blizzard acquisition in October 2023, the growth was 13% excluding the merger.
New Product and Services Segmentation Results
- Server products & cloud services: $22.2 billion (+23% Y/Y).
- M365 Commercial: $20.4 billion (+13% Y/Y).
- Gaming: $5.6 billion (+43% Y/Y), influenced by Activision.
- Windows & Devices: $4.3 billion (flat Y/Y).
- LinkedIn: $4.3 billion (+10% Y/Y).
- Search & news advertising: $3.2 billion (+7% Y/Y).
- Enterprise & partner services: $1.9 billion (flat Y/Y).
- Dynamics: $1.8 billion (+14% Y/Y).
- M365 Consumer products: $1.7 billion (+5% Y/Y).
Core Business Segments Breakdown:
- Productivity and Business Processes: Increased 12% Y/Y to $28.3 billion, supported by M365 Commercial, especially Copilot adoption.
- Intelligent Cloud: Grew 20% Y/Y to $24.1 billion, with Azure AI driving growth.
- More Personal Computing: Grew 17% Y/Y to $13.2 billion, including a 15-point boost from Activision. Devices fell, but search and ad performance improved under new segmentation.
Key Observations:
- Microsoft Cloud revenue climbed 22% Y/Y to $39 billion, making up 59% of total revenue (+3 percentage points Y/Y).
- Azure continues to drive cloud services and server products' growth.
- Xbox growth has surged due to the Activision acquisition since Q2 FY24, expected to stabilize by Q2 FY25.
- Windows OEM and devices combined, showing a 2% decline in Q1 FY25.
- Office rebranded to Microsoft 365; updated naming will be used starting next quarter.
- Margins: Gross margin at 69% (down 2pp Y/Y, 1pp Q/Q); operating margin at 47% (down 1pp Y/Y, up 4pp Q/Q).
- EPS: Increased 10% to $3.30, beating by $0.19.
Cash Flow and Balance Sheet:
- Operating cash flow: $34 billion (52% margin, down 2pp Y/Y).
- Cash**: $78 billion; Long-term debt**: $43 billion.
Q2 FY25 Outlook:
- Productivity and Business Processes: Anticipated 10%-11% Y/Y growth, steady due to M365, Copilot inclusion, and expected LinkedIn growth of ~10%. Dynamics set to grow mid-to-high teens.
- Intelligent Cloud: Projected 18%-20% Y/Y growth, slightly slowing, with Azure growth expected between 28%-29%.
- More Personal Computing: Forecasted ~$14 billion revenue, declines in Windows, Devices, and Gaming anticipated, with some offset from Copilot Pro.
Main Takeaways:
- Azure's growth slowed to 34% Y/Y in constant currency, with AI services contributing 12pp, up from 11pp last quarter. This marks a dip from the recast 35% prior and included an accounting boost.
- Capacity limitations in AI persist; more infrastructure investments are planned, with reacceleration expected in H2 FY25.
- Commercial performance obligations grew 21% to $259 billion, up from 20% in Q4.
- Margins were pressured by AI infrastructure investments; Activision reduced the operating margin by 2 points.
- Capital expenditures increased by 50% to $15 billion, half dedicated to infrastructure, with further Capex growth expected.
- Shareholder returns included $9.0 billion through buybacks and dividends, matching Q4 repurchases.
Earnings Call Highlights:
Azure AI saw a doubling of usage over six months, positioning it as a foundation for services like Cosmos DB and SQL DB. Microsoft Fabric adoption grew 14% sequentially, signaling rapid uptake.
AI Expansion: GitHub Copilot enterprise use surged 55% Q/Q, with AI-powered capabilities used by nearly 600,000 organizations, a 4x increase Y/Y.
M365 Copilot has achieved a 70% adoption rate among Fortune 500 companies and continues to grow rapidly.
LinkedIn saw accelerated growth in markets like India and Brazil and a 6x quarterly increase in video views, aligning with broader social media trends.
Search and Gaming: Bing’s revenue growth surpassed the market, while Game Pass hit a new revenue record, propelled by Black Ops 6
Capital Expenditures: CFO Amy Hood highlighted that half of cloud and AI investments are for long-term infrastructure, positioning the company for sustained growth.
4. Future Outlook
Energy Needs: Microsoft, facing higher power demands, plans to revive a reactor at Three Mile Island with Constellation Energy by 2028 to power its AI data centers sustainably.
Autonomous AI Agents: Coming in November, these agents will perform tasks with minimal human input, enhancing efficiency. Copilot Studio will allow businesses to customize these agents, with 10 pre-built options to start.
Industry Impact: Salesforce has launched Agentforce, signaling increased competition. CEO Mark Benioff recently compared Microsoft’s Copilot to the nostalgic Clippy, stoking rivalry.
For further analysis stay tuned
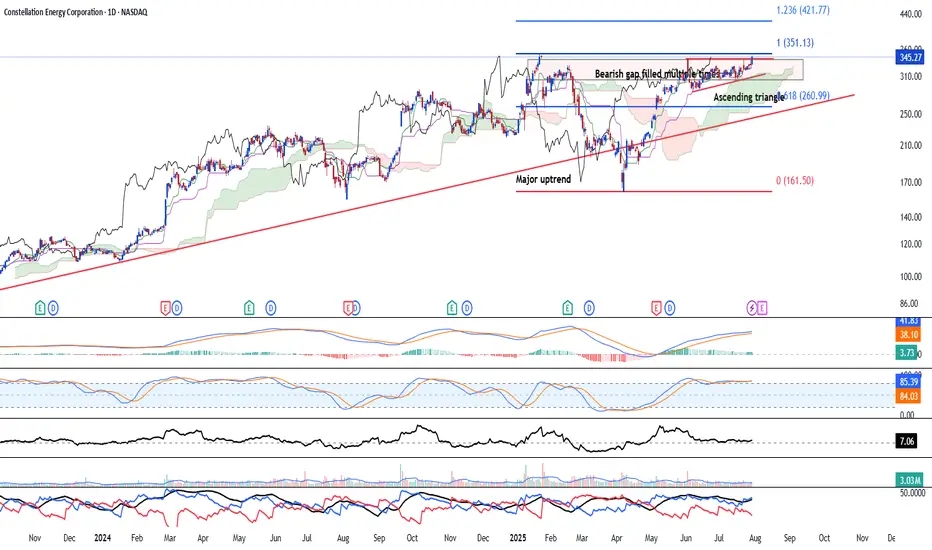
Upside break likelyNASDAQ:CEG Constellation Energy Corp (US: CEG) is likely to break above after the bearish gap has been filled multiple times and closes higher. Ascending triangle formation is likely to see bullish continuation to the upside and major uptrend remain intact since its inception. Volume remain healthy.
Long-term MACD shows steady state of bullish momentum.
Despite showing overbought by our mid-term stochastic oscillator, the stock has yet to see adverse correction and bullish pressure remain healthy.
23-period ROC declines but maintain a positive value and Directional movement index shows strong bullish strength.
Strategy
Buy spot @ 345.27 . Buy limit @ 311.65 in the event of a correction..
1st Target is at 420.00 (Est 1 month)
2nd Target is at 780.00 (6 months and beyond)
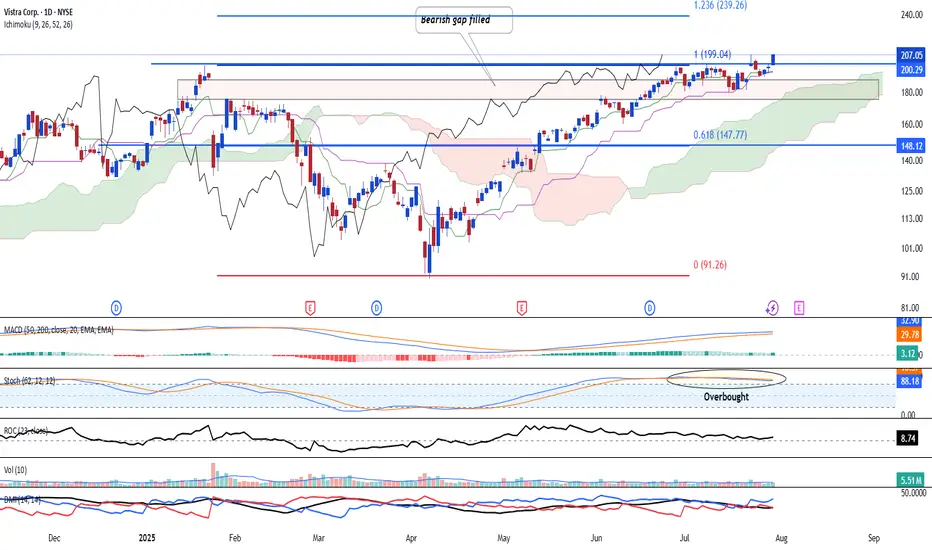
Vistra Corp - Uptrend intactVistra NYSE:VST has shown a steady uptrend being intact and is likely to continue higher after prices closes above the bearish gap and made a new high. Volume remain healthy.
Long-term MACD shows steady state of bullish momentum.
Despite showing overbought by our mid-term stochastic oscillator, the stock has yet to see adverse correction and bullish pressure remain healthy.
23-period ROC declines but maintain a positive value and Directional movement index shows strong bullish strength.
Strategy
Buy spot @ 205.05 or buy @ 179.00 upon correction.
Target 1: 239.00 (1-2 months)
Target 2: 300.00 (6 months and beyond)
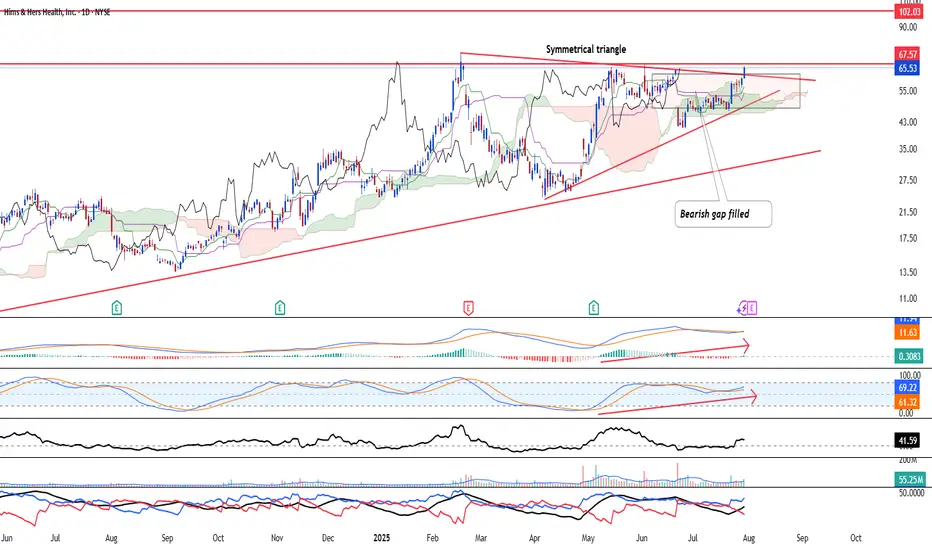
HIMS & HER - Uptrend to continueHIMS & HER NYSE:HIMS is looking at a strong bullish continuation after the stock broke above both the symmetrical triangle and the bearish gap. Resistance at 67.57 has been tested multiple times and is likely to be weakened. Hence, they are likely to break higher.
Furthermore, the stock has shown strong momentum returning after long-term MACD histogram has turned positive and stochastic oscillator crossed above the 50-line and rose, indicating momentum in the mid-term is back in action.
Directional movement index continues to show strong bullish strength.
Strategy:
Buy spot @ 65.53 or buy stop above 67.57. Bull limit @ 49.32 in the event of a correction.
Target 1: 96.93 (1 month est)
Target 2: 110.88 (3-6 month est)
Long USDSGDCapitalising on last night's USD strength -looks like a turnaround for USDSGD. Looking at history, SGD typically trades within a range. (see weekly). Recent months' price action has stretched the range a fair bit, short term trend signals a potential turnaround to revert to mean. Is a contrarian trade but seriously , can Singapore afford currency strength for prolong period of time given inflation may have eased off (stands to be corrected) and being one the most costly countries in the world? Think MAS left the trading band unchanged (Yesterday's news). Good luck!
