T10Y02Y DEATH SIGNAL IS ONIt's just a matter of time to see Unemployment level rising while Spy could shift to a down trend. Painful times ahead folks. Scoop bitcoin and equities once unemployment levels spike
#stockmarket
#bearish
#crash
#stocks
#bitcoin
#bonds
Economy
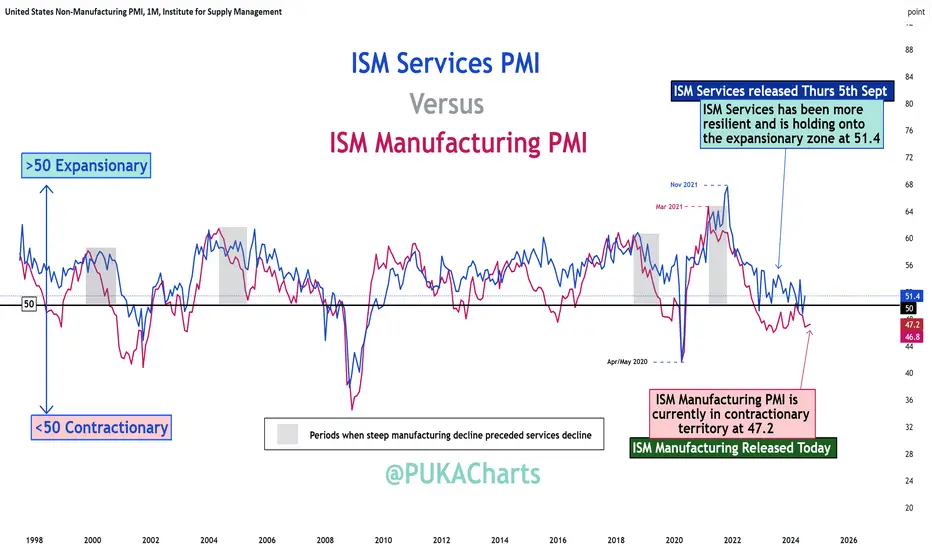
ISM Manufacturing PMI Remains Contractionary ISM Manufacturing PMI (released today).
Rep: 47.2 🚨Below Expectations & contractionary🚨
Exp: 47.5
Prev: 46.8
Anything below 50 is considered contractionary.
ISM Services PMI
ISM Services PMI is released this Thursday 5th Sept 2024. ISM Services is currently expansionary at 51.4. Lets see what Thursday brings.
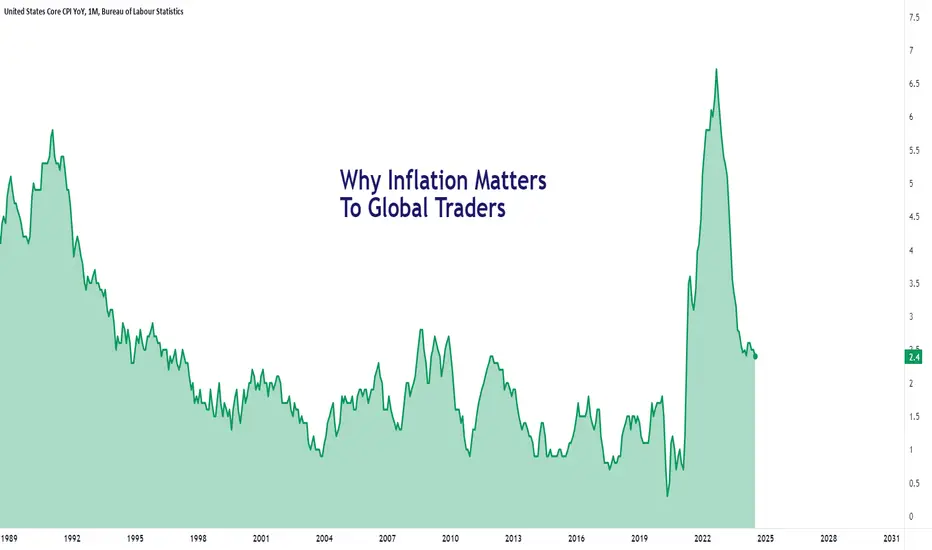
How Inflation Works and Why Traders Must Understand ItInflation has become one of the most important topics in modern economics because of its recent prominence, affecting forex pairs, commodities, as well as everyday goods and services. In this post, our team will provide educational clarity on inflation, what it means, and the important definitions to understand whether you're new to markets or a savvy pro who needs a quick refresher on the topic.
Before we get to the exact calculation of inflation, let us first go over the terms you need to know. By understanding the exact terms surrounding inflation, you’ll have a solid foundation to think critically about the topic.
5 Inflation Terms to Know
1. Inflation occurs when prices rise over time. Think of it like blowing up a balloon – prices get bigger when inflation expands. While it might seem bad, a low and stable inflation rate is good for the economy. Central banks, like the Fed or the Bank of England, aim to keep inflation around 2% to keep stability.
2. Hyperinflation happens when inflation gets out of control, causing prices to skyrocket and currency to become devalued. Examples include Germany before the Second World War and Zimbabwe in the 2000s. Central banks work hard to prevent it.
3. Deflation is the opposite – prices fall. While it sounds good, it can lead to job losses and economic decline, creating a deflation spiral. Central banks may lower interest rates to counteract this.
4. Reflation and disinflation describe changes in the inflation rate. Reflation occurs when inflation rises, and disinflation happens when it falls. Japan faced disinflation in the 1990s, leading to economic stagnation.
5. Zinflation is when inflation stays the same. It sounds stable but can show a lack of economic growth.
Now that you understand the terms that surround inflation, you are ready to dive into the exact calculations of inflation. It’s crucial to understand that inflation is calculated based on specific economic reports for the CPI or Consumer Price Index, which measures a basket of goods like milk and other essentials. Economists calculate inflation by looking at the prices in the CPI report and then comparing those prices to prior periods. For example, if prices are going up in the CPI compared to last year, we know inflation is rising.
Why is CPI Important?
CPI reports are used by central banks to make decisions about interest rates. If CPI is rising too quickly, it usually points to inflation, and the central bank might raise interest rates to cool down the economy. Conversely, if CPI is falling, central banks might lower interest rates to stimulate spending.
CPI is related to inflation. When CPI increases, it suggests that inflation is occurring, meaning the purchasing power of money is decreasing. This is why central banks monitor CPI closely to ensure that inflation stays within a target range, typically around 2-3%. As a trader or investor, you can use these numbers to better understand how asset prices trade relative to inflation.
Thanks for reading our latest educational post about becoming a swing trader! Be sure to follow us for more updates and educational resources like this.
---Forex.com Team
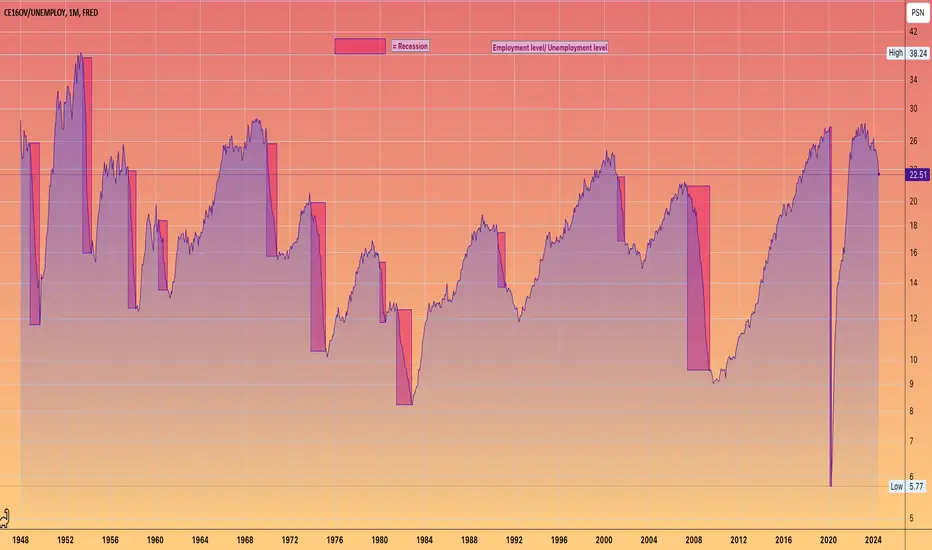
The economy peaked in April 2023"JOBS, JOBS, JOBS!"
As Obama said during the recovery period post GFC
This chart shows the employment level --- how many people are employed in the States / divided by the unemployment level --- the number of people without a job. .
A simple Ratio
With all the official Recessions highlighted in the red box.
The dates of the recessions are from Wikipedia.
JOBS are the ECONOMY
Goods and services are still made by people. (That is obviously under attack by robotics and AI) --- but will likely lead to new economies being birthed and new jobs created.
THE #FED is late to cut
and will likely cut too slowly
guaranteeing a GDP contraction therefore further job losses.
HOLDING RISK ASSETS
IS RISKY
needless to say.
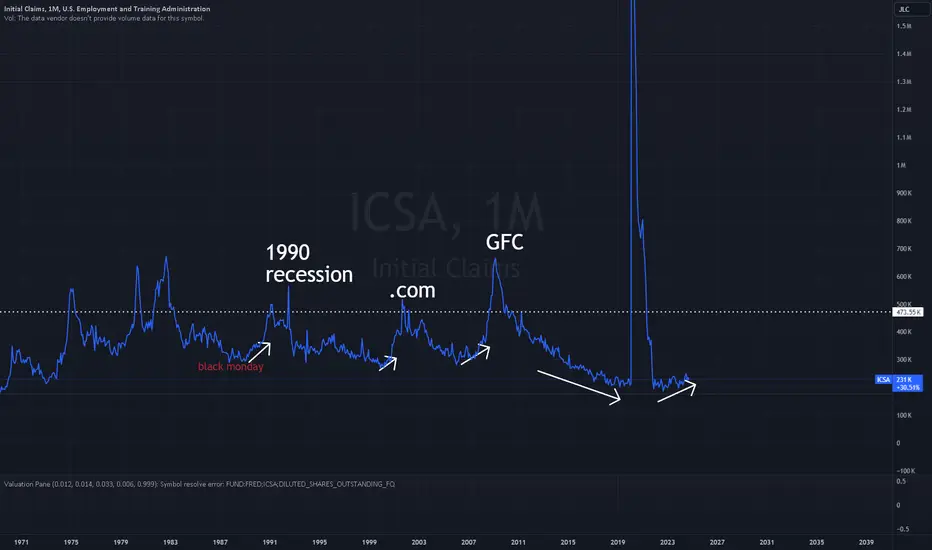
Initial Claims and RecessionsNaturally during recessions we experience huge unemployment numbers, but interestingly enough on the reversal of the highest employment locally on each hill, that reversal can signify the top of the recession, aka the bottom of the market.
Labeled are examples from recent financial crisis.
10y/2y Treasury Yield Spread Un-inverts 10y/2y Treasury Yield Spread Un-inverts
Something just popped its head above the 0 level on the daily chart over the past 3 days.
Read my post below to understand what this means
PUKA

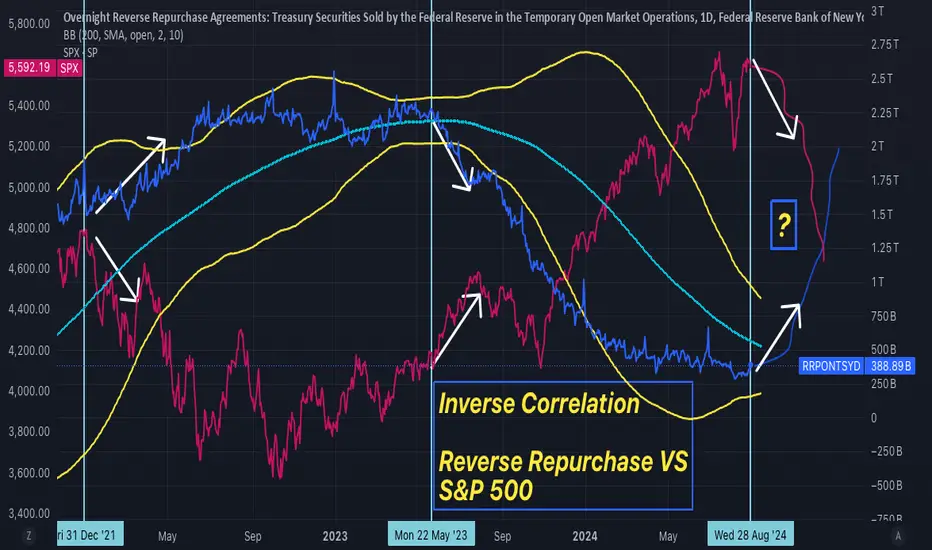
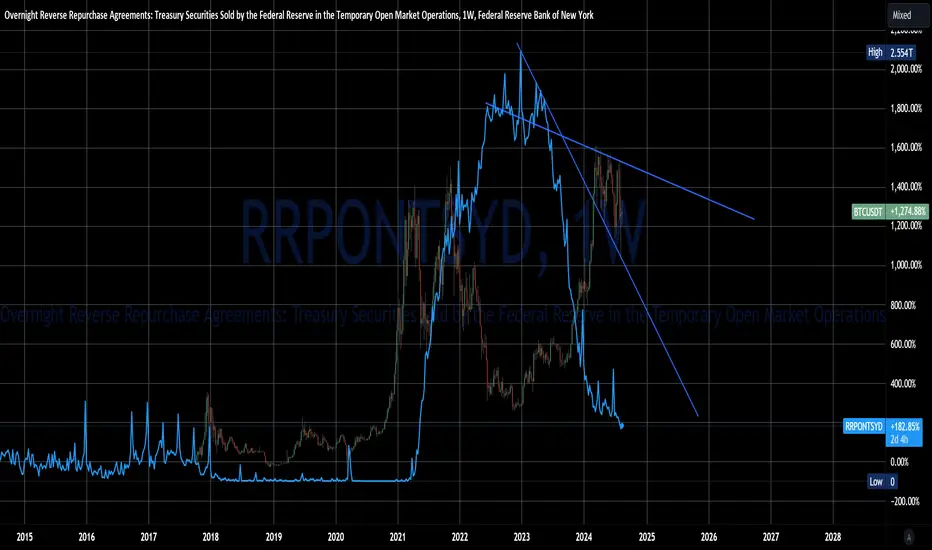
2008 and 2019 - Stock Market Crash: Similar Signs Now! S&P 5002008 and 2019 - Stock Market Crash: Similar Signs Now! -Reverse Repo and S&P 500: Inverse Correlation is Screaming.
Here are 5 Highlights:
1:: Quantitative tightening has been underway since June 2022, and the Fed will have to make a Big Move- iin September 2024:
2:: The overnight reverse repo facility is now getting down to low levels, raising questions about whether another breakdown in financial market liquidity and stress in short-term funding markets could occur.:
3:: On January -2022, the chart shows that the REVERSE REPO started to increase and at the same time S&P 500 started to drop, showing an almost perfect inverse correlation.:
4:: What Happened in the 2008 G-F-C - Quantitative tightening, and in September of that Year?
5:: What was the: dash for cash, and what happened in the September 2019 Repo Crisis?
Quantitative tightening (QT) has been underway since June 2022, with the Fed shrinking its balance sheet in order to bring reserves and liquidity in the financial system back down to more normal levels.
The CME's FedWatch Tool forecasts that the federal funds rate will most likely end 2024 at 4.25% to 4.5%. If so, that's a full percentage point lower than current rates. However, there's substantial uncertainty around that estimate and a higher, or lower, degree of policy accommodation is possible;
The overnight reverse repo facility is now getting down to low levels, raising questions about whether another breakdown in financial market liquidity and stress in short-term funding markets could occur.
I believe that an unexpected rate spike, similar to September of 2019 is unlikely, considering the current liquidity conditions, but the chart I have created triggered a Warning Sign.
As you can see, usually there is a clear Inverse Correlation with REVERSE REPO, and the US STOCK MARKET.
On January -2022, the chart shows that the REVERSE REPO started to increase and at the same time SPX started to drop, showing an almost perfect inverse correlation.
On May - 2023, the chart shows SPX, at the start of a Bull Market as REVERSE REPO is on a Downtrend.
What I have noticed, is that when they are running beside each other, at some point they start to go in the opposite direction, and when they are far apart from each other, at some point they start to converge, going in the opposite direction, crossing at some times.
Since they are really far from each other, the next inverse correlation move could be huge.
So, the question is, the pattern will follow, and if it does how much will the stock market Crash when Reverse Repo starts to spike UP?
For now, I do not see a breakout of the Downtrend for Reverso Repo, but we need to keep very close attention when that happens, to review our stop loss.
Since I have never seen this analysis between the Reverse Repo and the US Stock Market, I had to publish it as soon as possible to warn as many people as I could, of what could happen, anytime from now.
If you know anybody who has made this analysis, let me know in the comments below.
What is the Reverse Repurchase Agreement?
A reverse repurchase agreement (RRP), or reverse repo, involves the sale of securities with an agreement to repurchase them later at a higher price on a specified future date. It represents the seller's perspective in a repurchase agreement (RP), or repo.
The difference between the initial sale price and the repurchase price, along with the timing of the transaction—often overnight—represents the interest paid by the seller to the buyer.
In the U.S. repo market, more than $3 trillion in short-term funding is provided daily, with most transactions being overnight and collateralized by Treasuries. Repos are commonly used for short-term borrowing and lending.
How Does a Reverse Repo Work?
In a reverse repo, a party in need of cash reserves temporarily sells a business asset, equipment, or shares in another company, with an agreement to repurchase them later at a premium. The buyer of the assets in a repo agreement earns interest for providing liquidity to the seller, while the underlying collateral helps mitigate the risk of the transaction.
Example of Reverse Repurchase Agreements
Consider Bank ABC, which has excess cash reserves and wants to earn a return on them. Meanwhile, Bank XYZ faces a reserve shortfall and needs a temporary cash infusion.
Bank XYZ may enter a reverse repo agreement with Bank ABC, selling securities to Bank ABC to hold overnight and agreeing to buy them back at a slightly higher price the next day. From Bank ABC’s perspective, this transaction is a repurchase agreement.
How Does the Federal Reserve Use Reverse Repos?
When the Federal Reserve engages in a reverse repo, it sells securities with an agreement to repurchase them later. In doing so, the Fed borrows money from the market, which can help absorb excess liquidity in the financial system.
The Bottom Line
A reverse repurchase agreement (RRP), or reverse repo, is the sale of assets with an agreement to repurchase them later at a higher price. Essentially, it functions as a short-term loan with the sold assets serving as collateral.
What Happened to the Repo Market during QE of 2008, and What happened in September of that Year?
During the 2008 financial crisis, the repo market faced severe liquidity stress as financial institutions struggled to obtain short-term funding. The repo market, where institutions borrow cash by selling securities with an agreement to repurchase them later, is a crucial source of liquidity for banks and financial firms.
However, as the crisis unfolded, the value of the collateral—primarily mortgage-backed securities and other complex financial instruments—plummeted. This led to a sharp increase in haircuts (the discount applied to the collateral), causing lenders to demand more collateral for the same amount of cash.
The resulting lack of confidence in counterparties and declining asset values led to a run on the repo market, where borrowers were unable to roll over their repos or obtain new funding. This liquidity crunch intensified the financial crisis, leading to the collapse of major institutions like Lehman Brothers and prompting the Federal Reserve and other central banks to intervene by injecting liquidity and expanding their roles in the repo market to stabilize the financial system.
During the 2008 financial crisis, U.S. bank reserves became scarce in the period leading up to the implementation of Quantitative Easing (QE) by the Federal Reserve.
So, what happened in September 2008?
This scarcity of reserves was most pronounced in the fall of 2008, especially following the collapse of Lehman Brothers in September.
At that time, the interbank lending market froze as banks became increasingly risk-averse and reluctant to lend to one another due to fears of counterparty default.
This resulted in a severe liquidity crisis, making reserves—cash that banks hold at the Federal Reserve—scarce. Banks hoarded reserves to ensure they could meet their own funding needs, leading to a sharp increase in the cost of borrowing reserves, as reflected in the spike of the federal funds rate above the Fed's target.
To address this, the Federal Reserve initiated a series of emergency measures:
Liquidity Facilities: The Fed introduced several facilities, such as the Term Auction Facility (TAF) and Primary Dealer Credit Facility (PDCF), to provide liquidity to banks and primary dealers.
Quantitative Easing (QE): Beginning in late 2008, the Fed started its first round of QE, which involved purchasing large quantities of longer-term securities, including U.S. Treasuries and mortgage-backed securities (MBS). These purchases injected substantial reserves into the banking system, alleviating the scarcity of reserves and lowering borrowing costs across the economy.
By increasing the supply of reserves through these measures, the Fed aimed to stabilize the financial system, restore normal functioning to credit markets, and support economic recovery.
With the advent of quantitative easing in 2008, the U.S. Federal Reserve (Fed) moved from a scarce to an ample reserves regime. The Fed used to control rates by managing the supply of bank reserves so that interest rates would clear at target.
But now banks frequently hold substantial reserves. These reserves are now managed and incentivized by the Fed, which pays interest rates on reserve balances (IORB).
Non-banks, such as money market funds, can also park money at the Fed’s Overnight Reverse Repo Facility.
These two mechanisms act as a floor system, allowing the Fed to control short-term interest rates. For example, if interbank rates fell below IORB, a bank could make more money using the Fed facility and would do so.
What was the: dash for cash, and what happened in the September 2019 Repo Crisis?
The recent dash for cash highlighted the importance of understanding liquidity stress dynamics in key funding markets.
The sharp spikes in repo rates in March 2020 were clear signs of severe liquidity stress. We previously observed similar stresses in money markets when reserves became scarce in September 2019.
The Fed's quantitative tightening (QT) began in the fall of 2017, and by mid-September 2019, $700 billion in reserves had been drained from the financial system.
What Happened in September 2019?
On September 16, 2019, $70 billion was withdrawn from banks and money market funds to meet quarterly tax payments. Simultaneously, $50 billion in long-term Treasuries settled, which were purchased by dealers, further straining their reserve positions.
At that time, hedge funds significantly ramped up their borrowing, and repo spreads widened, particularly in the bilateral segment of the market, where banks and gilt dealers were lending at much higher rates compared to borrowing from non-banks.
Will the Fed respond the same way this time? Could the same liquidity-type crises happen again?
First, it's important to recognize that in 2019 and 2020, the Fed used repos reactively as a firefighting tool to address liquidity crises. Learning from these market disruptions, the Fed established a new standing repo facility (SRF) to proactively provide liquidity whenever needed. This facility has a capacity of $500 billion, which is expected to be sufficient to handle liquidity demands during future periods of stress.
Additionally, the Fed introduced another repo facility called the Foreign and International Monetary Authorities (FIMA) Repo Facility, allowing foreign central banks to access dollar liquidity. Generally, the Fed aims to avoid repeating past mistakes.
Reflecting this, the Fed recently announced a reduction in the pace of quantitative tightening (QT) for its Treasury securities from $60 billion to $25 billion per month, partly to lower the risk of another liquidity crunch.
Looking ahead, a new ruling by the U.S. Securities and Exchange Commission (SEC) from December 2023 mandates a shift to central clearing of repos by June 30, 2026.
What could still go wrong?
The Treasury market seems more fragile now than it was before the Global Financial Crisis (GFC). Algorithms account for 60%-80% of trading depth at any given time, but they tend to shut down during periods of high volatility, such as market scares. This can exacerbate fragility during risk-off events, especially with dealers constrained by post-GFC capital rules.
There is a circular relationship between the Fed and the markets. The Fed cannot precisely determine in advance when reserves will shift from being ample to scarce; instead, it relies on market signals and pressures to gauge when a tipping point might be near.
Speaking at the U.S. Monetary Policy Forum in New York on March 1, 2024, Fed Governor Christopher Waller noted that increased use of the Standing Repo Facility (SRF) could indicate that reserves are nearing an ample level. However, this still leaves directional illiquidity risks in the market, even if those risks are somewhat mitigated by the new backstop measures.
The bottom line
What is beginning to happen is that there are new protocols in Treasury markets for trading all-to-all participants. These algorithms will reduce capital, and hedge funds will begin to step in. As these protocols get built out, more non-traditional price makers and market participants will be able to help support unexpected stress in the Treasury market.
The institutional features are in place and have changed the market structure to reduce the risk of a repeat of 2008 and 2019, but everything has a limit at some point, and something is unbreakable until it breaks.
This lesson we all have learned from Titanic is: never doubt about a natural force's power. I believe, that even the abstract reality of money and markets follow the same principle, and when this natural force decides to act, no one can stop it, otherwise they could've prevented what happened in 2008 and 2019.
Technical analysis is not 100% perfect, as any other financial instrument that tries to predict the market, but the signals I have captured from the Inverse Correlation of the US Reverse Repo Market and the US Stock Market, are Very Strong.
If the US Reverse Repo market starts a strong Uptrend, it could trigger the Stock Market Crash.
Since, we are expecting big moves from the Fed in September, which is a regular period of withdrawal from banks and money market funds to meet quarterly tax payments, volatility is on the way; maybe the Fed will be able to hold liquidity steady, but only time will tell.
From my experience, this is the best time to review all investment strategies cutting risks as much as possible. Let's hope for the best while preparing for the worst.
- Good Luck and Good Profit My Friends:
Disclaimer:
The information presented on this channel is for news, education, and entertainment purposes only. The information does not constitute an offer or solicitation to buy or sell any investment product(s) or investment strategies, or a substitute for professional investment advice. It does not take into account your specific investment objectives, financial situation or needs. I am not a financial advisor or a licensed investment professional. Please consult with your financial advisor before following any investment strategies discussed in this channel.
,
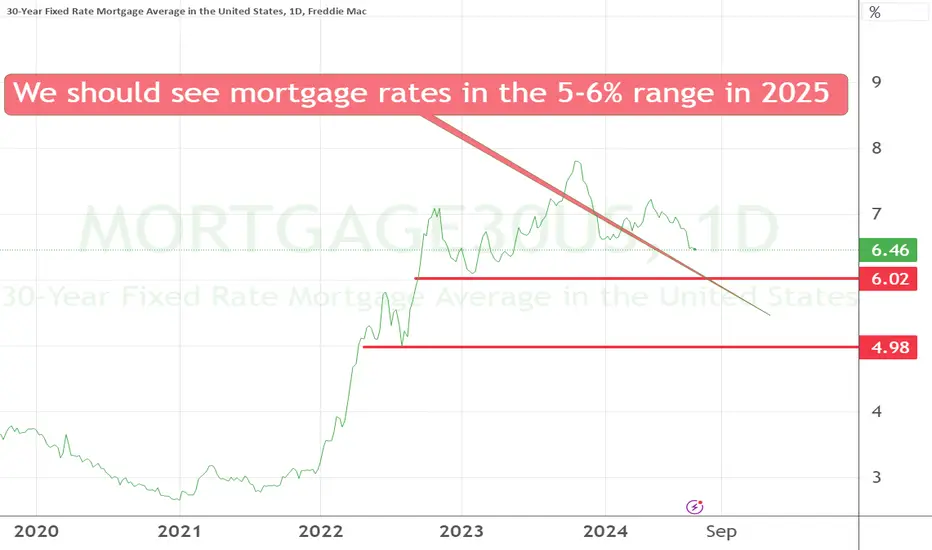
Mortgage rates finally breaking support to the downsideMortgage rates finally breaking support to the downside
We should see the 30 year in the 5-6% range in 2025
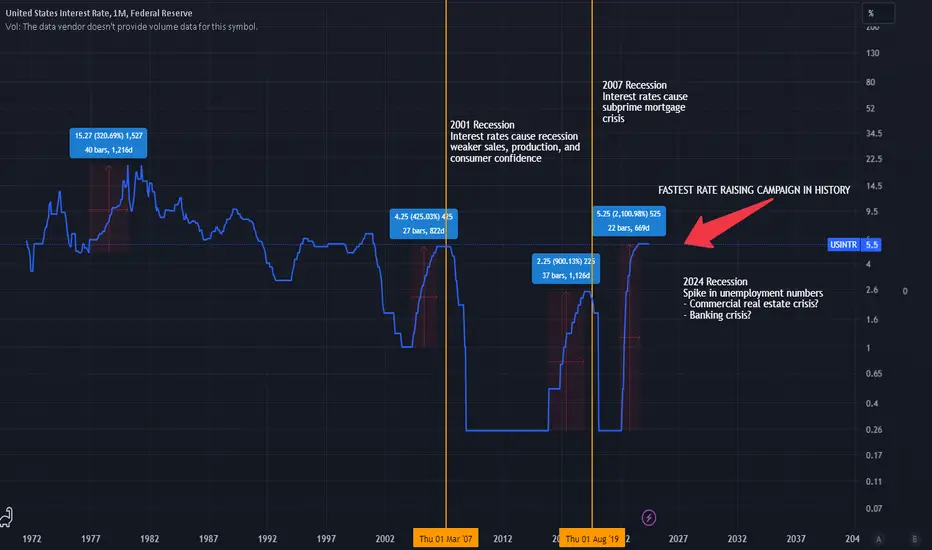
Knock Knock. Who's There? Vibecession Ft. US Interest RatesHello Everyone,
IMPORTANT: ALL FED POLICIES LEAD TO NEGATIVE OUTCOMES
TLDR AT THE END
In February 2022 the Federal Reserve gave us the fastest rate raising campaign in history to try and combat very high inflation, but they were very late in raising rates causing one of the worst inflation in 40 years. During his speech at Jackson Hole he confirms rate cuts in September due to inflation being under control and the labor market "cooling." Good news is inflation is under control, however this is only the start of our labor market "cooling."
Jerome Powell is extremely late in cutting rates and will be cutting rates because we are getting BAD economic data and the cracks are showing in our labor market, commercial real estate, and banking sectors.
The Federal Reserve 100% KNOWS a recession is coming that is why they are cutting rates. We have Jerome Powell come up on stage sweet talk to us about a soft landing, inflation under control, and how he will cut rates to help the labor market. He's not going to be instilling fear in Americans as a chairman.
Just Remember, ALL FED POLICIES LEAD TO NEGATIVE OUTCOMES. Recession is coming, Sahm rule and inverted yield curve hasn't been wrong and it won't be wrong this time. This time it's not different.
TLDR: Jerome Powell is too late in cutting rates causing a recession
THE YIELD CURVE HAS UN-INVERTED! WHAT'S NEXT?In this video, we discuss the yield curve represented by the T10Y2Y flipping positive and go over what has historically happened to the US economy when it comes to recessions. I also go over some practical non-financial advice.

Federal Reserve is Behind the Curve, Recession is 100% CONFIRMEDHello everyone,
The federal reserve has kept interest rates at near zero and printed the MOST money in US history back in 2020 and this has caused one of the worst inflation in 40 years. Jerome Powell decided to fight inflation by giving us the fastest rate raising campaign in history. He has kept rates too high for too long and we are now guaranteed a recession. Jerome Powell will find himself in a position to cut rates very fast due to the cracks in the job market. It is already too late we will be witnessing a huge spike in unemployment. Who knows how high this can go, back in 1929 unemployment hit 24.9%.
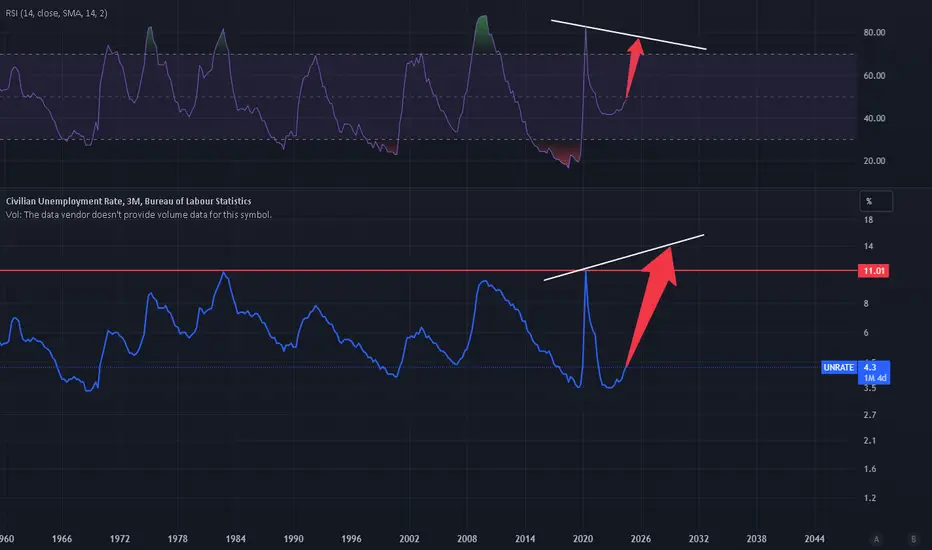
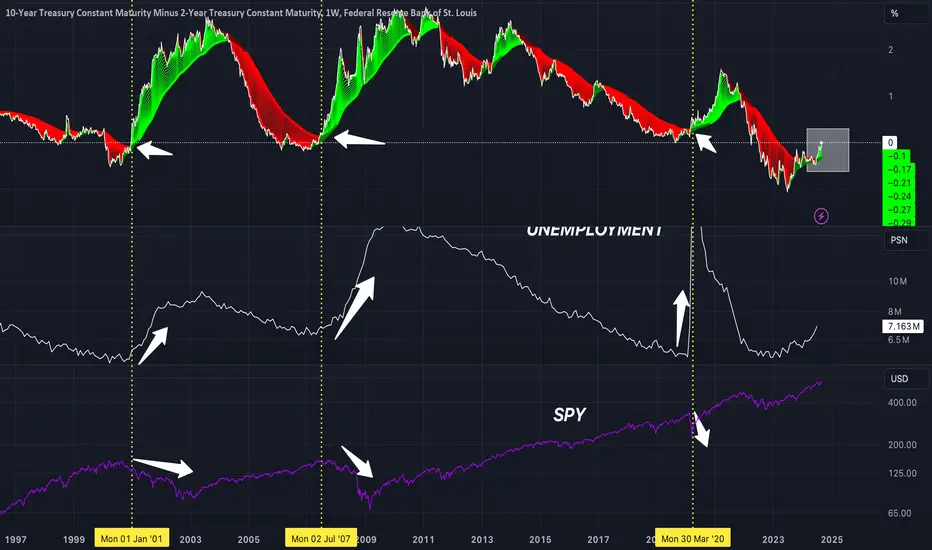
The bearish case for risk-on assets during rate cuts.It’s interesting to observe how, historically, every time the Federal Reserve cuts interest rates, we tend to see a rise in unemployment and a decline in the S&P 500. While rate cuts are often used to stimulate the economy, they can signal underlying economic challenges that lead to market downturns and job losses. 📉📊 Here are two charts showing the relationship between interest rates, unemployment, and the S&P 500 over time.
Having said that, I'm open to the idea of a 'This time is different!' scenario and a 'soft landing,' especially given how aggressively the Fed has raised interest rates this time.

Macro Monday 61 - Fed Balance Sheet Signals Liquidity BounceMacro Monday 61
Fed Balance Sheet Hits Long Term Supporting Trend Line
The Federal Reserve Balance Sheet
The balance sheet is published weekly, typically on Thursday afternoons, and it provides valuable information on the direction of global liquidity and the fed’s monetary policy.
When the Federal Reserve’s balance sheet increases, it means that the central bank is acquiring more assets. This expansion can occur through purchases of Treasury securities, mortgage-backed securities, or other financial instruments. The increase in assets typically leads to greater liquidity in the financial system and can influence interest rates. Conversely, a decrease in the balance sheet indicates asset sales and reduced liquidity
The Chart - FRED:WALCL
▫️ Since April 2022 the Federal Reserve Balance Sheet has reduced from $8.973 trillion to $7.140 trillion (reduction of $1.833 Trillion).
▫️ Right now, the chart has signaled that we have hit a critical diagonal trend line support (red line on chart).
▫️ We have hit this red trend line twice in the past (Sept 2019 & Aug 2008) and on both occasions it bounced from the red trend line and the balance sheet thereafter increased significantly for 2 to 5 years.
If you follow me on Trading view, you can revisit this chart at any time and press play to get the up to date data and see if we have held the line or fallen below it.
What does the following mean to you?
✅High likelihood of interest rate reductions in Sept.
✅Apparent stabilization of the rate of inflation (U.S)
✅A current stable labor market in the U.S
⏳The possibility of the balance sheet bouncing from trend support and increasing from the support line as it did in the past for 2 years+ (Increasing Global Liquidity).
Versus
🚨 The yield curve un-inverting (moving above 0)
🚨 Sahm Rule Triggered
🚨 The marginal increase in the U.S. Unemployment Rate which is consistent with prior recessions.
🚨 U.S. Initial Jobless Claims and Continuous Jobless claims have had increases consistent with pre recession historic activity.
🚨Job openings reducing since March 2022 from approx. 12m to 9m (this would be the largest pre recession drop ever if followed by a recession.
🚨 Warren Buffet sitting on the biggest pile of cash ever.
Does this all say “soft landing” imminent or should we be worried?
In my opinion, we will know by Jan 2026. Its a big window of time, but the timing is the biggest challenge, and if we can take one thing from the above, volatility is guaranteed.
Happy Trading
PUKA

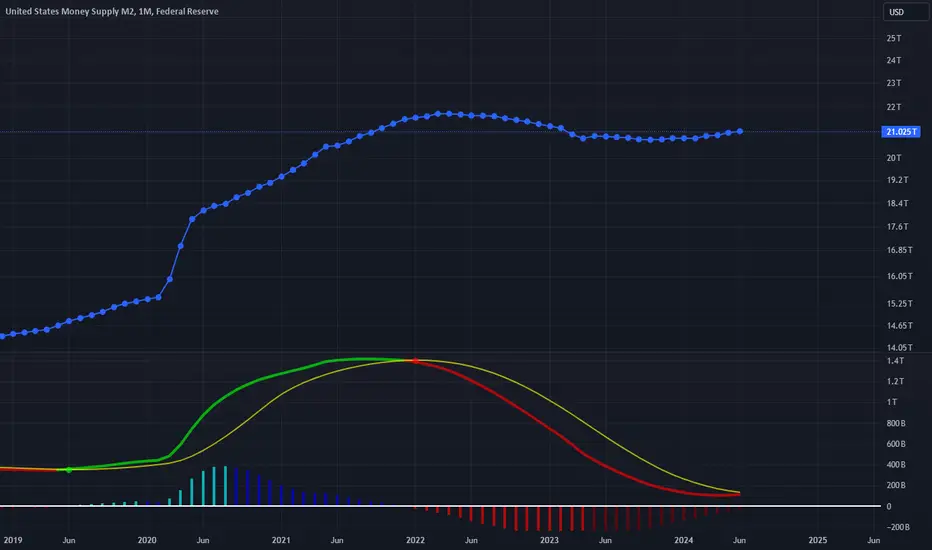
$M2 money printer is about to go brrrM2 money supply could see an increase in the near future due to several key factors. Central banks may adjust monetary policies to inject more liquidity into the economy, while new fiscal stimulus measures could further boost M2. Additionally, rising consumer and business spending might drive up the demand for money. Inflation concerns could also lead central banks to expand M2 to stabilize prices. Keep an eye on these developments as they unfold.
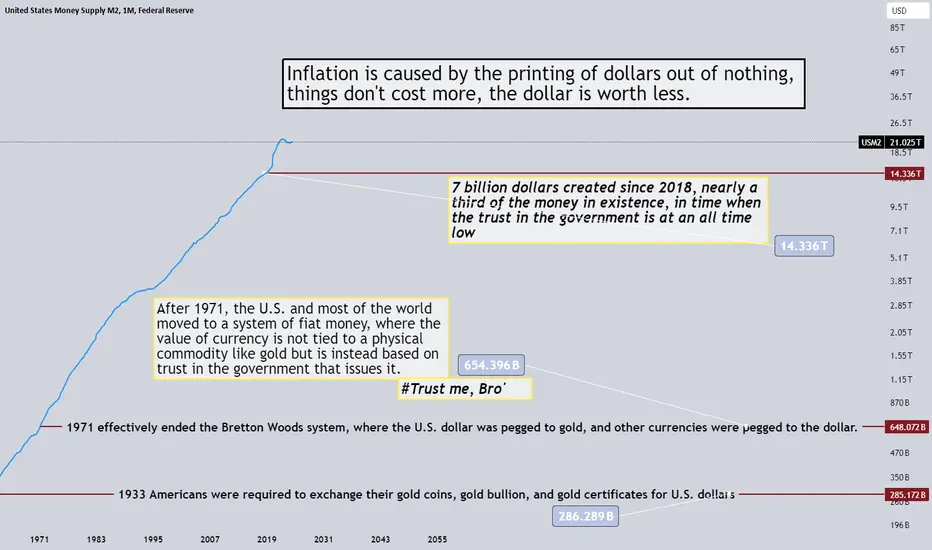
Money Supply since 2018 increased 7TInflation is caused by the printing of dollars out of nothing, things don't cost more, the dollar is worth less.
Macro Data and Rate Monitored Around The GlobeFed Rate, US PCE and Core PCE as well as Inflation and Core Inflation.
These charts surely are closely monitor by anyone around the globe.
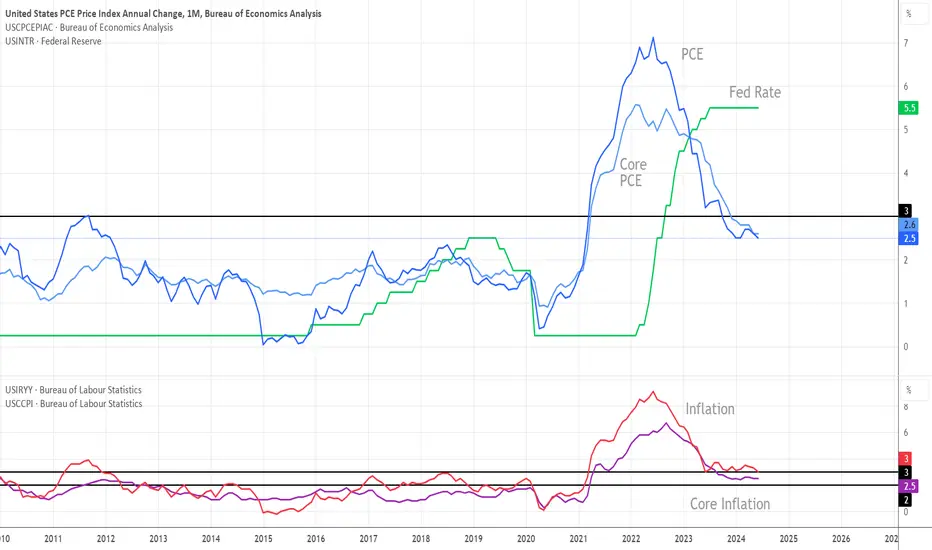
Lower inflation do not mean things will become cheaperLower inflation and interest rates do not necessarily mean that prices will decrease. If I annualize the inflation numbers instead of focusing on the monthly figures, the overall picture becomes much clearer.
2 and 10 Year Yield Futures
Ticker: 2YY, 10Y
Minimum fluctuation:
0.001 Index points (1/10th basis point per annum) = $1.00
Disclaimer:
• What presented here is not a recommendation, please consult your licensed broker.
• Our mission is to create lateral thinking skills for every investor and trader, knowing when to take a calculated risk with market uncertainty and a bolder risk when opportunity arises.
CME Real-time Market Data help identify trading set-ups in real-time and express my market views. If you have futures in your trading portfolio, you can check out on CME Group data plans available that suit your trading needs tradingview.sweetlogin.com

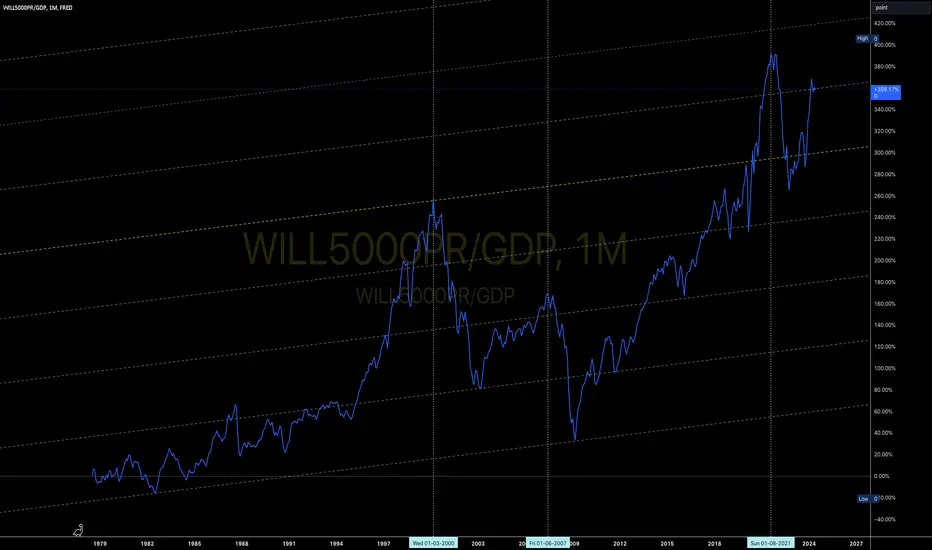
Do we near to another crisis?Dear All
As you see this is the Will5000PR to GDP Ratio !!! I think it is clear that we are so close to another crisis in USA and afterward whole world Markets !!!
Maybe it is time to take care of your money !!!
btc/rrpas i come from hibernation to give you the mother of all shorts... BTC and i have multiple reasons why... 1. groups.csail.mit.edu 2. japan carry trade (alot of crypto was purchased using negative loans in yen) and 3. giving the keys to larry tinkle finkle (the OG financial crisis architect). laugh all you want if im wrong im wrong and ill be able to offload my bag at 100k like the rest of the masses, or im right will have a massive discount and still sell my bag high and have a great opportunity to buy more...
Scared of the US bond market ?Some investors sold Treasuries because of the mounting debt. However, history shows they should do the opposite.

Lowest headline CPI print since March 2021This is the first time since March 2021 that headline CPI has fallen as low as 2.9%.
U.S. Headline CPI
Rep: 2.9% ✅Lower than Expected✅
Exp: 3.0%
Prev: 3.0%
U.S Core CPI
Rep: 3.2%✅In line with Expectations✅
Exp: 3.2%
Prev: 3.3%

Macro Monday 59~Japan Interest Rate Hikes Often Lead Recessions Macro Monday 59
Japan Interest Rate Hikes Often Lead Recessions
Apologies for the late release this week, I was ill yesterday and I am slowly making a recovery. This week I am keeping it brief however the chart really will speak for itself.
If you follow me on Trading view, you can revisit this chart at any time and press play to get the up to date data and see if we have hit any recessionary timeline trigger levels. They are very handy to have at a glance.
The chart illustrates the Japan central banks Interest rate history and overlays the last 7 recessions. A few key patterns and findings are evident from the chart which I will summarize below.
The Chart - ECONOMICS:JPINTR
SUBJECT CHART
◻️ 5 of the last 7 recessions were preceded directly by Japan Interest rate hikes.
- Arguably it is 6 out of 7 if you include the 1980 recession with the 1981 recession (which happened as rates were still declining from the original increase).
⌛️The average length of time from the initial hike to recession was 11.6 months.
- This would be Jan/Feb 2025 based on the initiation of Japan’s rate increases in Feb/Mar 2024. If you read my material you’ll know that the date of Jan 2025 has repeatedly arisen as a concerning date on multiple charts. This does not guarantee anything other than historical time patterns on multiple charts seem to point roughly towards Jan 2025 as a month of concern.
◻️ The minimum time frame from initial hike to recession was 8 months (Oct 2024) and the maximum time frame 18 months (Aug 2025). This can be our window of concern.
◻️ Its important to note that the rates have remained elevated or increasing for longer than the above timelines outset. In this chart we are only looking at the the first rate increase to recession initiation timeline. We are doing this establish a risk time frame. In the event rates remain elevated into month 11.6 (the average timeframe) we will know we are entering dangerous territory (Jan 2025). Likewise we could go a long as 18 months which is the maximum timeframe. This is all dependent on rates remaining elevated or increasing. A reduction in rates could deter or remove the risk timelines discussed.
What happens next is dependent on what the Japan Central bank does. History suggests when they start to increase rates its for a minimum of 6 - 8 months (Sept - Oct 2024), lets see if they pass these months and start to move towards Jan 2025 (the average time line from rate increase initiation to recession). This is a move into higher risk territory.
I want to add last week summary as a reminder that multiple other charts are lining up to suggest we may have volatility in the coming 6 months:
Macro Monday 58
Recession Charts Worth Watching
What to watch for in coming weeks and months?
▫️ If both the 10 - 2 year treasury yield spread and the U.S. Unemployment Rate continue in their upwards trajectory in coming weeks and months, this is a significant risk off signal and recession imminent warning.
▫️ Since 1999 the Federal reserve interest pauses have averaged at 11 months. July 2024 is the 11th month. This suggests rate cuts are imminent.
▫️ The 2 year bond yield which provides a lead on interest rate direction is suggesting that rates are set to decline in the immediate future and that the Fed might lagging in their rate cuts. Furthermore, rate cuts are anticipated in Sept 2024 by market participant's.
▫️ Finally, rate cuts should signal significant concern as most are followed immediately by recession or followed by a recession within 2 to 6 months of the initial cut. Yet the market appears to be calling out for this. This is high risk territory. Combine this with a treasury yield curve rising above the 0 level and an increasing U.S. unemployment rate and things look increasingly concerning.
(for all of the above charts see last weeks Macro Monday).
____________________________________
As always you can log onto my Trading View press play on the chart to see where we are, and get an visual update immediately on if we are at min, avg or max recessionary levels.
PUKA

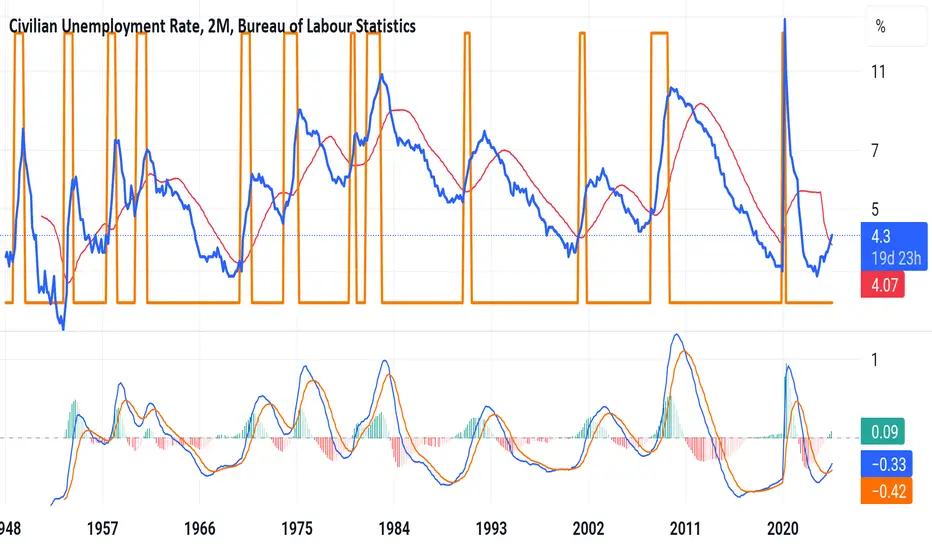
Welcome to the 2024 recessionOrange bars indicate recessions calculated by the NBER. Keep in mind, they waited a year to spawn in the 2008 information. Appears to have entered into the steepening phase with a MACD cross on the 2 month. Also a cross on the 21 period moving average. I believe this to be a little more accurate than the Sahm rule.