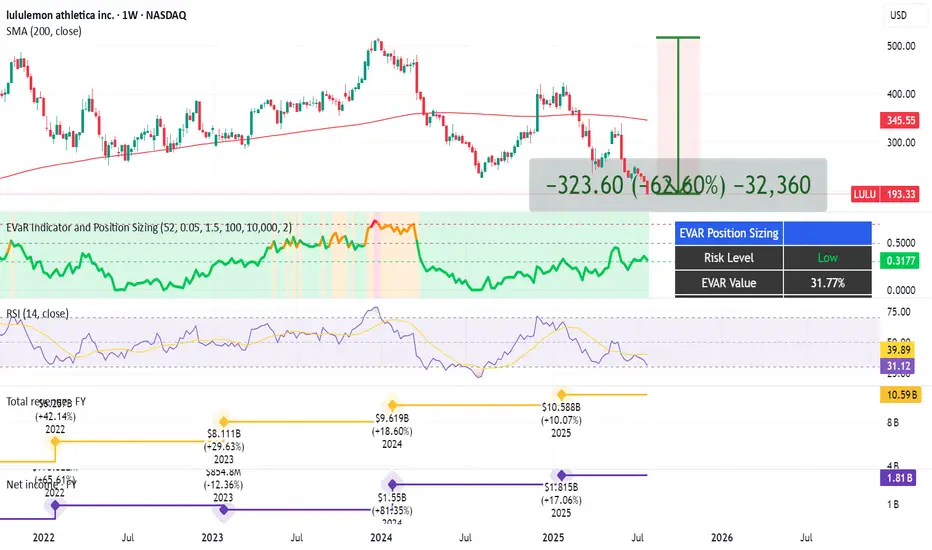
Yoga Pants, Tariffs, and Upside: The $LULU BetLululemon NASDAQ:LULU - My Investment Thesis 👖
Hey team,
I've been keeping an eye on NASDAQ:LULU for a while, and I'm finally going to pull the trigger.
In this market of overhyped MAG 7 stocks, Lululemon dropped 62% since its high in Dec. 2023 until now.
Here's why I'm into LULU:
Revenue has been growing every year for 5 years. Still, the stock is at its lowest in 5 years.
Growth has been slower in the US but good in Asia.
Net income has also been growing over the last 3 years.
P/E ratio is at 13, the lowest in many years.
Stock is also beat up because of the tariffs.
Analysts at Morningstar put its fair value at $305 (now $193, giving it an upside of 58%).
Product Innovation: New franchises like Daydrift, Shake It Out, and Align No Line have been well-received and will continue to drive sales.
Lululemon recently announced an expansion into India for 2026, with plans to open a physical store and a partnership with Tata CLiQ, the e-commerce arm of India’s largest business conglomerate, Tata Group. India can be a huge market for Lulu.
There's also intense competition and margin erosion.
Saying this, I kinda see people around me less excited about Lululemon products.
Technical Analysis:
My EVaR - Entropic Value at Risk - is in a low risk area.
RSI is oversold.
Price has been under the 200 MA for too long.
I'm going to proceed with caution on this one, and allocate approximately. 0.5% of my portfolio into it.
Quick note: I'm just sharing my journey - not financial advice! 😊
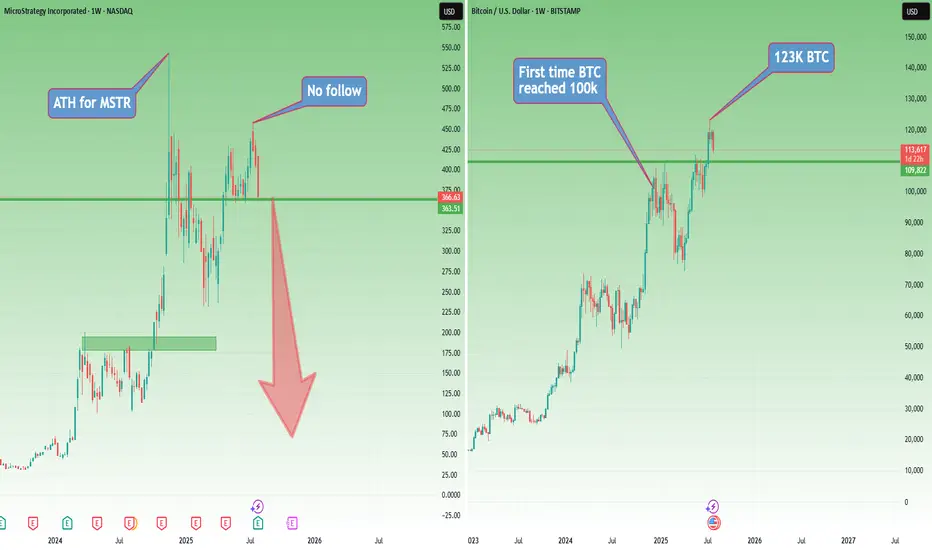
Why Pay $250K for a $115K Bitcoin? Welcome to Strategy (MSTR)This is already the third article I’ve written about Strategy (formerly MicroStrategy), and for good reason.
You don’t need to be a financial expert to ask: why buy a stock that simply mirrors Bitcoin’s price — but at a massive premium?
No matter how sophisticated the explanations may sound, or how many times you’re told that “if you don’t understand it, it must be brilliant,” the reality is much simpler — and much more absurd.
Buying Strategy today is like paying $250,000 for Bitcoin while the actual market price is $115,000.
It’s not about complexity. It’s about common sense.
I won’t dive too deep into it — no need to fight “financial sophistication” with even more sophisticated words.
The point is simple: buying Strategy is like paying me $10,000 just so I can hold your $10,000 and call it an “innovative capital deployment strategy.”
Sounds smart, right? Until you think about it for more than five seconds.
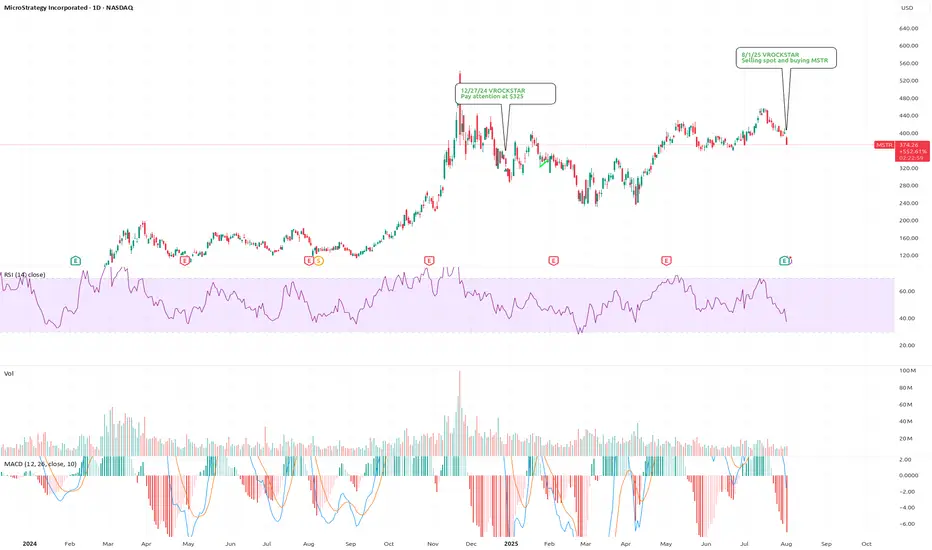
Now let’s look at the posted charts — simple and visual.
Strategy (MSTR) hit its all-time high in November 2024, right when Bitcoin first reached $100,000.
Then came a sharp correction of more than 50% for the stock.
Fast forward: even though Bitcoin went on to make new all-time highs, Strategy didn’t follow, it seems like people were finally starting to wake up.
When BTC peaked again in mid-July 2025, Strategy only managed to reach $455 — well below its November ATH.
Since then, BTC has pulled back about 10%, while Strategy dropped around 20%.
So much for the “outperformance” argument.
And here’s where things get even harder to justify:
In the past, some institutions bought MicroStrategy because they couldn’t hold Bitcoin directly. Fair enough.
But now? Spot Bitcoin ETFs are live, regulated, widely available, and charge tiny fees — without the leverage, dilution risk, or premium baked into Strategy.
So what’s the excuse now?
Where are we now?
At this moment, even though I’m not too happy about this week’s Bitcoin weakness, I remain cautiously bullish — emphasis on cautiously.
But let’s entertain a scenario.
If Bitcoin continues to correct, Strategy is sitting right on support. And if BTC breaks lower, Strategy will almost certainly follow — breaking support and heading toward the next level.
That next support? Somewhere around $240–250, depending on how deep the Bitcoin pullback goes.
But here’s the real question:
What happens if Bitcoin enters a true bear market?
Will Strategy — which just recently rebranded from MicroStrategy — be forced to rebrand again as…
NanoStrategy?
Just a Saturday thought.
Third Quarter 2025 Nigerian share picks Update....Percentage Up!Here's a summary and update on the third quarter 2025 Nigeria stock picks based on the price comparison between July and August - 1month:
Q3 2025 Trading View: Nigerian Stock Picks Update
Strong Performers with Significant Gains:
BUACEMENT: Up 48%, showing strong momentum as a cement sector leader.
DANGSUGAR: Increased by nearly 37%, notable growth in the sugar sector.
ELLAHLAKES: Shares rose over 36%, a promising performer.
DANGCEM: Cement stock up about 20%, continuing solid growth.
ETRANZACT: Up 24%, showing steady improvement in the tech/payment sector.
MULTIVERSE: Grew by 24%, indicating healthy gains in diversified tech.
NB: +28.8%, good growth for the banking/finance sector.
Moderate or no Growth:
ARADEL: Small increase of about 1%, steady but minimal movement.
HMCALL: Stable with a minor 1.4% increase, remaining consistent.
TRANSPOWER: No price change, holding steady for now.
Overall Market Sentiment:
Average gain across all picks is approximately +22%, a strong positive trend overall.
Indicates a bullish sentiment on these carefully selected third-quarter stocks.
Opportunity exists to take advantage of higher momentum sectors like cement, sugar, and tech/payment companies.
Trading Takeaway:
The Q3 2025 picks demonstrate robust growth potential, especially in key sectors like construction materials and tech/payments. Conservative performers provide portfolio stability while high growth stocks offer upside. Continual monitoring for volume and market news is recommended to capitalize on gains and manage risks moving forward.

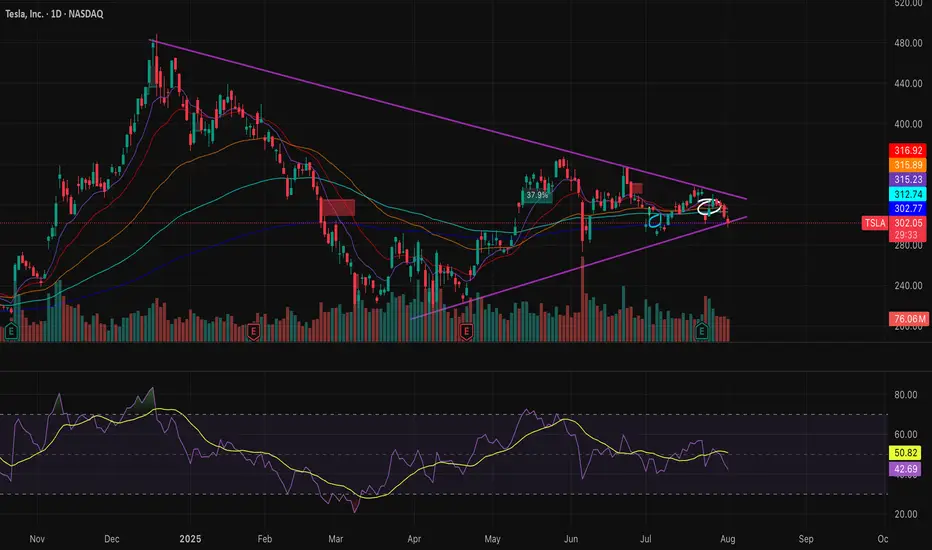
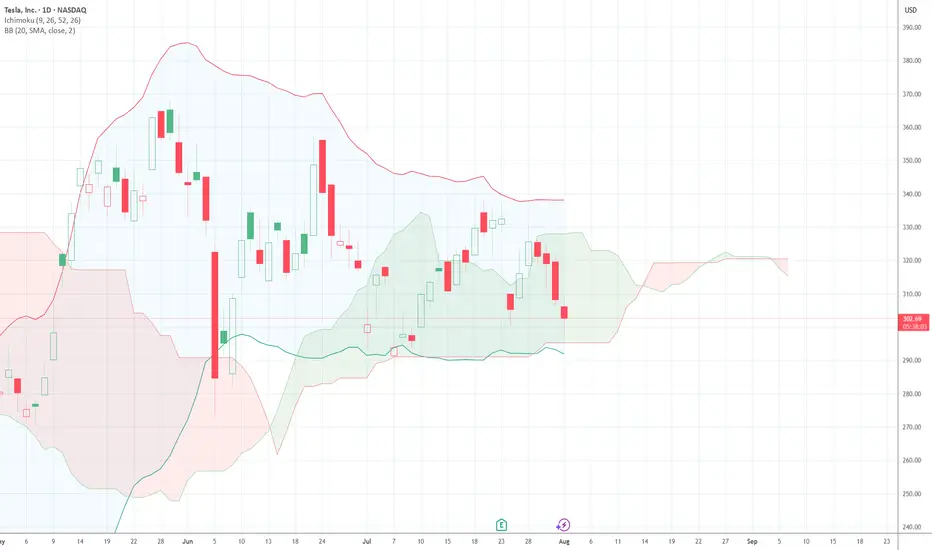
Make or Break point for TSLAlots of bulls and bears for TSLA. Wedging for a bit now. Filled the 296 gap and gap above, now its time to see if TSLA wants up or down. RSI MACD stabilized, volume thinned out, so whatever direction it chooses I think will be explosive. Plenty of Call and Put flow on both sides.
8/2/25 - $talk - Unclear to me, still8/2/25 :: VROCKSTAR :: NASDAQ:TALK
Unclear to me, still
- I really like the growth profile here, at least what's expected but the stock has not really been beating expectations in the last few Q's and while the market moved higher this has been bad money and while stock price doesn't necessarily reflect reality in the ST, if the stock has been sideways for a year and a half... i need more
- so what's the catalyst?
- GT's seems to show perhaps there's a good July? but idk how reliable this is
- FCF generation is "okay" (a lot is SBC, which for a stock like this... not ideal), so what's the real return here? 5-10%? for a small cap, that's just unfortunately not what the market is buying and i don't have an edge, so i need a steeper discount to care again
- see my notes on NYSE:FC about my process of alert and watchlist mgmt happens, what i'll say here is that i'm re-setting the target just above $2 to reassess, even though that's unlikely the point i'd be a buyer.
- sometimes names are just too unfamiliar for me and where a 1% position is more brain damage to carry on my PnL (for a guy that likes 3-5 positions max).
- my guess the stock works in time... just a hunch. but that's not a reason for me to neck out my capital in a name like this for now. i'd guess a beat gets dumped from the pop and a miss sends this a lot lower. so it's hard to play that. easier to just watch.
V

RIOT: Looks pretty bad, but still has a chance to recoverBreaking down into the big bad channel maybe was the first warning of a false breakout. August first price action just made things a whole lot worse. The hope here is that RSI is tanked and has multiple pints of bullish divergence. But the bad news is, the overall price action is still a very 3 waves structure. If price falls into wave 1 territory, then it is pretty much game over. It could be a leading diagonal, or it could be another x wave to bring the price back down to the bottom of the channel yet again. BTC is also trying to maintain must keep support level. So, if next week we see a sharp recovery, then the 5 waves structure may still be intact. However, if price breaks down below $10, then best to stay out of it until things settle down. I took some profit at the top of the channel and got stopped out for most of my position for now. I will hold the rest with a stop at $9.5. If price recovers, then will ride the final wave towards $18.

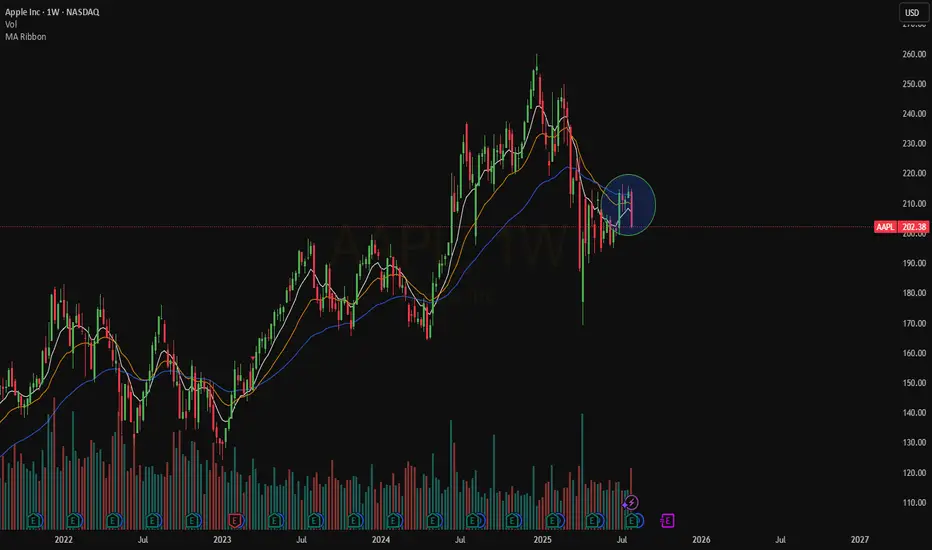
Weekly $AAPLNASDAQ:AAPL on the Weekly is still bearish. The price is trading below our EMAs that are even in a bearish order.
We need a stable move above $217 right now.
Not sure will come soon
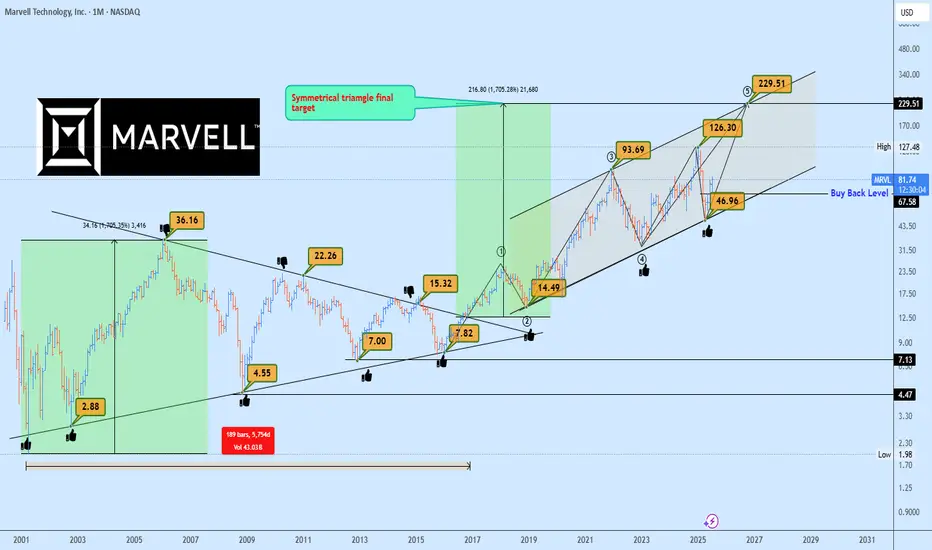
MRVL Massive 15-Years Symmetrical Breakout Targets AheadMarvell Technology (MRVL) has just completed a monumental breakout from a 15-years symmetrical triangle, a rare and powerful long-term accumulation structure. This type of macro consolidation typically precedes a major directional expansion, and in this case, the breakout confirmed bullish continuation.
Currently, MRVL is forming a rising channel structure, with price bouncing cleanly from the lower boundary confirming demand and the continuation phase of the macro move.
The 1:1 projection from the symmetrical triangle gives us a clear target trajectory, with the final leg potentially extending to $229, aligning perfectly with the upper boundary of the rising channel.
In the short to mid-term, the ideal buyback opportunity rests near $67.50, should the market retest previous breakout support or the lower boundary of the channel once more. This zone offers asymmetric risk-to-reward potential for long-term investors and swing traders alike.
Key Targets
📈 $67.50 – Buyback Opportunity Zone
📈 $229 – Rising Channel Top / 1:1 Expansion Target
A breakout this large is no coincidence, it’s backed by years of price compression and institutional positioning. Now is the time to watch closely.
📩 Drop your view in the comments and share your stock requests for quick analysis.
Only stock assets will be accepted under this post.
NVIDIANVIDIA Corporation is a leading American technology company known for designing and manufacturing graphics processing units (GPUs), system-on-a-chip units (SoCs), and AI computing platforms. Founded in 1993, the company originally focused on gaming graphics but has since evolved into a global powerhouse in artificial intelligence, data centers, autonomous vehicles, and high-performance computing. NVIDIA’s GPUs are widely used not only in gaming and visual computing but also in scientific research, AI model training, machine learning, and cloud infrastructure.
In recent years, NVIDIA has been at the forefront of the global AI boom. Its data center business, powered by its high-end GPU architecture (like the H100 and newer generations), has become a critical backbone for tech companies, cloud providers, and governments seeking to build large-scale AI systems. The company also made major strategic moves through acquisitions and software integration, further solidifying its dominance in the AI hardware space. NVIDIA’s strong financial performance and technological leadership led to rapid growth in its market capitalization, briefly making it one of the most valuable companies in the world.
As of August 2025, NVIDIA’s stock is trading at $173.60 per share, following a stock split that adjusted its price while increasing liquidity. Despite broader market volatility, NVIDIA remains a key player driving the AI revolution and is closely watched by investors and analysts. Its valuation continues to be shaped by demand for AI chips, innovation in GPU architecture, and its ability to maintain technological leadership amid growing global competition. NVIDIA stands at the intersection of multiple megatrends, making it a critical stock in both the technology and semiconductor sectors.

Let`s play some pokkerThere`s a pattern ;) So why not..
There`s room to grow min till pre-earnings
Trade safe!

ZM: Cross-Cycle Knot in Triangle🏛️ Research Notes
Original
Alternative Interconnection Experimenting with cross-cycle interconnection so coordinates of the 3 point of fib channels are placed on structure's latest connecting point while abiding its original angles.
When elements are extended we have a projection that looks like this:
Other aspects of the shape are being tested
Fibonacci Channels based on angle of the trend fragments the cycle creating probabilistic levels. (The steeper the angle of the FC the more it relates to time axis.)

$TSLA 3rd Time's a CharmI bottom called NASDAQ:TSLA twice in a row. About to do it a third time today. 312.5C 8/8 @ 4.47 were just bought for $1.3 million.
Huge breakout in Union Bank
After it's Q1 results Union bank is trading near it's previous breakout level, and is ready for a huge upside from here.
If we look at the past trends of Union Bank ( See below Images )
We can clearly see after a correction of about 40 to 50%, share rises with a huge breakout and it always rises for more than 100%.
Whoever missed the opportunity at first, this is the best to get into the stock for a potential profit target of 250.

ACC Ltd. – Triple Bottom Pattern | Swing Trade Setup
ACC Ltd. is currently showing a Triple Bottom formation on the weekly chart, indicating strong support around the ₹1810 - ₹1793 level . This pattern suggests that bearish pressure is weakening and a potential reversal is on the cards.
🔍 Key Technical Highlights:
Triple Bottom: The stock has tested the same support zone three times without breaking down, which is a classic bullish reversal signal.
Price Action: Current price is near the support base, offering a favorable risk-reward entry zone.
RSI: Weekly RSI shows signs of reverse sell divergence, hinting at a potential shift in momentum.
📈 Strategy:
This is a swing trading idea based on weekly chart structure. Entry is planned near the current level with a stop-loss slightly below the support zone. I plan to use pyramiding to add positions if momentum continues after breakout above neckline resistance.
⚠️ Disclaimer:
This analysis is for educational and informational purposes only. It is not intended as investment advice or a recommendation to buy or sell any securities. I am not a SEBI-registered advisor. Please do your own research and consult with a registered financial advisor before making any investment decisions. Trading and investing involve significant risk.

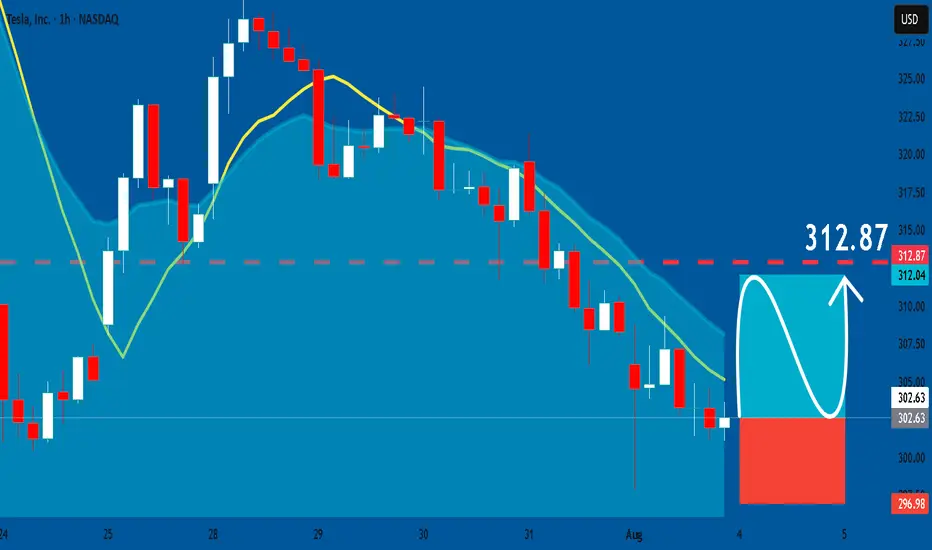
TESLA: Bullish Continuation & Long Trade
TESLA
- Classic bullish setup
- Our team expects bullish continuation
SUGGESTED TRADE:
Swing Trade
Long TESLA
Entry Point - 302.63
Stop Loss - 296.98
Take Profit - 312.87
Our Risk - 1%
Start protection of your profits from lower levels
Disclosure: I am part of Trade Nation's Influencer program and receive a monthly fee for using their TradingView charts in my analysis.
❤️ Please, support our work with like & comment! ❤️
Ultratech can bounce back from Motherline support. UltraTech Cement Ltd. is a holding company, which engages in the provision of manufacture and sale of cement and cement related products.
UltraTech Cement Ltd. Closing price is 12113. The positive aspects of the company are Companies with Zero Promoter Pledge, Companies with Low Debt, FII / FPI or Institutions increasing their shareholding and MFs increased their shareholding last quarter. The Negative aspects of the company are high Valuation (P.E. = 51), Stocks Underperforming their Industry Price Change in the Quarter, RSI indicating price weakness, Increasing Trend in Non-Core Income and Declining Net Cash Flow : Companies not able to generate net cash.
Entry can be taken after closing above 12136 Historical Resistance in the stock will be 12324 and 12531. PEAK Historic Resistance in the stock will be 12725 and 13023. Stop loss in the stock should be maintained at Closing below 11798 or 11492 depending upon your risk taking ability.
Disclaimer: The above information is provided for educational purpose, analysis and paper trading only. Please don't treat this as a buy or sell recommendation for the stock or index. The Techno-Funda analysis is based on data that is more than 3 months old. Supports and Resistances are determined by historic past peaks and Valley in the chart. Many other indicators and patterns like EMA, RSI, MACD, Volumes, Fibonacci, parallel channel etc. use historic data which is 3 months or older cyclical points. There is no guarantee they will work in future as markets are highly volatile and swings in prices are also due to macro and micro factors based on actions taken by the company as well as region and global events. Equity investment is subject to risks. I or my clients or family members might have positions in the stocks that we mention in our educational posts. We will not be responsible for any Profit or loss that may occur due to any financial decision taken based on any data provided in this message. Do consult your investment advisor before taking any financial decisions. Stop losses should be an important part of any investment in equity.

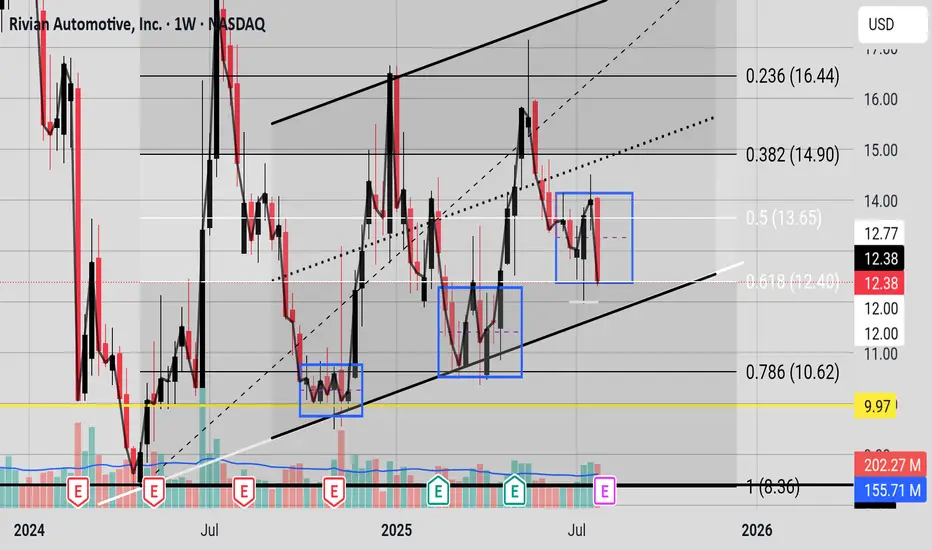
Blue Boxes of ConsolidationIt seems the last two major moves on the chart (in the blue boxes) there was heavy consolidation for seven to 10 candlesticks, in this chart seven to ten weeks before a breakout. The bears now have a strong bearish candle but it is still in a consolidation pattern. The Bulls still have a trendline that held from April 2024 where price has not closed below it (please see SMA curve in black on the chart). If you turn on the 50 EMA price is still oscillating around it. And price is still in the Fibonacci golden zone. The bears need a bearish close with follow through below 12.40 and the bulls need a bullish close above 13.65 to hopefully kick off their party. The Bulls have a historical trendline and the Bears have a bearish MACD(Chris Moody) and a Braid filter that just flashed red and a recent strong bearish candle.
PSO buying Strategy📈 Trade Setup: PSO Call Buy
Buy Zone: 411 – 390
Stop Loss (SL): 380
Target 1: 433
Target 2: 460
further hold if sustain above 460 or use a trailing stop loss

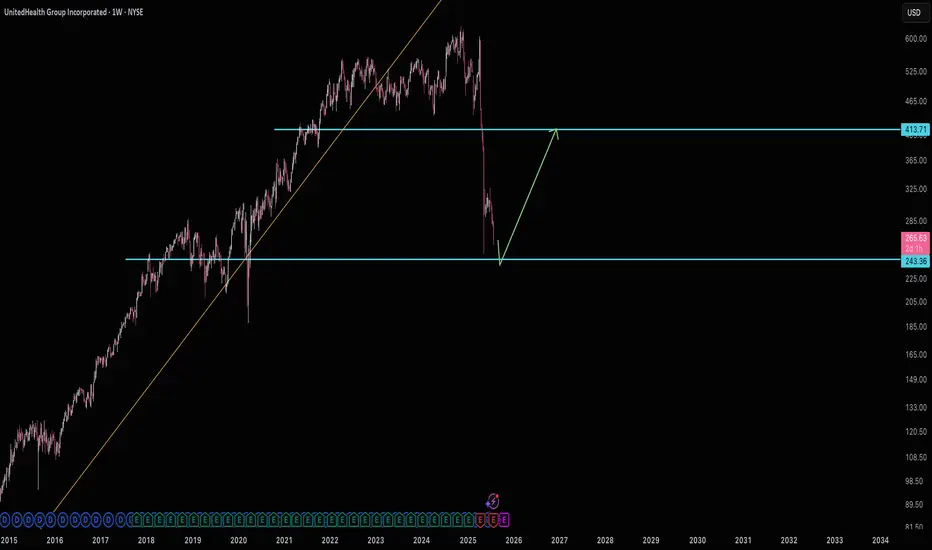
Waiting for $243 United HealthUNH has obviously taken a beating. It's managed to get so close to support many a few times now, yet hasn't hit yet. So if $243 does hit, then plan on targeting $410.
Good luck!
8/1/25 - $mstr - Selling spot and buying MSTR8/1/25 :: VROCKSTAR :: NASDAQ:MSTR
Selling spot and buying MSTR
- keeping it (purposefully) short today for everyone's benefit
- sold a bit of OTC:OBTC (which is nearly 15% off spot, e.g. $100k/BTC) to buy NASDAQ:MSTR MSD exposure here
- why?
- 1.6x mNAV is lowest it's been (nearly ever in current BTC move)
- Saylor not going to hit the ATM sub 2.5x, will run it hot
- Latest product further augments this runway to value accretion
- BTC still remains REALLY well bid in this current tape
- So math is like this
- ROE of BTC in "conservative" sense is 25%
- Kc (cost of capital) for Strategy is 10% again (conservative, it's really sub 10%)
- so ROE/Kc (without growth) = 2.5x book.
- A real ROE for BTC (remember this is permanent capital he's tapping, so no asset-liability mis-match) is 35%
- True Kc for this is sub 10%, but let's still say 10%. that's 3.5x book.
Therefore let's even say 2x book (below both of the above) is 2/1.6 = 25% upside. If/do you think that BTC can go back to low 90s, ofc this might contract further (the 1.6x) but at the same time, you have EVEN higher implied ROE and R/R only improves.
So at a minimum, i'd guess your R/R is "balanced" here in the most conservative scenarios. And if we do get BTC bid, this will rocket at this stage thru YE and far exceed px appreciation of it's BTC pair.
Ok that was longer than I intended. Felt important to convey math and up/downside parameters.
Be well. Everyone loses money in correlation 1. Just make sure you find the betas that have the first bids. Right now that's BTC and some quality names doing 6-7% fcf yields and growing.
I like
OTC:OBTC (adding fuel w/ my NASDAQ:MSTR calls)
NASDAQ:NXT
NYSE:DECK
NASDAQ:LULU
NYSE:FI
<3
V
$UNH BEARISH SETUP – WEEK OF AUG 1
🔻 **\ NYSE:UNH BEARISH SETUP – WEEK OF AUG 1** 🔻
**UnitedHealth Group (UNH)** is showing classic breakdown signs. Here’s what the data says:
📉 **RSI Breakdown**
• Daily RSI: **20.6**
• Weekly RSI: **19.3**
→ Deeply oversold + no bounce = 🚨 momentum flush risk
📊 **Volume Surge**
• Weekly Volume: **145M** (1.9x avg)
→ Heavy **institutional selling**, NOT dip buying
🧠 **Options Insight**
• Call/Put Ratio: **1.17** = Slight bullish noise
• But... Expiry Gamma is 🚨HIGH = IV Crush incoming
• VIX: **20.7** = Volatility tailwinds intact
💣 **TRADE IDEA (PUT PLAY)**
• Direction: **BUY PUTS**
• Strike: **\$230**
• Expiry: **08/08/2025**
• Entry: **Monday Open**
• Target Premium: **\$0.10**
• 🎯 PT: \$0.30 | 🛑 SL: \$0.03
• Confidence: **70%**
📌 **Narrative**:
Oversold + High Volume Dump + No support bounce = Perfect storm for continuation dump. This is a high gamma play, time-sensitive, low-cost lotto setup. Risk small. Aim big.
---
💥 **Watchlist Tag**: ` NYSE:UNH AMEX:SPY AMEX:XLV `
🧠 **Strategy Tag**: #OversoldFlush #PutPlay #0DTETrap
🚀 Follow for more weekly earnings & options breakdowns!

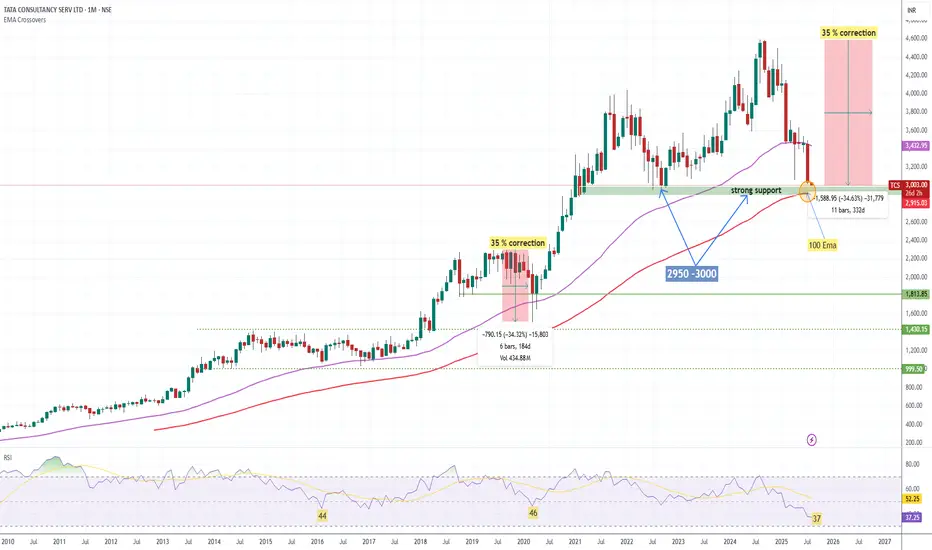
"TCS Takes a COVID-Style Dive Again – Is It Time to Buy?"Price Action History:
During the COVID crash, TCS fell nearly 35% from its top, eventually taking support at the 100 EMA on the monthly chart and staging a strong bounce.
In 2022 (June,july,Sep,Oct), around 3000 zone was tested multiple times, followed by a significant rally.
📊 Current Scenario:
Once again, TCS is trading near the ₹2950–₹3000 zone, which coincides with the 100-month EMA – a historically proven support level.
Price action suggests we are at a critical inflection point similar to past major bottoms.
✅ Key Technical Levels:
Support Zone: ₹2950–₹3000 (100 EMA Monthly+ 2022 support level)
Immediate Resistance: ₹3300–₹3400
Upside Potential: A bounce similar to COVID & 2022 patterns could trigger a strong upside move.
Trading Strategy:
if you are short term trader Keep a strict stop-loss below ₹2900 (monthly close basis) or 100 monthly EMA
Position sizing is key – don’t over-leverage.
🔎 Conclusion:
For long term trader This zone has historically acted as a strong accumulation area for long-term investors. If history repeats, this could be a high probability buying opportunity for swing and positional traders.
Fundamental Factor
Net Profit (Q1 FY26) ₹12,760 cr (+6% YoY)
Revenue Growth +1.3% YoY (−3.1% in CC)
Operating Margin 24.5% (↑30 bps QoQ)
Trailing P/E 22× (vs 5‑yr average ~24‑26×)
Dividend Yield 2.0%
ROE /ROCE 52%/64%
Monthly Breakout.PPL Analysis
Closed at 181.78 (01-08-2025)
Monthly Breakout.
Extremely Bullish; potential to touch 240+
However, it should not break 128 now.
174 - 175 & then 165 - 167 seems to be a
Good Support level.
