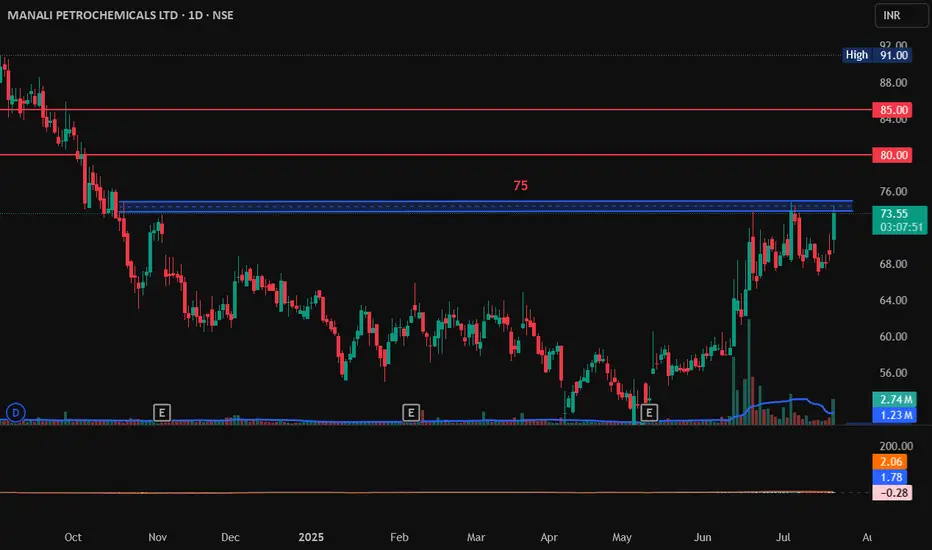
MANALI PETROCHEMICALS LTD, Breakout, LongMANALI PETROCHEMICALS LTD has raised 6% today and its near the resistance zone of 75. If it breaks this 75 and sustain it with Bullish candlestick patterns like Bullish Engulfing, Hammer & Inverted Hammer, Piercing Line, Morning Star, Three White Soldiers, Tweezer Bottoms or Bullish Harami.
Entry on Bullish pattern: 75
Target1: 80
Target2: 85.
SL: 70.
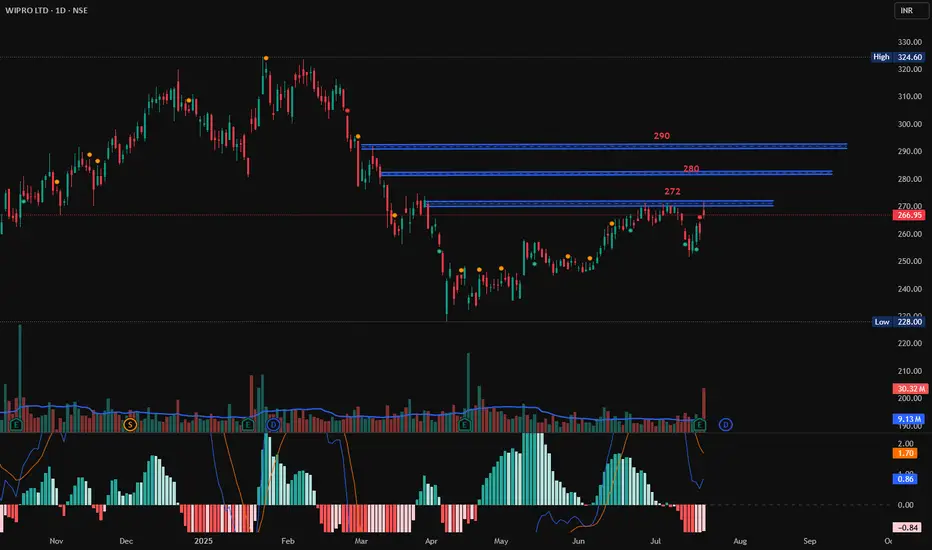
Wipro at Resistance, Long, 1DWipro has shown huge volume traded today however it has not broken a resistance which is at 272. If it breaks 272 with Bullish candlestick patterns like Bullish Engulfing, Hammer & Inverted Hammer, Piercing Line, Morning Star, Three White Soldiers, Tweezer Bottoms or Bullish Harami, then enter at 272 with small targets of 280 and 290.
Entry: 272 (only at Bullish candlestick pattern)
Target1: 280
Target2: 290
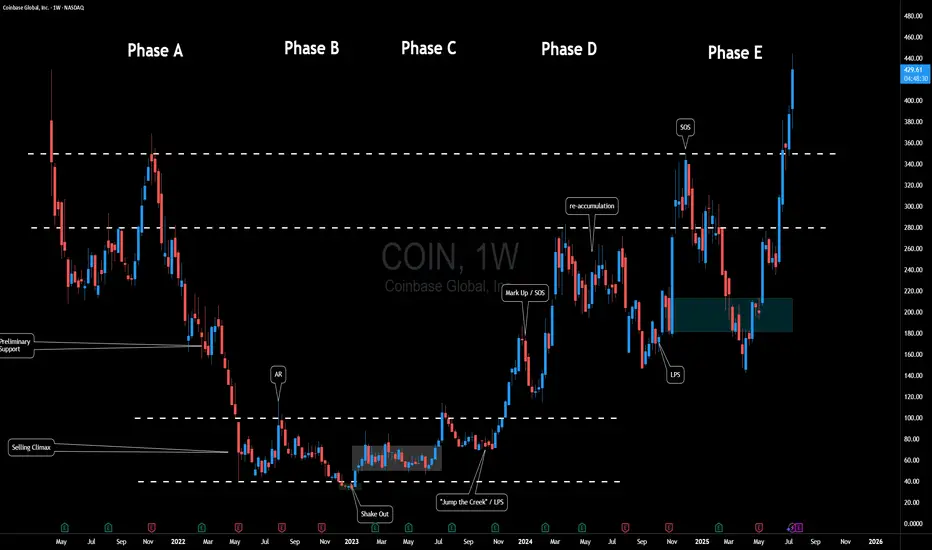
$COIN Fun Wyckoff InterpretationHere's a fun Wyckoff-inspired take on Coinbase Global ( NASDAQ:COIN ) over the past few years, mapping its weekly chart to the classic Accumulation Schematic. Wyckoff's method, envisioning the "Composite Man" quietly scooping up shares during weakness before blasting off... fits COIN perfectly, especially in crypto's wild swings.
We can see a textbook multi-year accumulation from mid 2022, a breakout into markup in 2024, and even a cheeky re-accumulation mid-2024 to fuel the latest highs.
Phase A: Stopping the Downtrend
After the initial IPO Coinbase experienced quite a bit of downside pressure.
Eventually price began to range between $40 and $100.
Phase B: Building Cause
Months of boring sideways chop.
Sellers exhausted because let's think for a moment... If crypto was truly going to stick around - how much lower could this thing go?
Smart money absorbs.
Phase C: The Trap
That shakeout low at ~$32 in early 2023. If you study Wyckoff, this is Schematic #1 vibes.
Phase D: Demand Dominates
Explosive rally (SOS) to ~$280 in early 2024, breaking the range on surging volume.
Mid-2024 pullback to ~$150 acts as a mini Re-Accumulation with its own LPS at the low. Higher lows / mitigation confirm no real distribution yet. Another SOS post-re-accumulation, pushing toward $400+.
Phase E: Markup Phase
Where will the composite man be eyeing for the next target?
Overall, Crypto adoption's heating up (BTC ETF flows, regulatory, etc), and the chart's still in a strong uptrend. But remember, Wyckoff's not crystal ball... it can however be used as a roadmap to navigate the chart.
Fun fact: COIN often mirrors BTC, so keep an eye out for correlation.
What's your opinion - accumulation complete or more shakeouts ahead? 🚀📈
Disclaimer: Not financial advice; DYOR! Chart based on weekly data up to July 2025.
AMZN Short1.Liquidity Landscape
Buy-Side Liquidity Cleared:
Liquidity above the recent swing high was taken — likely triggering breakout traders and stop orders from earlier shorts.
This move appears to be a classic liquidity raid before a reversal.
Sell-Side Liquidity in Focus:
Price is now targeting sell-side liquidity resting below recent higher lows (e.g., below ~222 and especially near 218.50).
This aligns with the direction of your arrow, suggesting price may hunt liquidity pools beneath internal lows.
2. Confirmation via Reaction
The strong rejection from that supply zone confirms no intent to hold price above 227, meaning that was likely a liquidity raid, not a genuine breakout.
Price has already broken below the midpoint (0.5 level at 222.85), adding confidence to the short bias.
3. Liquidity Targets Below
The next likely targets are sell-side liquidity pools resting below:
Around 218.50 (marked zone)
Deeper lows near 211–212, and potentially 208–209, where untouched demand and previous stop clusters lie.

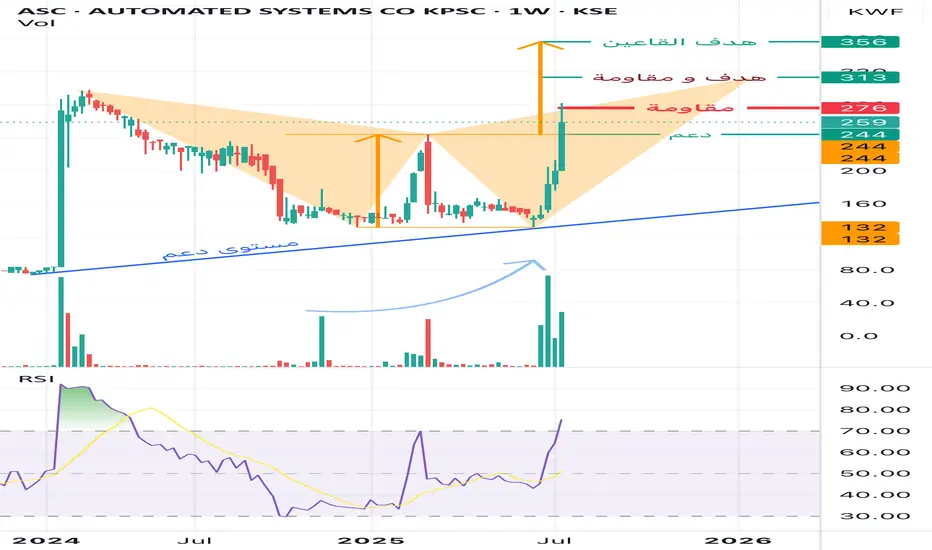
Automated Systems Co. (ASC) – Weekly ChartThe stock has successfully reached the initial target as per the previous analysis. Upon re-evaluation, further bullish potential is evident, but key resistance levels may interrupt immediate upside continuation.
1. Resistance and Potential Retracement:
• The stock is currently facing a strong resistance at 276 KWF, which has temporarily capped the current rally.
• A pullback to the 244 KWF support level is possible, serving as a healthy retest before any renewed breakout attempt.
2. Harmonic Pattern – Shark 🦈:
• The current structure aligns with a Shark harmonic pattern, projecting a target at 313 KWF, which also coincides with a major resistance level.
• Due to this confluence, the 313 level serves both as a target and a barrier, making it a critical decision point for bulls and institutional players.
3. Double Bottom Formation (Pattern Analysis):
• A symmetrical double bottom pattern is visible, suggesting a more extended bullish outlook.
• This pattern projects a potential longer-term target at 356 KWF, which could be the area where smart money (market makers) aim to unload positions.
4. Volume and Momentum:
• Volume has shown a noticeable increase, reflecting growing market interest and accumulation.
• The RSI indicator has surged sharply but is approaching overbought territory, indicating momentum is strong, though some cooling may occur.
Consclusion
• The stock remains in a bullish structure, but is currently testing a key resistance level.
• A pullback to 244 would be technically constructive if followed by a breakout above 276.
• If 276 is breached decisively, the next objectives would be:
• Target 1 / Resistance: 313 KWF (Shark pattern)
• Target 2: 356 KWF (Double Bottom pattern)
Recommendation:
Monitor price behavior around 276. A successful breakout with volume confirmation opens the way toward 313 and beyond. A pullback to 244 can be considered a strategic re-entry opportunity within the broader bullish framework.
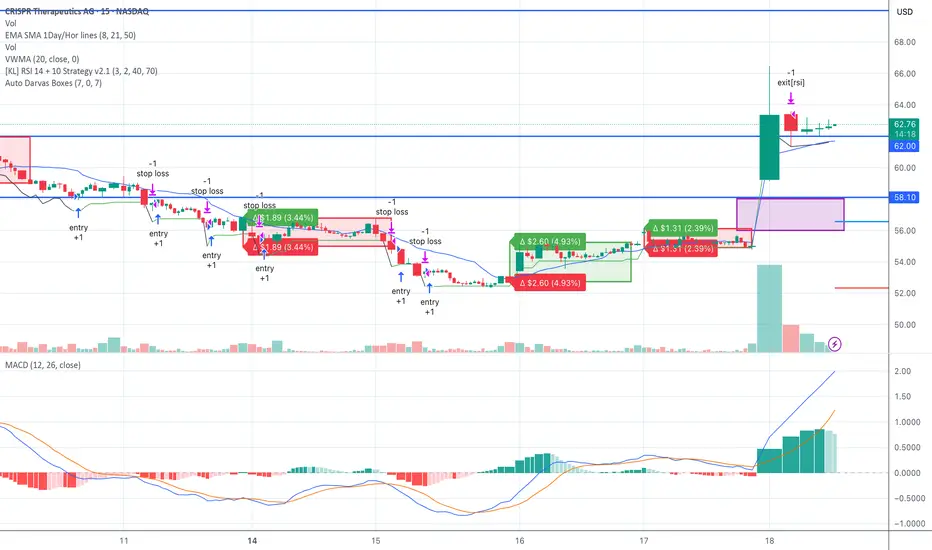
CRSP – Biotech Breakout After Insider Accumulation | Seed SystemNASDAQ:CRSP just cleared its Darvas Box top with momentum, volume, and trend all aligning.
Seed System confirmation:
Darvas Box breakout at $56–58
Massive volume surge following insider/institutional buying (ARK, UBS, T. Rowe)
EMA stack bullish (9 > 21 > 50)
VWMA trending up, price riding the band
MACD bullish cross, RSI moving through 70
Setup:
Entry Zone: $60.00–62.00 (watch for pullback)
Stop Loss: $58.00
Target 1: $70.00
Target 2: $80.00+
Catalyst: Positive CTX310 gene therapy results (LDL & triglyceride drops up to 80%), and biotech sector strength. RS Rating now 85 — breakout quality.
Expecting a retest of the breakout before continuation. Strong long setup if biotech sector holds.
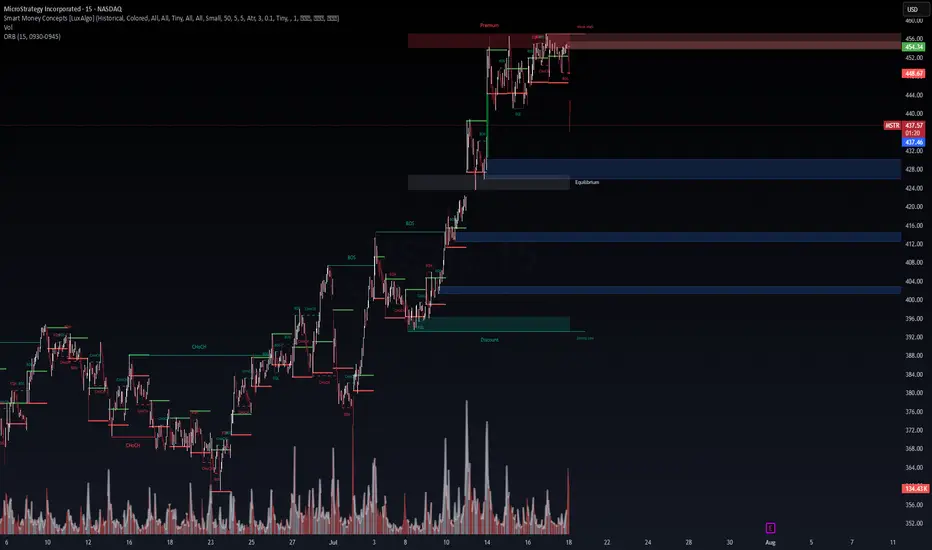
WaverVanir VolanX Protocol – Short Thesis: MSTR🔻 WaverVanir VolanX Protocol – Short Thesis: MSTR
Timeframe: 15-Min | Bias: Bearish | As of: July 18, 2025
Disclaimer: For educational and illustrative purposes only. Not financial advice.
🧠 Thesis Summary:
MicroStrategy (MSTR) has broken market structure at a key premium zone, rejecting from the weekly high, with strong volume confirming distribution. The smart money appears to have exited positions, leaving behind a clear imbalance and liquidity void below.
🔍 1. Smart Money Concepts Breakdown
Premium Zone Rejection (454–456): Price rejected from a premium inefficiency pocket, tagged liquidity, and failed to make a new high.
Internal CHoCH and BOS at Top: Multiple Change of Character (CHoCH) and Break of Structure (BOS) events indicate smart money is offloading.
Fair Value Gap (FVG) Below: Several unmitigated FVGs below (≈412, ≈404, ≈396) serve as magnets for price.
⚠️ 2. Liquidity Sweep Confirmed
Equal Highs Taken Out: Perfect setup for liquidity engineering – retail traders trapped long above 454.
Displacement Candle: Sharp move down post-sweep confirms institutional sell-off.
Volume Spike at Breakdown: Selling volume surged on the red candle through 440 support, indicating urgency from sellers.
🧮 3. ORB Breakdown & VolanX ORB Confluence
Opening Range Breakdown (ORB 15min): ORB low at 448.67 was decisively broken.
Current price: 436.30, firmly below both ORB midpoint and low – signaling bearish continuation.
🧭 4. Probabilistic Price Targets
Target Area Price Level Rationale
TP1 428.00 Equilibrium block
TP2 412.00 Imbalance fill + previous BOS
TP3 396.00 Deep discount zone + Strong Low
Stop Loss: Above 456
Risk-Reward (TP2): 1:3+
Volatility: Elevated (Vol: 129.97K)
🧩 5. Macro & Correlation Risk
Bitcoin Correction Imminent: MSTR is heavily correlated to BTC. Any weakness in crypto adds pressure.
Rate Cut Uncertainty: Hawkish Fed tone or delayed cut could hurt growth narratives and tech multiples.
📉 Summary:
This is a high-probability short setup powered by:
Premium zone rejection
Clear BOS and CHoCH pattern
Strong volume confirmation
ORB breakdown alignment
Liquidity engineering dynamics
VolanX Protocol flags this as a Strategic Short Opportunity targeting liquidity zones below.
🔻 Suggested Trade (Illustrative)
plaintext
Copy
Edit
Entry: 440–436
Stop: 456
Target 1: 428
Target 2: 412
Target 3: 396
#WaverVanir #VolanXProtocol #MSTR #SmartMoneyConcepts #ORB #ShortSetup #LiquiditySweep #DirectionalBias
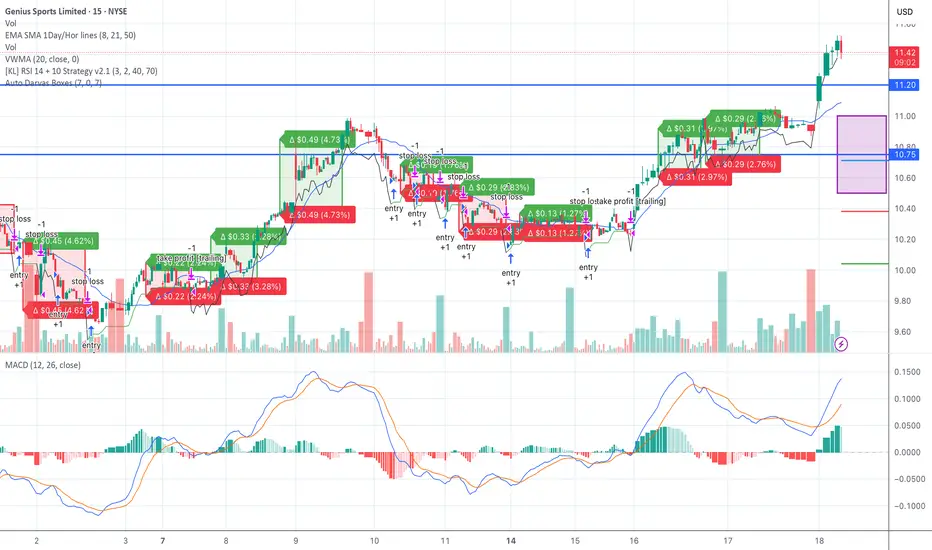
GENI – Clean Breakout Through Darvas Box | Seed System SetupNYSE:GENI broke through its 52-week high with strong volume and clean technical structure.
This fits our Seed System criteria:
Darvas Box breakout from $10.50–11.00
Volume spike confirms institutional interest
EMA stack bullish (9 > 21 > 50)
VWMA trending upward, price holding above
MACD and RSI confirm momentum
Setup:
Entry Zone: $11.00–11.20 (on pullback)
Stop Loss: $10.75 (tight) or $10.50 (structure low)
Target 1: $12.50
Target 2: $14.00
GENI has fundamental backing as well—expanding data rights through 2030 and a recent $100M buyback plan. Momentum is supported by growth in the sports data and betting sector.
Waiting for a retest toward the breakout level for optimal entry. Clean trend with room to run.
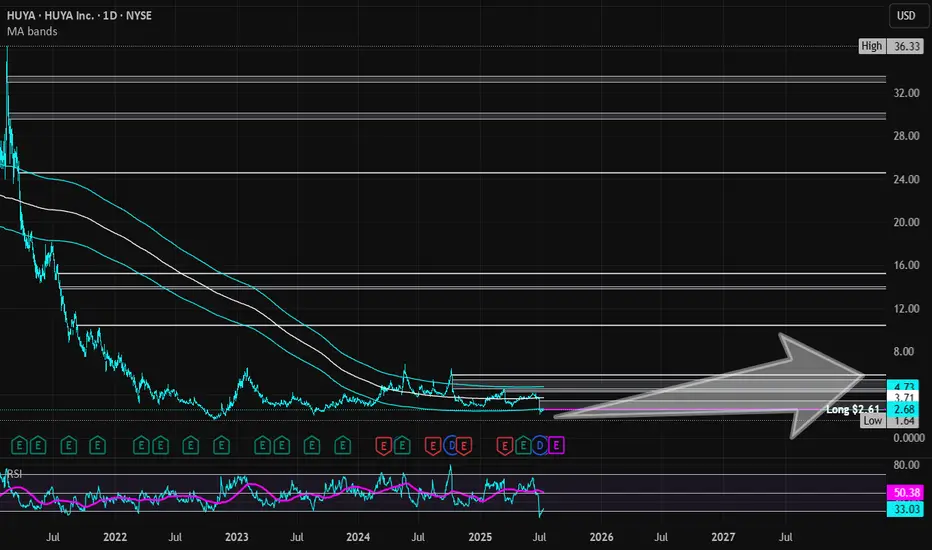
HUYA | HUYA | Long at $2.61HUYA NYSE:HUYA operates game live streaming platforms in China. This stock got my attention based on the reported fundamentals and price position, but moderate "Chinese delisting" risks exist given the US's new political administration.
Book Value = $3.23 (Undervalued)
Forward P/E = 4.1x (Growth)
Debt-to-equity = 0x (Healthy)
Quick Ratio = 1.56x (Healthy)
Altman's Z Score = <1.8 (Bankruptcy risk is relatively high)
From a technical analysis perspective, the stock price momentum has shifted upward based on the historical simple moving average. The price often consolidates within and slightly outside of this simple moving average band before progressing higher (after a long period of selling). While near term-declines are a risk, a longer-term hold (if the fundamentals do not change and delisting doesn't occur) may pay off given the value, growth, and overall health of the company.
Thus, at $2.61, NYSE:HUYA is in a personal buy zone.
Targets into 2028:
$3.45 (+32.2%)
$5.80 (+122.2%)
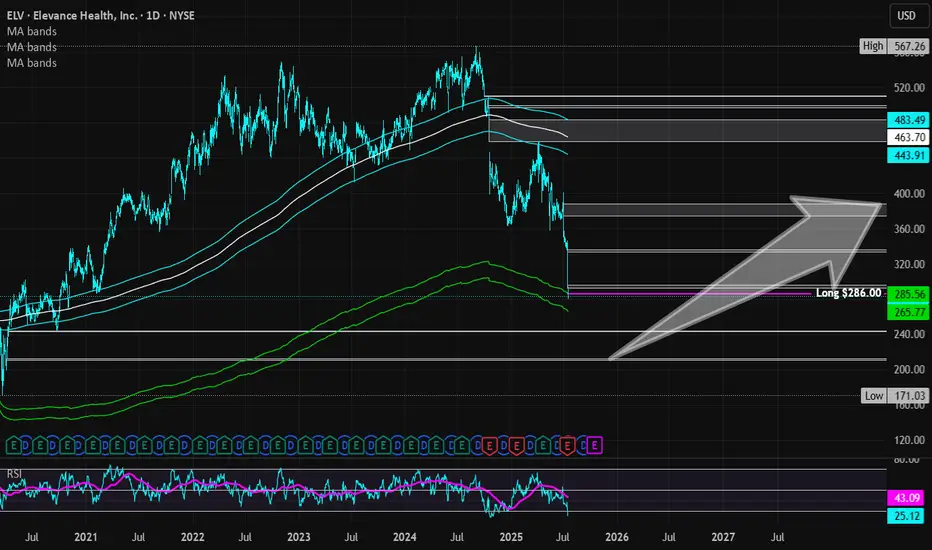
Elevance Health | ELV | Long at $286.00What are seeing in the healthcare and health insurance provider industry right now is destruction before a once-in-a-lifetime boom. The baby boomer generation is between 60 and 79 right now and the amount of healthcare service that will be needed to serve that population is staggering. Institutions are crushing them to get in - it's just near-term noise, in my opinion. My personal strategy is buy and hold every healthcare opportunity (i.e. NYSE:CNC , NYSE:UNH , NYSE:HUM etc).
Elevance Health NYSE:ELV just dropped heavily due to lower-than-expected Q2 2025 earnings, a cut in full-year profit guidance from $34.15-$34.85 to ~$30 EPS, and elevated medical costs in Medicaid and ACA plans. It's near-term pain (may last 1-2 years) which will highly likely lead to long-term growth. The price has touched my historical simple moving average "crash" band. I would not be shocked to see the price drop further into the $260s before a rise. However, the near-term doom could go further into the year. I am anticipating another drop to the "major crash" simple moving average band into the $190s and $220s to close out the remaining price gaps on the daily chart that occurred during the COVID crash. Not to say it will absolutely reach that area, but it's locations on the chart I have for additional buys.
Thus, at $286.00, NYSE:ELV is in a personal buy zone (starter position) with more opportunities to gather shares likely near $260 before a bounce. However, if the market or healthcare industry really turns, additional buys planned for $245 and $212 for a long-term hold.
Targets into 2028:
$335.00 (+17.1%)
$386.00 (+35.0%)
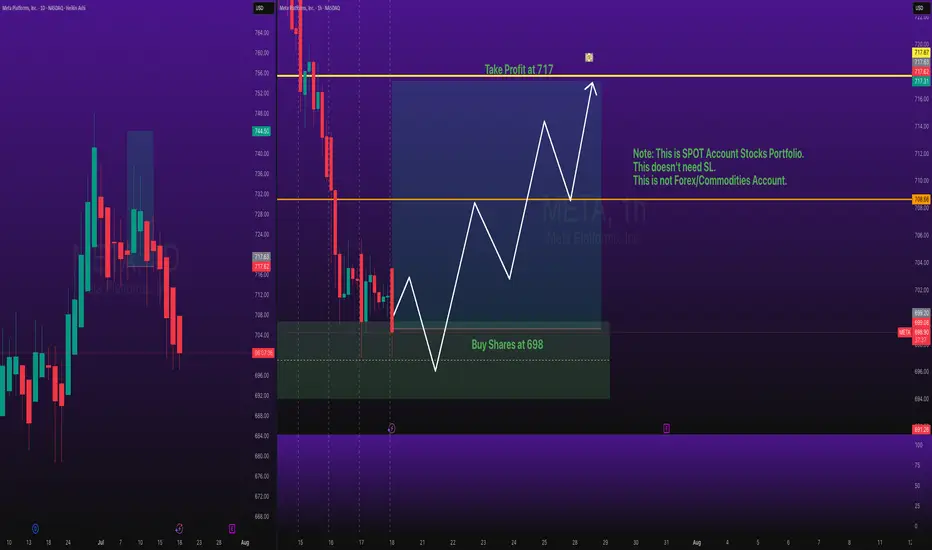
Stocks SPOT ACCOUNT: META Shares Buy Trade with Take ProfitStocks SPOT ACCOUNT:
NASDAQ:META shares: my buy trade with take profit.
This is my SPOT Accounts for Stocks Portfolio.
Trade shows my Buying and Take Profit Level.
Spot account doesn't need SL because its stocks buying account.
Looks good Trade.
Disclaimer: only idea, not advice
big volume Stock bottoms often carve out classic volume patterns that let observant traders make fast and accurate calls.
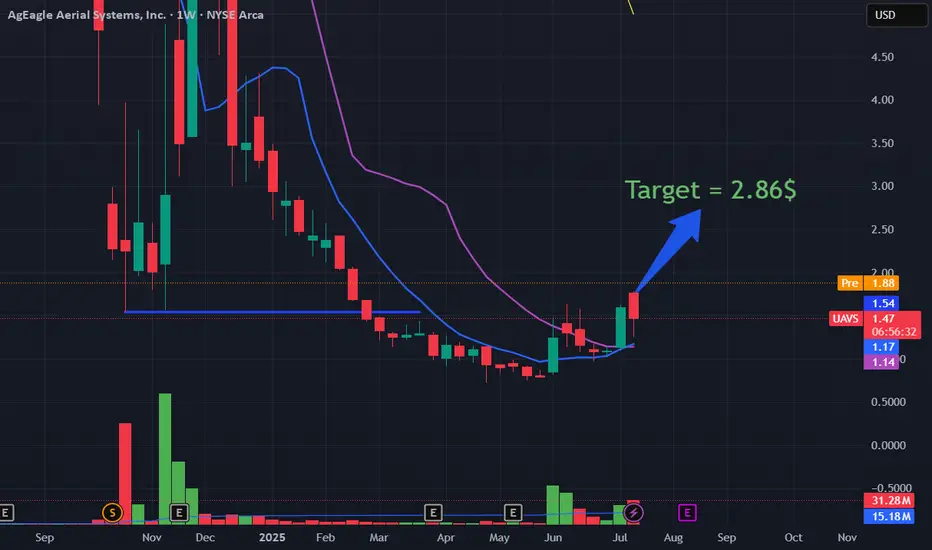
UAVS about to give 100% gainsShort post: UAVS has positive news on receiveing government approval. It has also seen a major volume spike recently and I expect it to go to 2.86 soon. If this breaks 2$ today then next target is 2.45lvl.
tradingview.sweetlogin.com
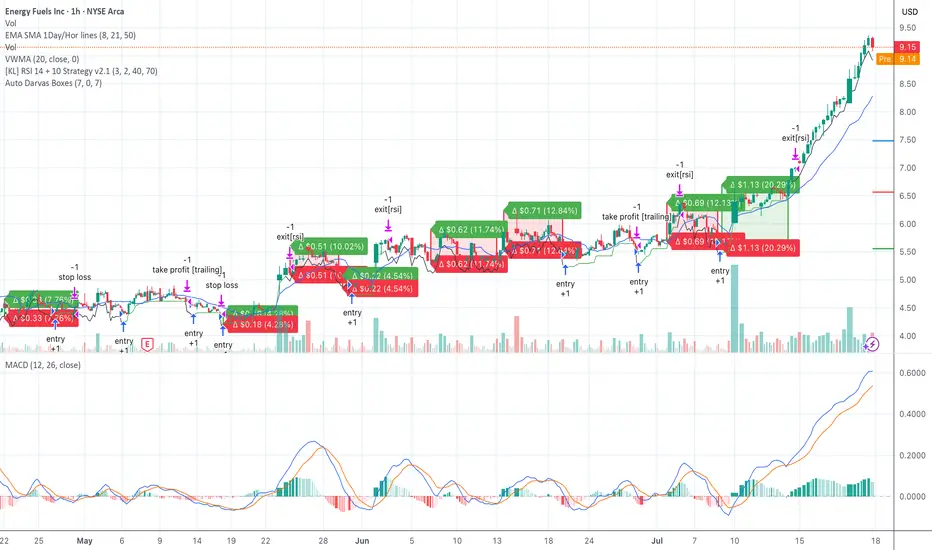
UUUU Confirmed Breakout — Riding Volume, Momentum, and StructureEnergy Fuels (UUUU) continues to show strength as it cleanly breaks out of the $7.40–$7.90 Darvas Box range. Our Seed System captured multiple entries throughout consolidation and rode the move above $8 with clear trend confirmation.
Currently:
VWMA: $8.28 — riding above with strength
MACD: Strong, rising, bullish crossover
RSI: Elevated but still trending strong
Volume: Surging on each breakout leg
Entry was confirmed on break of $7.91 with stop below $7.40
Targets: $9.50 and $10.20
This setup aligns structure, momentum, and volume — a textbook Seed System breakout play.
#UUUU #SeedSystem #Breakout #DarvasBox #VWMA #MACD #SwingTrade #Uranium
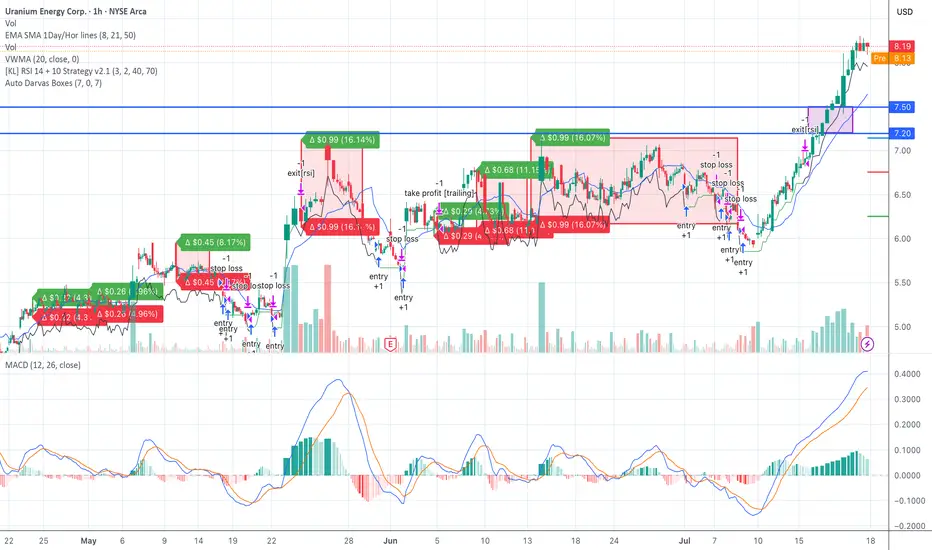
UEC Breakout Confirmed — Seed System Entry Active Above $7.50UEC confirmed a breakout above the $7.20–$7.50 Darvas Box we've been tracking.
Entry triggered at $7.51 on rising volume. Price is holding above VWMA ($7.64) and the EMA stack (8, 21, 50). MACD is showing strong momentum, and RSI remains in a healthy range.
Target 1: $8.50
Target 2: $9.00
Stop loss: $7.20
This is a textbook Seed System setup — breakout from a clean range with all signals aligned.
Let me know if you're in this trade or watching other uranium plays.
#UEC #SeedSystem #BreakoutTrade #DarvasBox #VWMA #MACD #UraniumStocks #SwingTrading
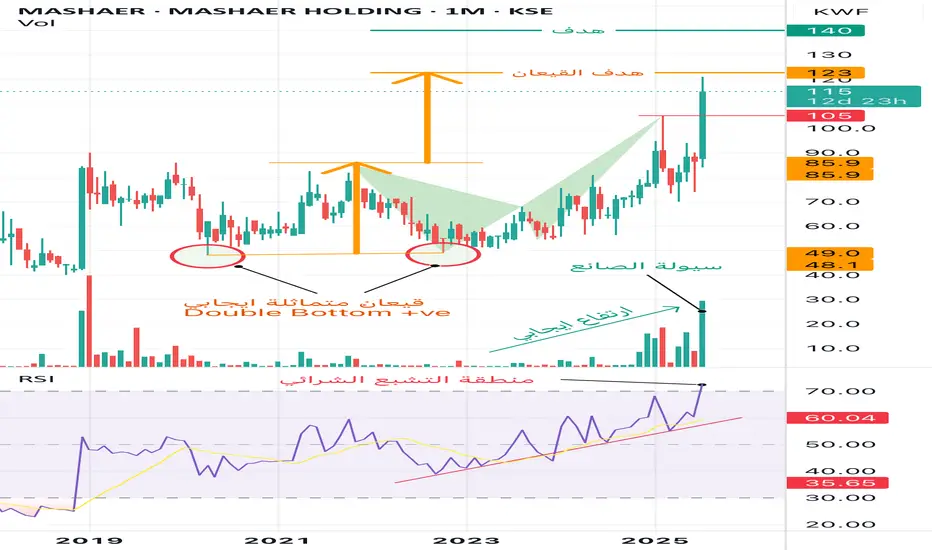
Mashaer Holding – Monthly ChartThe stock maintains a clear upward trend, with no current negative technical signals. This suggests a high probability of continued price appreciation toward higher target levels.
Detailed Analysis:
1. Chart Pattern – Double Bottom:
• A positive symmetrical double bottom has been completed, which is one of the strongest bullish reversal patterns.
• The measured target from the pattern (based on the neckline breakout) projects a price level of 123 KWF.
• The current price is 115 KWF, indicating more room for upside.
2. Volume and Liquidity:
• A noticeable surge in trading volume during the latest monthly candle reflects strong institutional inflow.
• This increase is often referred to as “smart money” activity, suggesting accumulation by major players.
3. RSI – Relative Strength Index:
• The RSI has moved into the overbought territory (above 70), signaling that the stock is potentially overextended in the short term.
• However, there are no signs of bearish divergence or a clear reversal signal yet.
• The RSI trend has been consistently rising for several months, supporting the ongoing bullish momentum.
Summary:
The stock remains technically bullish, supported by a valid breakout pattern, rising volume, and strong momentum indicators. Despite the RSI entering overbought levels, the lack of any confirmed reversal signal means the uptrend remains intact.
Price Targets:
• Pattern Target (Double Bottom): 123 KWF
• Strategic Resistance / Long-Term Target: 140 KWF
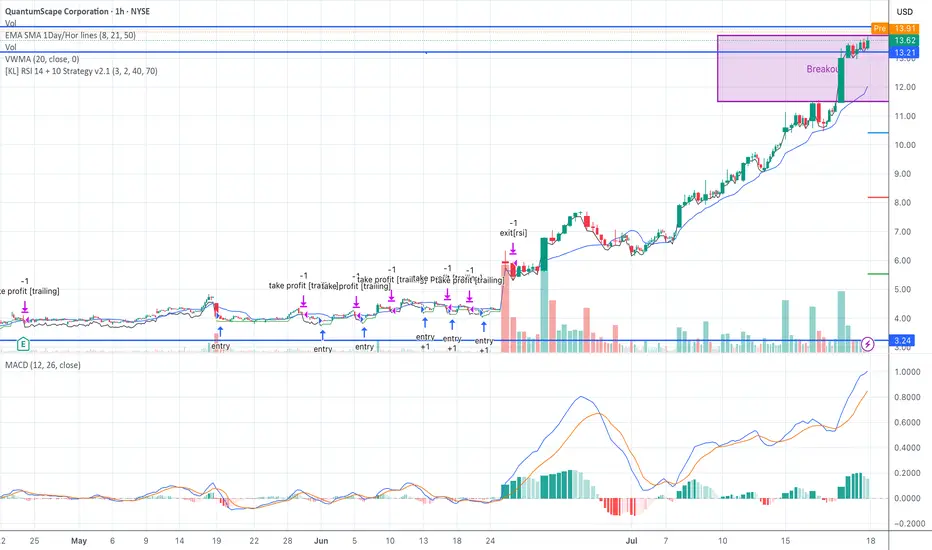
QS Re-Tested Box Top – Waiting for $14.10 + VolumeQS is currently re-testing this morning’s high at $13.79 (box top).
VWMA and EMA alignment are bullish. MACD remains strong.
Plan: Buy above $14.10 on volume, stop at $13.20, trim at $15.00, extended target $16.50.
#QS #SeedSystem #DarvasBox #BreakoutWatch #VWMA #LiveUpdate
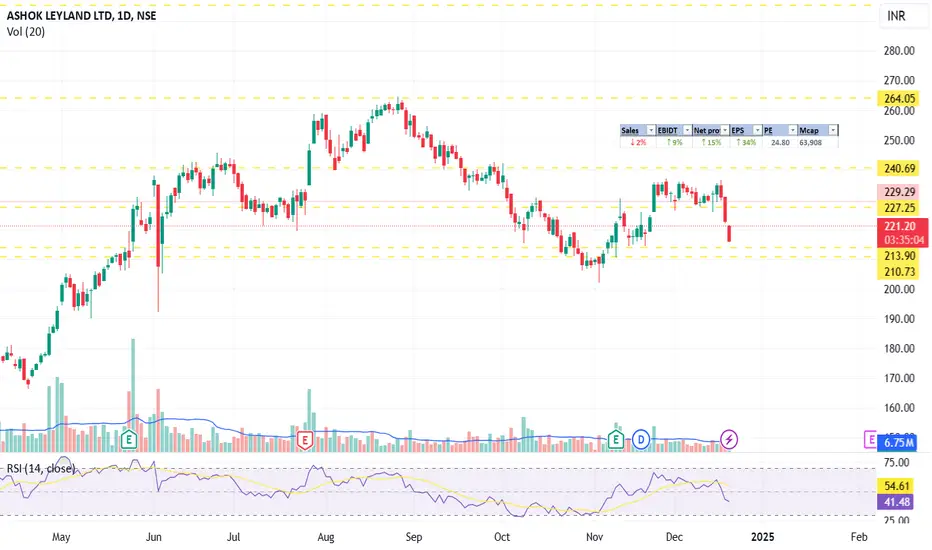
Long Term Investment cum Trading Idea ( FnO Stock)ASHOKLEY LTP 217
Tgt:242/264/295🤞🏻
Long-term: 328/399/432🤞🏻🤞🏻
May add more on dips till 206-191
For investors with a long-term perspective and the ability to add on dips or hold calmly.
Time Frame: 4 to 12 months 🤞🏻
Trade as per your risk management and investment plan.
#luv4stockmarket
#scammersfreetrading
#atmanirbharinvesting
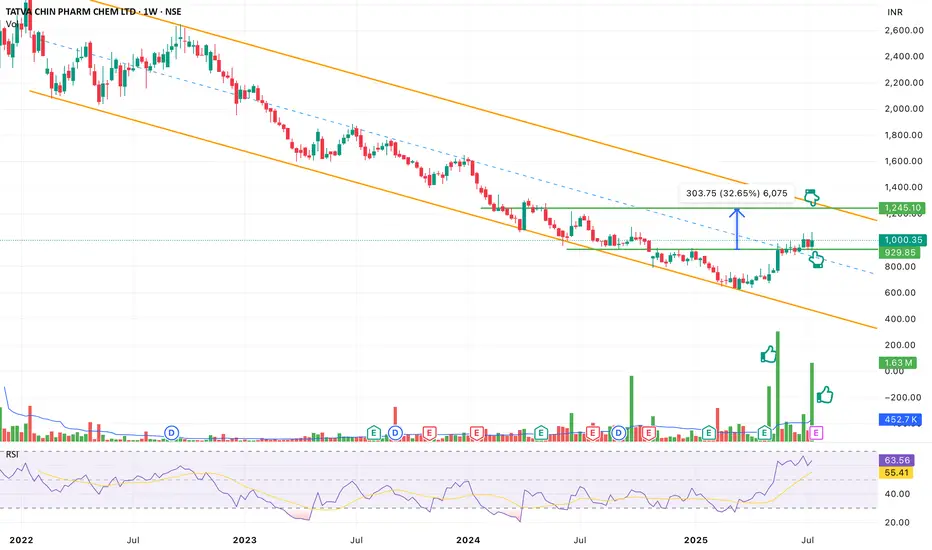
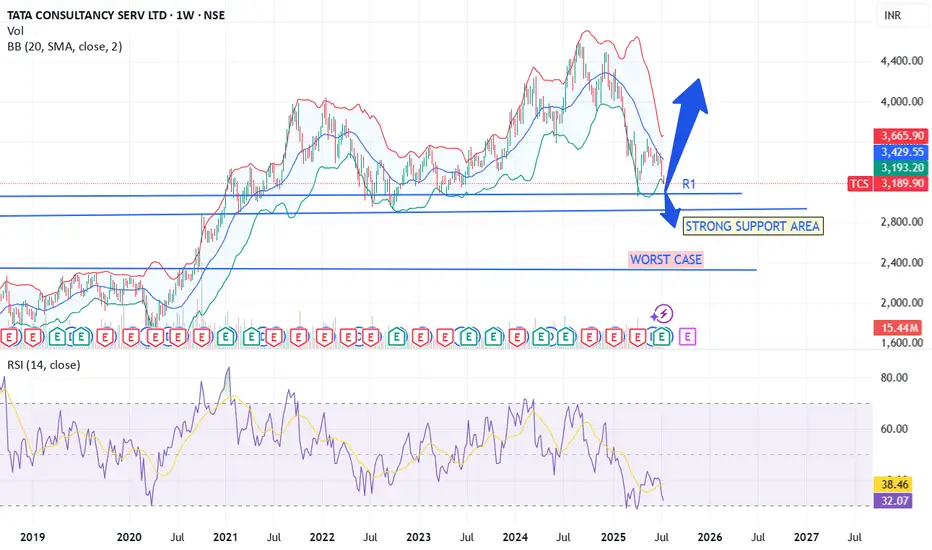
3000 to hold else we are going more down, target 3400-3700📝 Recent Performance
Q1 FY26
Net profit: ₹12,760 crore (↑6% YoY) .
Revenue: ₹63,437 crore (↓2.2% YoY), third consecutive quarterly decline .
Margins remained solid (~24%) .
Stock Momentum
Broke below key technical support post-Q1; could drop another ~5% .
2025 is the worst-performing sector—IT stocks down ~14%, TCS down ~21% YTD .
🌍 Key Headwinds
Global macro slowdown (geopolitical uncertainty, U.S. tariffs) dampening IT spending .
New bench policy causing employee anxiety — could affect productivity .
Client spending delays in North America, weak sectors like auto/manufacturing seen at other peers .
💡 Catalysts to Watch
Deal pipeline strength: Q1 bookings strong in BFSI & Americas — new deals worth ~$8.3 B .
AI and growth segments: TCS reported AI-infused and cloud pipelines now at ~$1.5 B .
Technical rebound: Stock approaching support/resistance zones between ₹3,150–₹3,600 .
🚀 Outlook: Will TCS Go Up?
Scenario Probability Price Outlook
Base Case 🌤 Moderate ₹3,100–₹3,600: range-bound until spending improves
Bullish Case 📈 Conditional ₹3,700+ if major IT deals (AI/cloud) accelerate
Bearish Case 📉 Possible ₹2,900–₹3,050 if global tech slowdown worsens
✅ Summary
Reason for caution: Slowing revenues, sector weakness, macro uncertainties.
Reasons for optimism: Consistent profitability, strong AI/cloud pipeline, and positive deal wins.
If global IT spending recovers (driven by AI/cloud), TCS could rebound toward ₹3,700+. Until then, it may trade in the ₹3,100–₹3,600 range.
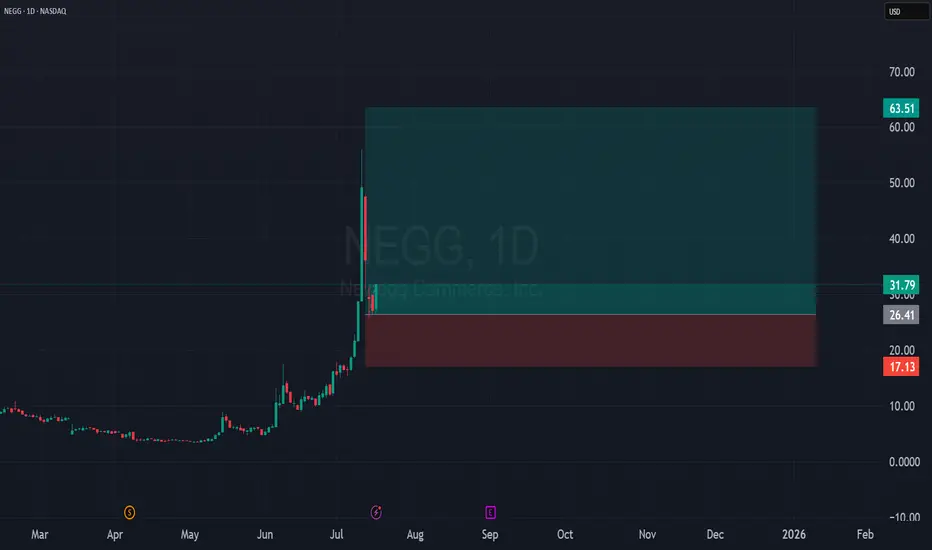
NEGG is bullishi tink NEGG it will exceed $51 good luck
but don't forget that it's too risky to enter the market now because I think there's going to be a crash very soon.
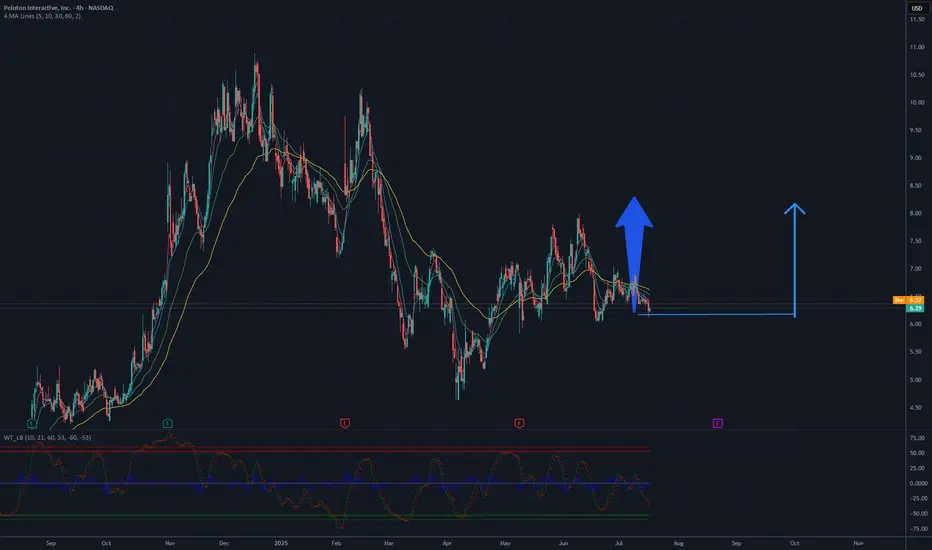
It's a time for Peloton Interactive, Inc. (PTON)-Target 8.20 $The chart analysis for Peloton Interactive, Inc. (PTON) suggests a potential rise with a target of 8.20 USD. The 4-hour chart indicates a recent downtrend from a peak around 10 USD, with the current price stabilizing near 6.30 USD. A key support level is observed around 6 USD, which could provide a strong base for an upward move. The 50-day and 200-day moving averages are converging, hinting at a possible trend reversal if buying pressure increases.
Breaking through the resistance at 6.50-6.70 USD, a recent consolidation zone, could trigger a rally. With rising volume and bullish candlestick formations, the price may aim for 8.20 USD, a significant resistance level based on prior highs. The RSI, currently in oversold territory, could support this upward movement if it starts to recover, indicating renewed momentum. However, a drop below 6 USD support could invalidate this outlook and lead to further declines.
Potential TP: 8.20 USD
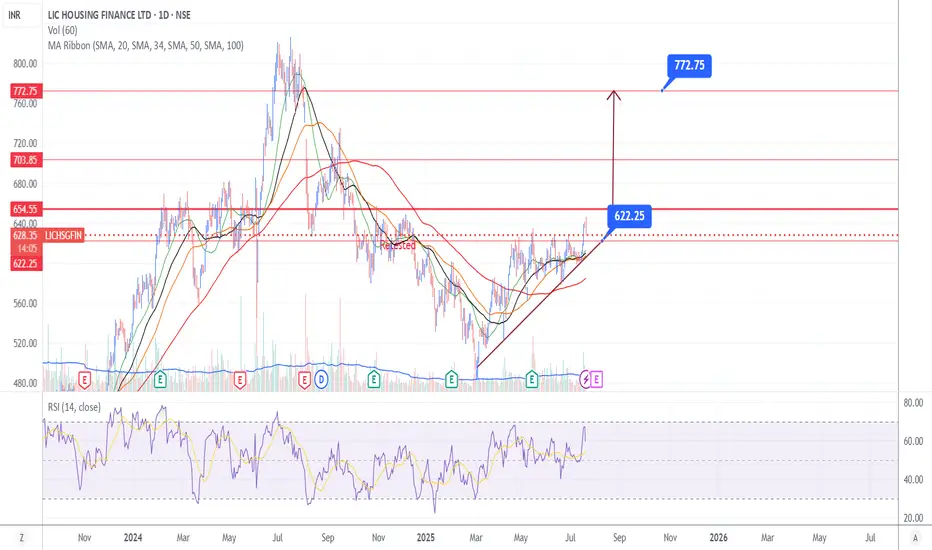
LIC housing Finance... probability of up move is greater!Moving in a pattern , where probability of up move is greater. price levels have been provided. In case of good results stock may move up rapidly. risk factor is minimum here.