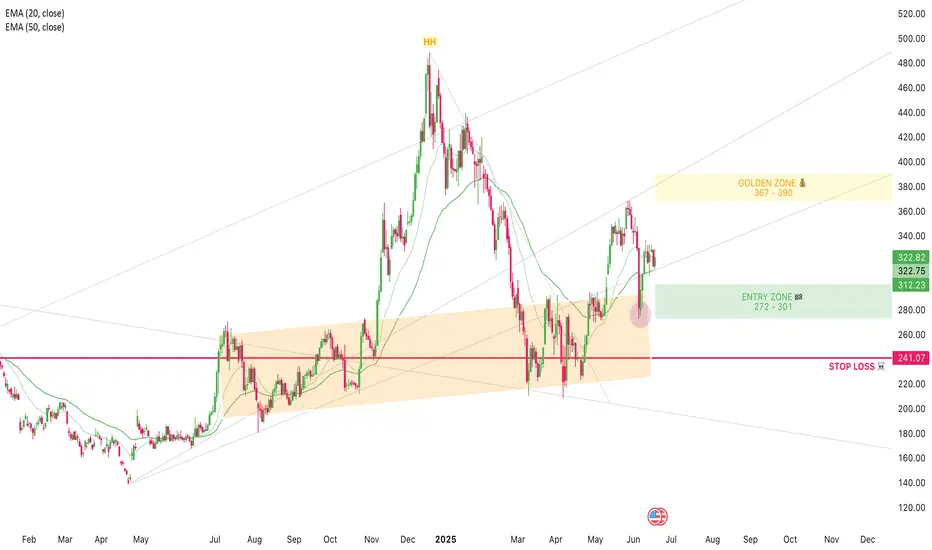
TSLA: Don't Sleep on the PullbackTesla’s bullish momentum is still in control – the weekly chart shows we’re still in an uptrend, and the trend is still our best friend. After a strong bounce from support a couple weeks ago, price is now rejecting off a weak resistance zone. Ideally, this pulls it back into my entry zone to retest the bottom or the 50% mark of the current swing. I’m using trend lines for guidance and expecting the next swing to push up into that confluence area. My golden zone is set between $367–$390, with partial profits be taken at $367 (top of the channel) and the rest near $390, where we meet the trend line. Stop loss is placed at $241, just below the level where momentum would likely shift.
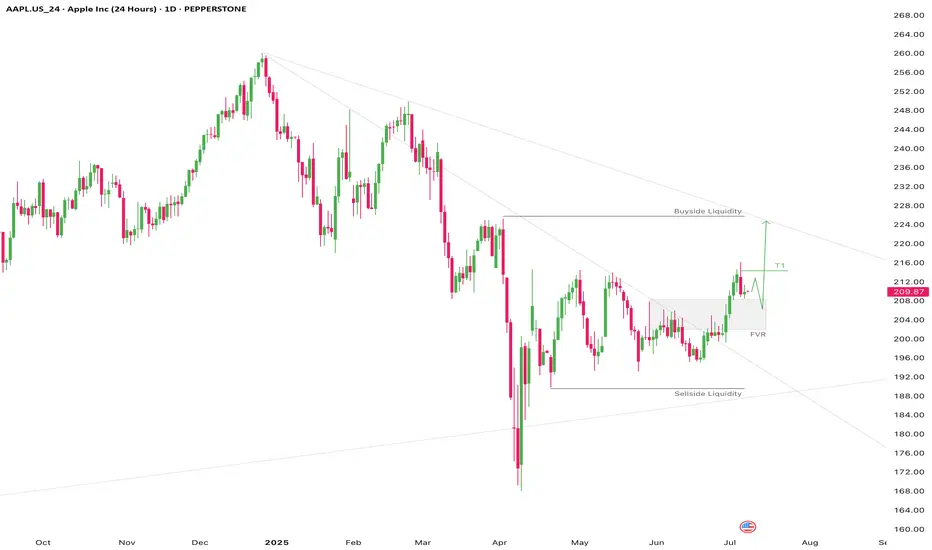
AAPL Short Term Highs IncomingAAPL 1D
Apple looks good from here.
Target 1 @ 214.30
Target 2 @ anywhere from 218 to buyside liquidity
Retest of the former high then a pullback to fair value region is possible before continuation to the next short term high.
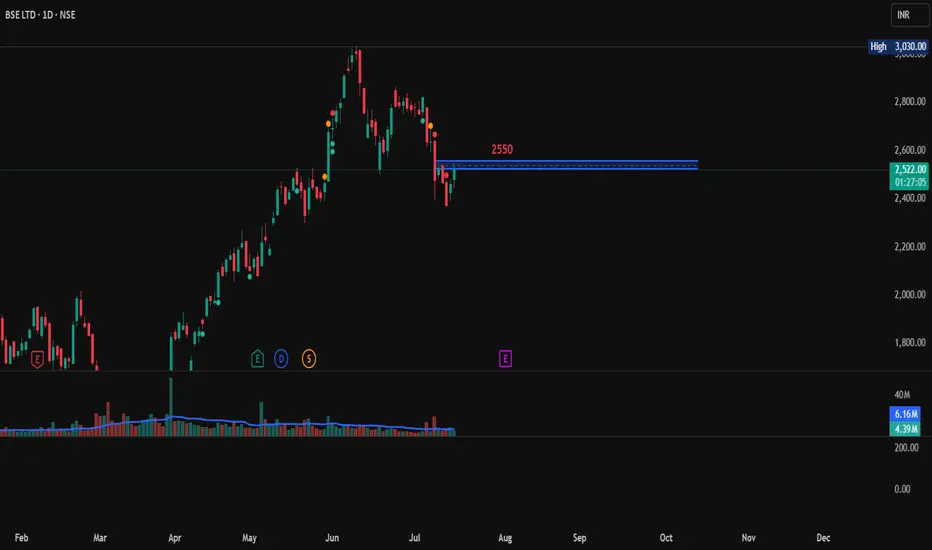
BSE at resistance, Long TradeBSE is closes above 2550 then it may give a good up ward move of 50 to 100 points.
On a bullish candle stick pattern and breakout at 2550 a Long call can be taken.
Entry after 2550 ( bullish candle stick pattern and breakout)
SL 2500
Target1: 2600
Target2: 2650.
A possible trend change after a 3-year slideEAND has been in a downtrend since April 2022, but we could be witnessing the start of a reversal into an uptrend. Price has been consolidating since the beginning of 2025 and now shows signs of a breakout, supported by a strong recent earnings report.
Key Highlights
✔️ Robust earnings growth
✔️ Strong balance sheet
✔️ Technical setup showing breakout potential
✔️ Positive sentiment returning to the sector
This could be a turning point for EAND, a break above key resistance may signal further upside.
Do your own research and manage risk accordingly.

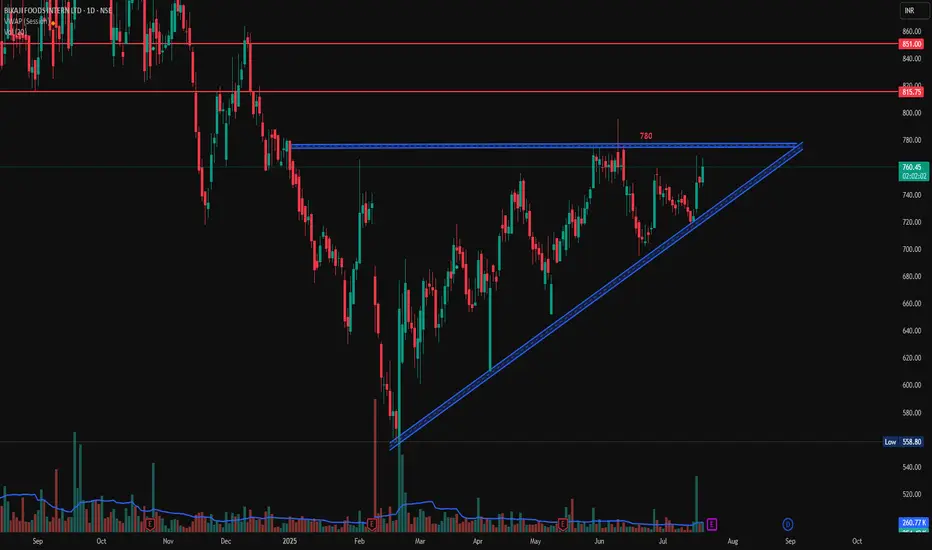
Bikaji Food Triangular Pattern, Long, 1DBikaji Food is following a triangular pattern. If it breaks the level of 780 with Bullish candlestick patterns like Bullish Engulfing, Hammer & Inverted Hammer, Piercing Line, Morning Star, Three White Soldiers, Tweezer Bottoms or Bullish Harami, then take a long trade on this stock with first target of 815 and second target of 851.
Entry: 780 (on Bullish candlestick pattern)
Target1: 815
Target2: 851
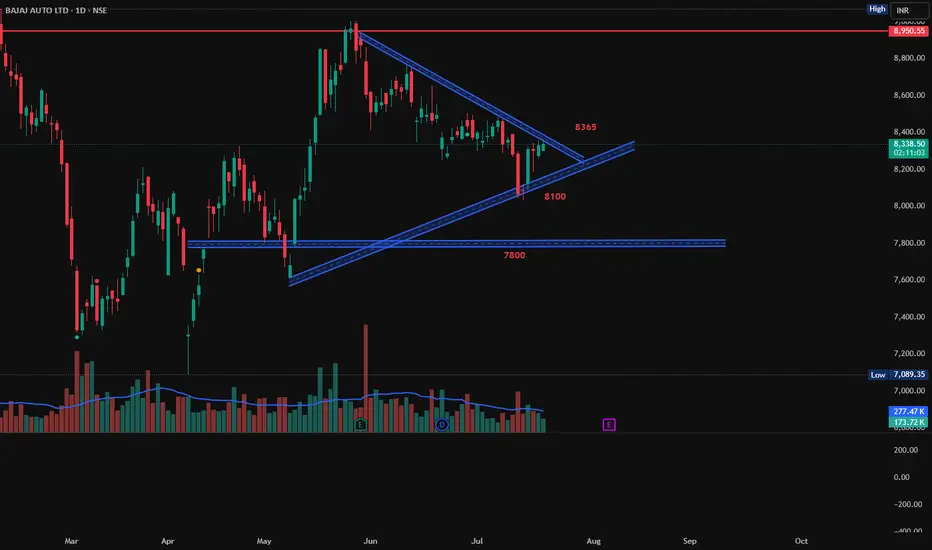
Bajaj Auto, Triangular PatternBajaj Auto is following a nice triangular pattern. Is both short and long side trade is possible on this stock. If it breaks above the pattern then enter on the breakout of 8365 with target 8950. If it break down below 8100 then target will be 7800.
Long
Entry: 8365
Target: 8950
Short
Entry: 8100
Target: 7800
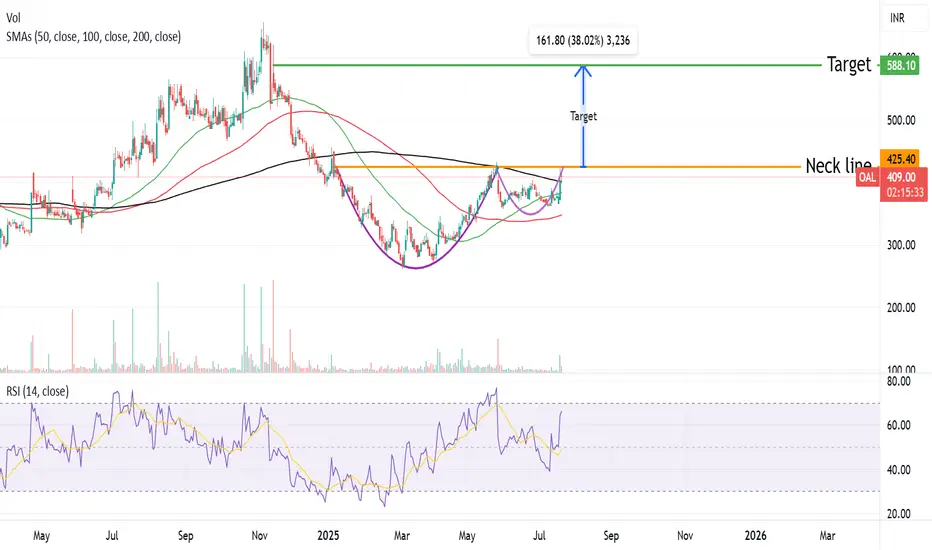
Oriental aromatic forming a CUP & HANDLE pattern Oriental aromatic forming a CUP & HANDLE pattern ,Breakout of this pattern will be above 425 level ,One can accumulate the stock with a stoploss of 360 for a Target of 580.
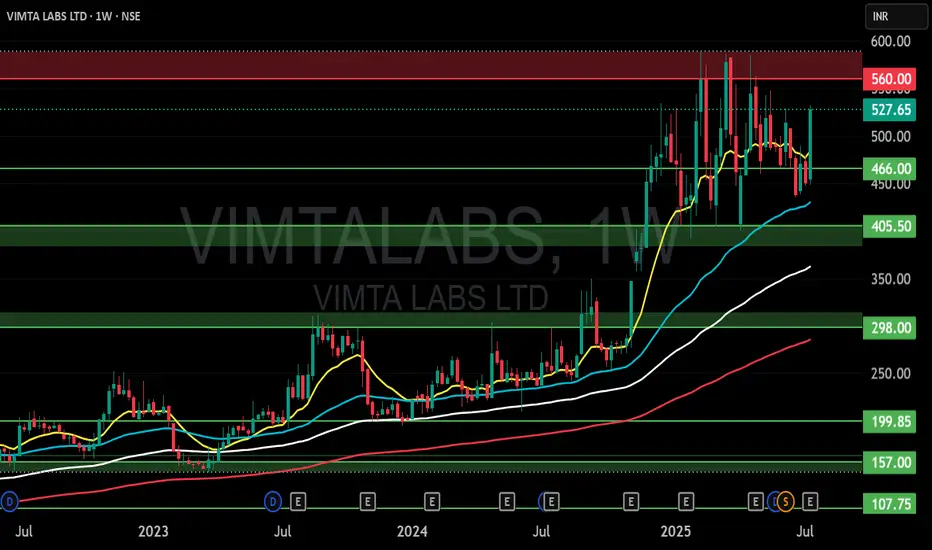
VIMTALAI (VIMTA LABS LTD) S/RSupport and Resistance Levels:
Support Levels: These are price points (green line/shade) where a downward trend may be halted due to a concentration of buying interest. Imagine them as a safety net where buyers step in, preventing further decline.
Resistance Levels: Conversely, resistance levels (red line/shade) are where upward trends might stall due to increased selling interest. They act like a ceiling where sellers come in to push prices down.
Breakouts:
Bullish Breakout: When the price moves above resistance, it often indicates strong buying interest and the potential for a continued uptrend. Traders may view this as a signal to buy or hold.
Bearish Breakout: When the price falls below support, it can signal strong selling interest and the potential for a continued downtrend. Traders might see this as a cue to sell or avoid buying.
MA Ribbon (EMA 20, EMA 50, EMA 100, EMA 200) :
Above EMA: If the stock price is above the EMA, it suggests a potential uptrend or bullish momentum.
Below EMA: If the stock price is below the EMA, it indicates a potential downtrend or bearish momentum.
Trendline: A trendline is a straight line drawn on a chart to represent the general direction of a data point set.
Uptrend Line: Drawn by connecting the lows in an upward trend. Indicates that the price is moving higher over time. Acts as a support level, where prices tend to bounce upward.
Downtrend Line: Drawn by connecting the highs in a downward trend. Indicates that the price is moving lower over time. It acts as a resistance level, where prices tend to drop.
Disclaimer:
I am not a SEBI registered. The information provided here is for learning purposes only and should not be interpreted as financial advice. Consider the broader market context and consult with a qualified financial advisor before making investment decisions.
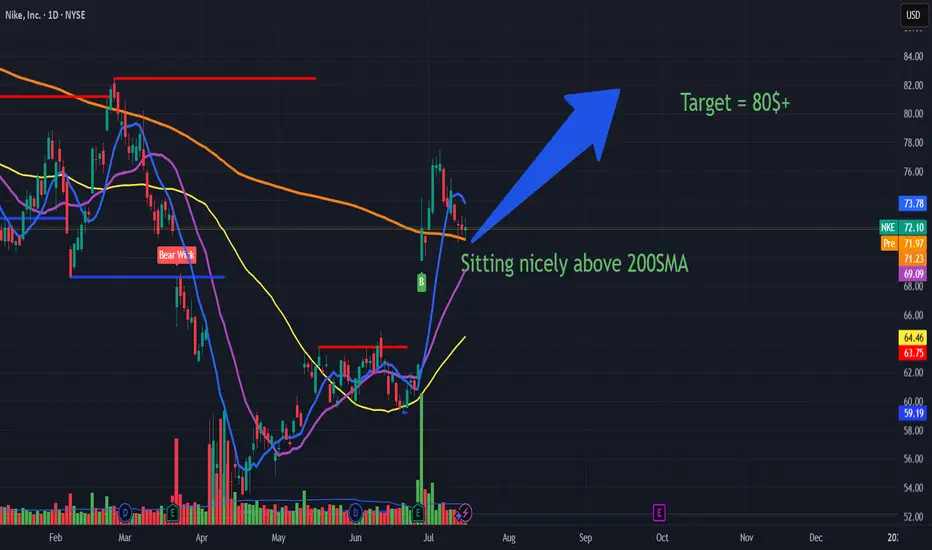
Nike is a screaming BUY with target above 80$ in the short termSummary: In short NKE is on reversal mode to the upside and 80$ is on the horizon and 100$+ by next quarter Earnings call which is an upside over 40% NYSE:NKE
Nike (NKE): Technical Strength Above the 200 SMA 🟢
Nike (NKE): Recent Earnings Overview 🏅
Above the 200-Day Simple Moving Average (SMA) 🟩
NKE’s price is currently holding above the key 200-day simple moving average (SMA).
The 200 SMA is widely followed by investors as a long-term trend indicator.
Sitting above this level signals a bullish phase, as it often marks a shift from bearish to bullish market sentiment.
Historically, when a stock breaks and sustains above its 200 SMA after a downtrend, it attracts attention from institutional buyers and can act as a strong support area for further upside .
Key Takeaways from the Earnings Call
China Recovery 🐉
Positive business trends are emerging in greater China, supporting Nike’s international momentum.
Brand Momentum 🚀
Investments in product innovation, branding, and digital transformation remain central to growth.
Shareholder Return 💰
The continuation of share buybacks and regular dividends signals Nike’s commitment to delivering value.
How This Supports the Bullish Thesis
Momentum Confirmation:
Trading above the 200 SMA supports the idea that recent gains are not just a short-term bounce, but reflect a possible trend reversal toward sustained growth.
Institutional Buying Signal:
Many long-term investors and funds use the 200 SMA as a buy trigger, increasing the likelihood of strong follow-through buying.
Risk-Reward:
Being above the 200 SMA, with support from lower moving averages, strengthens the case for manageable downside risk and a clear technical floor.
Combined with recent Earnings, the technical breakout above the 200 SMA aligns with Nike’s solid Q4 earnings results, margin improvement, and positive guidance, all reinforcing confidence in the current rally.
Nike’s position above the 200-day simple moving average—combined with recent strong fundamentals—strengthens the bullish outlook for the stock at this key juncture..
Why This Matters for the Buy Thesis
Earnings Beat: Supports the recent surge in Nike’s stock price and adds conviction to a bullish outlook.
Margin Resilience: Operational improvements reduce risk, even in a tough retail environment.
Brand and Digital Strength: Focus on innovation and digital sales provides confidence for long-term investors.
In short NKE is on reversal mode to the upsie and 80$ is on the horizon and 100$+ by next quarter Earnings call
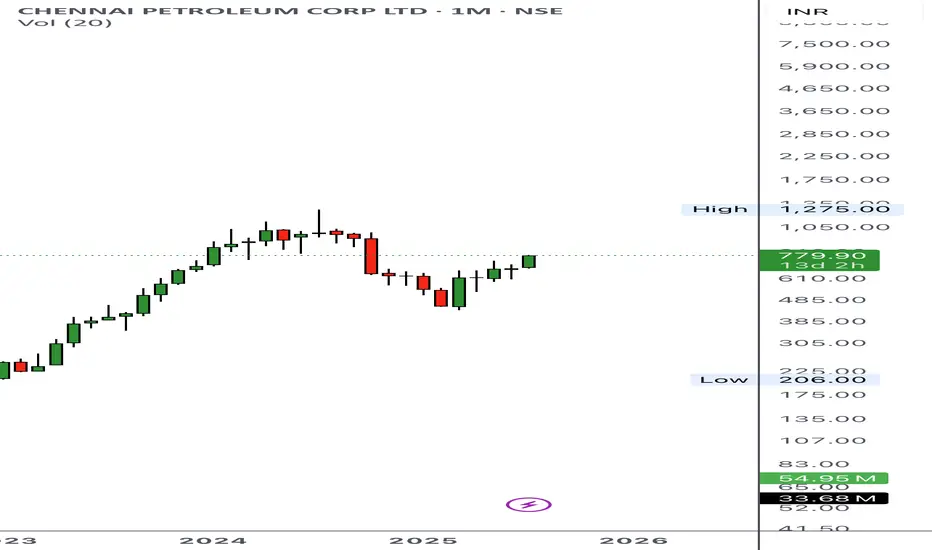
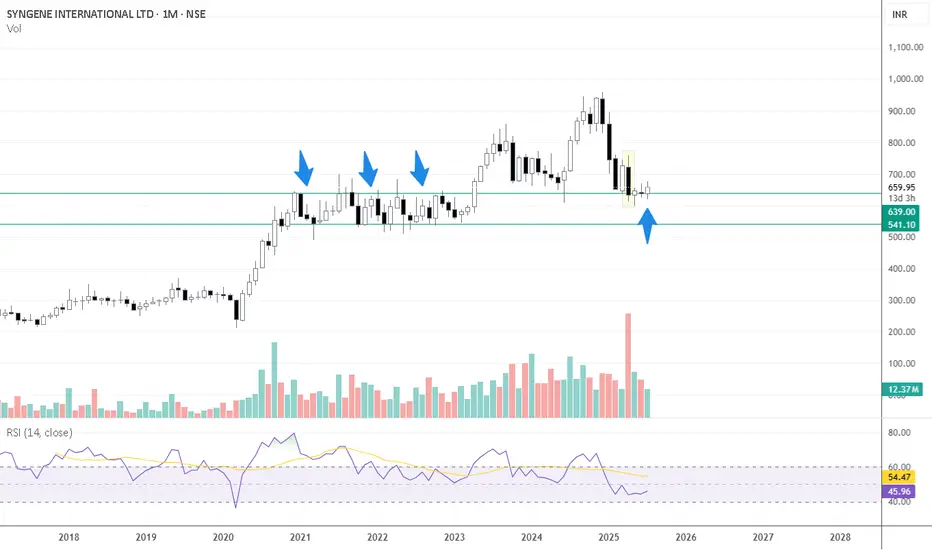
SYNGENE INTERNATIONAL LTD at Old Peaks Key Support 📈 Monthly Chart – Key Support at Old Peaks
The stock has recently revisited the ₹600–₹610 range, which corresponds to a previous consolidation and monthly swing-low zone (~₹607) from November 2020 to April 2023 on the monthly timeframe
This zone isn’t just another support level—it represents an area where price historically spent over 2.5 years, making multiple tests before breaking higher. Such zones often act as strong demand zones when revisited
A sustained hold above ₹607 would reinforce this support, signaling a potential base for a multi-month reversal or bounce
🕯️ April Monthly Candle – Selling Exhaustion?
Large bearish candle in April (FY25 Q4 results month).
High volume, which often signals capitulation or Selling climax.
Price has since stayed within the range of this candle-no breakout above or below.
Indicates a potential exhaustion of sellers if the stock holds above the low of that candle, this structure often represents a volatility compression after a sharp move-like a spring coiling.
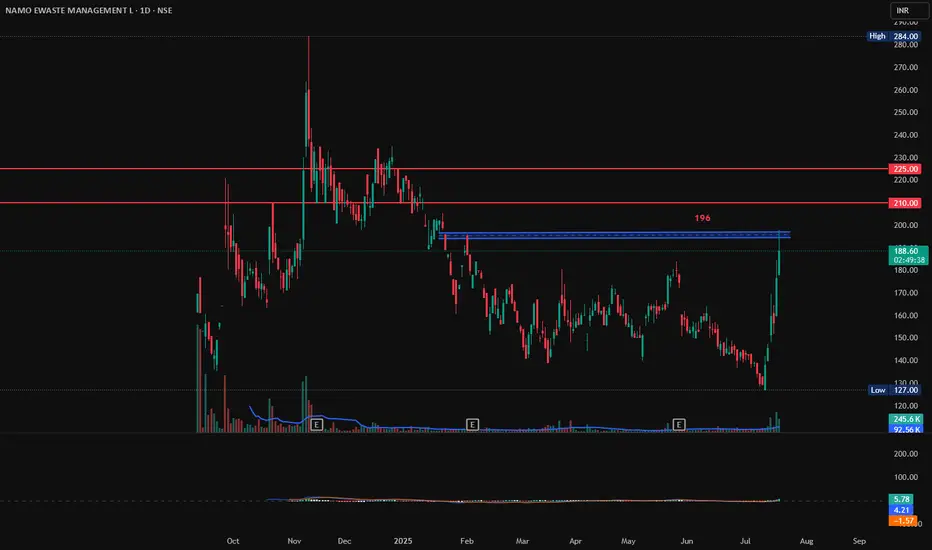
NAMO EWASTE MANAGEMENT, Long, Breakout, 1DNAMO EWASTE MANAGEMENT has gain 6% today with good volumes. If it breaks and sustains 196 with Bullish candlestick patterns like Bullish Engulfing, Hammer & Inverted Hammer, Piercing Line, Morning Star, Three White Soldiers, Tweezer Bottoms or Bullish Harami, then there are good chances for it to go further up from here. First target will be 210 and second target 225.
Entry: 196 (on Bullish candlestick pattern)
Target1: 210
Target2: 225.
SL: 185
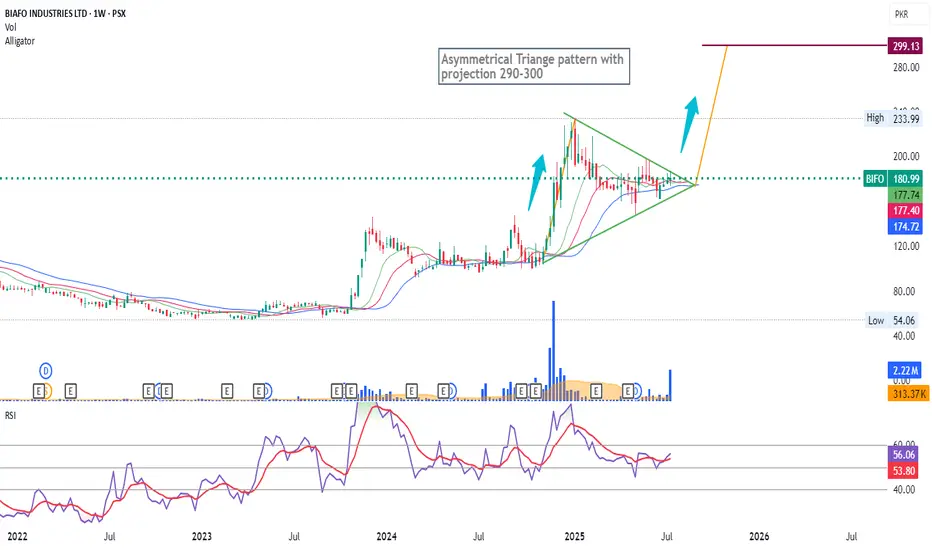
BIFO WEEKLY LONG POSITIONA bit medium to long term perspective. Projection marked at the end of the Triangle's intersection for now, plz note. Accumulation going will take some time to materialize. keep fingers crossed.....
Lets c how it plays further
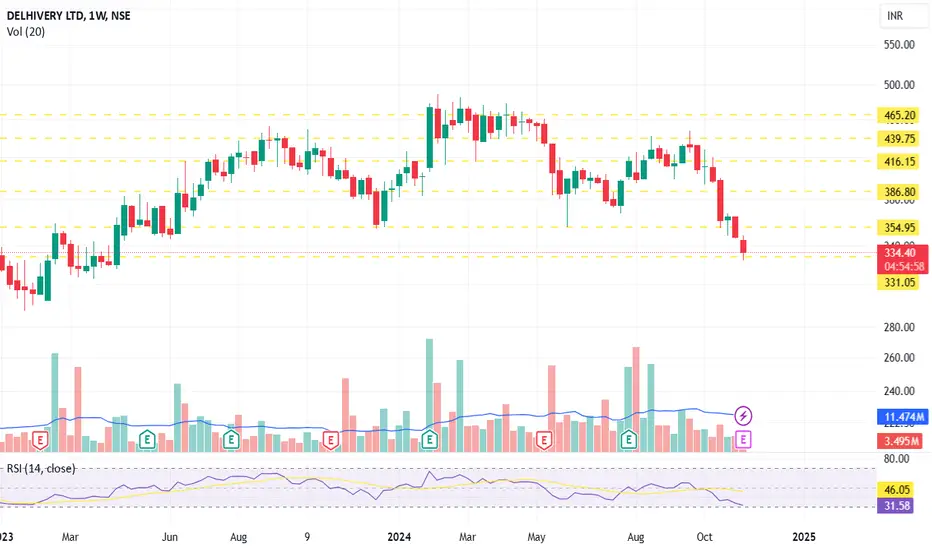
Investment cum Trading IdeaDELHIVERY LTP 330 Tgt:370/430/470 🤞🏻🤞🏻🤞🏻 Purely long-term investment may add on dips or hold calmly Will Review at price range of 480-500 for further move
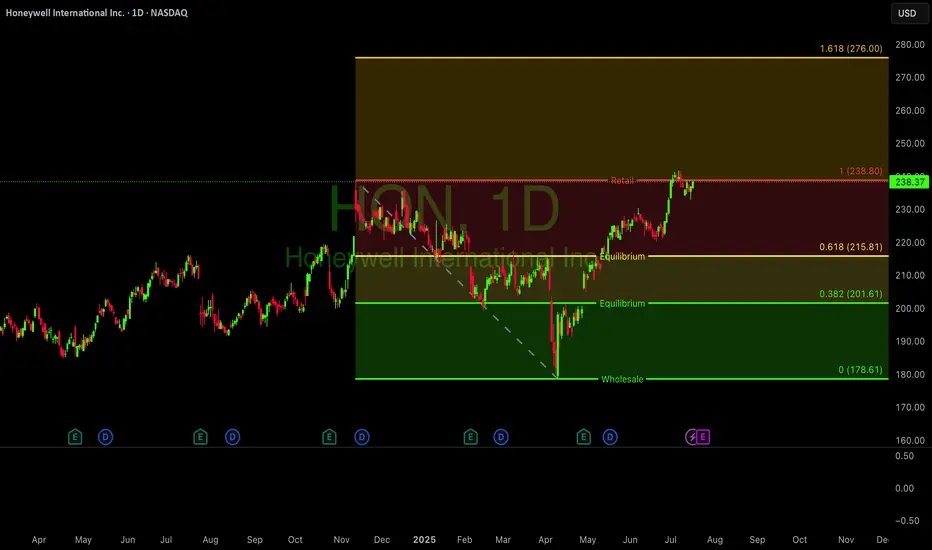
$HON Honey are you well NASDAQ:HON looking strong. Weekly chart is in a clear Stage 2 uptrend, now consolidating near all-time highs.
The 4-hour chart is holding key support around the $230-$233 level, with the Stochastic oscillator turning up from oversold territory. A decisive break above the $240 resistance could signal the next major leg higher.
#Honeywell #TechnicalAnalysis #Trading #Stocks
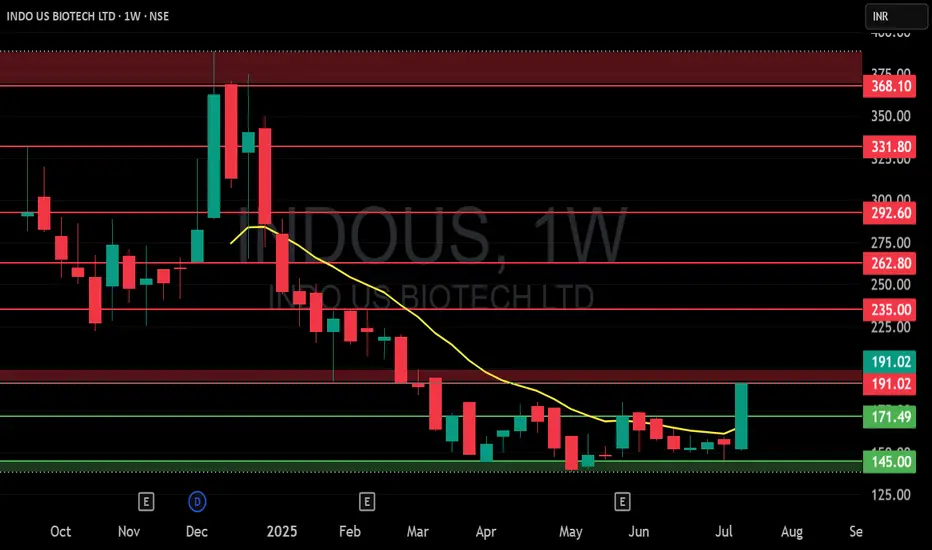
INDOUS (INDO US BIOTECH LTD) S/RSupport and Resistance Levels:
Support Levels: These are price points (green line/shade) where a downward trend may be halted due to a concentration of buying interest. Imagine them as a safety net where buyers step in, preventing further decline.
Resistance Levels: Conversely, resistance levels (red line/shade) are where upward trends might stall due to increased selling interest. They act like a ceiling where sellers come in to push prices down.
Breakouts:
Bullish Breakout: When the price moves above resistance, it often indicates strong buying interest and the potential for a continued uptrend. Traders may view this as a signal to buy or hold.
Bearish Breakout: When the price falls below support, it can signal strong selling interest and the potential for a continued downtrend. Traders might see this as a cue to sell or avoid buying.
MA Ribbon (EMA 20, EMA 50, EMA 100, EMA 200) :
Above EMA: If the stock price is above the EMA, it suggests a potential uptrend or bullish momentum.
Below EMA: If the stock price is below the EMA, it indicates a potential downtrend or bearish momentum.
Trendline: A trendline is a straight line drawn on a chart to represent the general direction of a data point set.
Uptrend Line: Drawn by connecting the lows in an upward trend. Indicates that the price is moving higher over time. Acts as a support level, where prices tend to bounce upward.
Downtrend Line: Drawn by connecting the highs in a downward trend. Indicates that the price is moving lower over time. It acts as a resistance level, where prices tend to drop.
Disclaimer:
I am not a SEBI registered. The information provided here is for learning purposes only and should not be interpreted as financial advice. Consider the broader market context and consult with a qualified financial advisor before making investment decisions.
Mean Reversion Trade: META1. RSI in oversold region
2. Price likely to rebound back the the mean
Trade Rules:
Entry Trigger - RSI has cross below oversold region, enter limit buy at close price
Exit Trigger - Close at market when close price cross above exit trigger (Red step line)

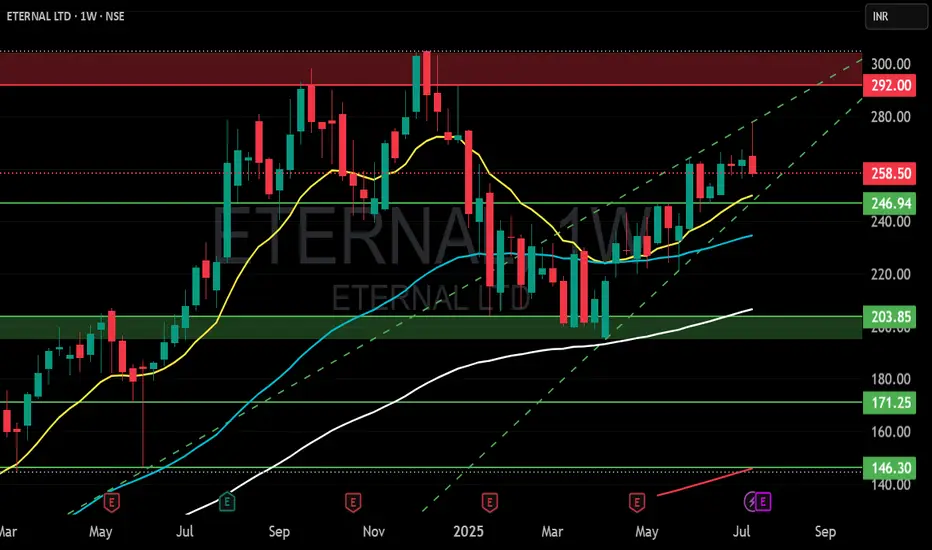
ETERNAL LTD S/RSupport and Resistance Levels:
Support Levels: These are price points (green line/shade) where a downward trend may be halted due to a concentration of buying interest. Imagine them as a safety net where buyers step in, preventing further decline.
Resistance Levels: Conversely, resistance levels (red line/shade) are where upward trends might stall due to increased selling interest. They act like a ceiling where sellers come in to push prices down.
Breakouts:
Bullish Breakout: When the price moves above resistance, it often indicates strong buying interest and the potential for a continued uptrend. Traders may view this as a signal to buy or hold.
Bearish Breakout: When the price falls below support, it can signal strong selling interest and the potential for a continued downtrend. Traders might see this as a cue to sell or avoid buying.
MA Ribbon (EMA 20, EMA 50, EMA 100, EMA 200) :
Above EMA: If the stock price is above the EMA, it suggests a potential uptrend or bullish momentum.
Below EMA: If the stock price is below the EMA, it indicates a potential downtrend or bearish momentum.
Trendline: A trendline is a straight line drawn on a chart to represent the general direction of a data point set.
Uptrend Line: Drawn by connecting the lows in an upward trend. Indicates that the price is moving higher over time. Acts as a support level, where prices tend to bounce upward.
Downtrend Line: Drawn by connecting the highs in a downward trend. Indicates that the price is moving lower over time. It acts as a resistance level, where prices tend to drop.
Disclaimer:
I am not a SEBI registered. The information provided here is for learning purposes only and should not be interpreted as financial advice. Consider the broader market context and consult with a qualified financial advisor before making investment decisions.
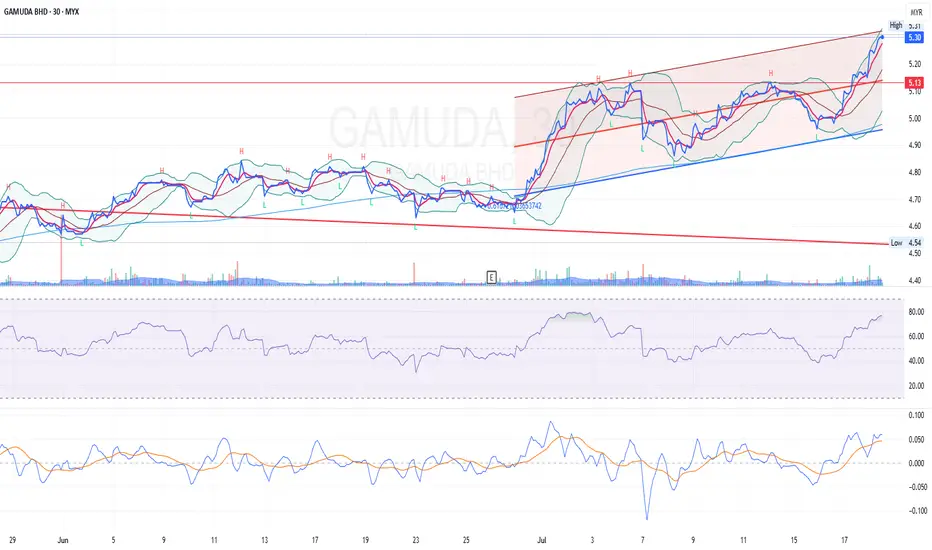
GAMUDA 30-Min Trend Channel Breakout – Short-Term Bullish Setup I've been tracking GAMUDA closely on the 30-minute timeframe, and this setup caught my attention due to the confluence of technical signals pointing towards a potential short-term breakout continuation.
Trend Context:
Price is moving within a well-defined ascending parallel regression trend channel. Recently, it rebounded strongly off the lower channel boundary, respecting the channel support before accelerating toward the upper range.
Bollinger Band Action:
The price is currently riding along the upper Bollinger Band, a sign of a trend-strengthening move. This expansion typically signals momentum continuation, especially when supported by volume and broader trend alignment.
Momentum Signals:
RSI is pushing into overbought territory (>70), which in the context of a breakout and strong trend, may indicate strength rather than reversal.
MACD shows a bullish crossover with both lines trending upward, confirming ongoing momentum.
Volume Confirmation:
Volume has been gradually increasing on up candles—suggesting participation and interest in the bullish move.
Resistance & Breakout Area:
The price just cleared a minor horizontal resistance at 5.13, confirming a micro breakout within the channel.
Trade Idea:
Entry Zone: Between RM 5.26 – RM 5.30 (current market area, post breakout)
Profit Target 1: RM 5.38 (near upper channel resistance)
Profit Target 2: RM 5.45 (projected breakout extension)
Stop Loss: RM 5.13 (below recent structure support and mid-channel zone)
This setup offers a favorable RRR (Risk-Reward Ratio) if entered near the current breakout region and managed closely.
Key Takeaways:
Timeframe: 30-minute
Trade Type: Momentum breakout within ascending trend channel
Indicators Used: Bollinger Bands, RSI, MACD
Strategy: Buy on strength with tight stop-loss; ride the channel
Disclaimer: This analysis is shared for educational purposes and is a personal chartist idea. It is not a buy/sell recommendation. Please manage your own risk and do your due diligence.
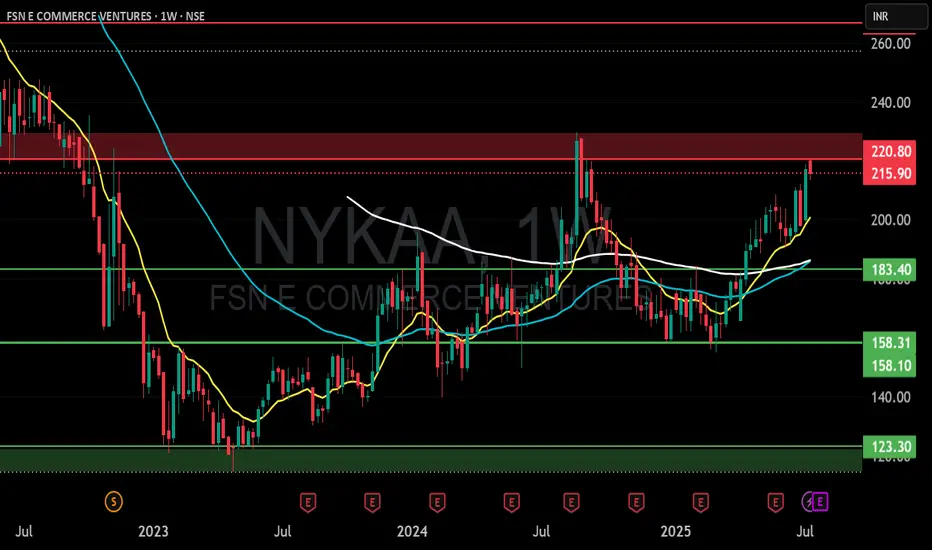
NYKAA (FSN COMMERCE VENTURES) S/RSupport and Resistance Levels:
Support Levels: These are price points (green line/shade) where a downward trend may be halted due to a concentration of buying interest. Imagine them as a safety net where buyers step in, preventing further decline.
Resistance Levels: Conversely, resistance levels (red line/shade) are where upward trends might stall due to increased selling interest. They act like a ceiling where sellers come in to push prices down.
Breakouts:
Bullish Breakout: When the price moves above resistance, it often indicates strong buying interest and the potential for a continued uptrend. Traders may view this as a signal to buy or hold.
Bearish Breakout: When the price falls below support, it can signal strong selling interest and the potential for a continued downtrend. Traders might see this as a cue to sell or avoid buying.
MA Ribbon (EMA 20, EMA 50, EMA 100, EMA 200) :
Above EMA: If the stock price is above the EMA, it suggests a potential uptrend or bullish momentum.
Below EMA: If the stock price is below the EMA, it indicates a potential downtrend or bearish momentum.
Trendline: A trendline is a straight line drawn on a chart to represent the general direction of a data point set.
Uptrend Line: Drawn by connecting the lows in an upward trend. Indicates that the price is moving higher over time. Acts as a support level, where prices tend to bounce upward.
Downtrend Line: Drawn by connecting the highs in a downward trend. Indicates that the price is moving lower over time. It acts as a resistance level, where prices tend to drop.
Disclaimer:
I am not a SEBI registered. The information provided here is for learning purposes only and should not be interpreted as financial advice. Consider the broader market context and consult with a qualified financial advisor before making investment decisions.
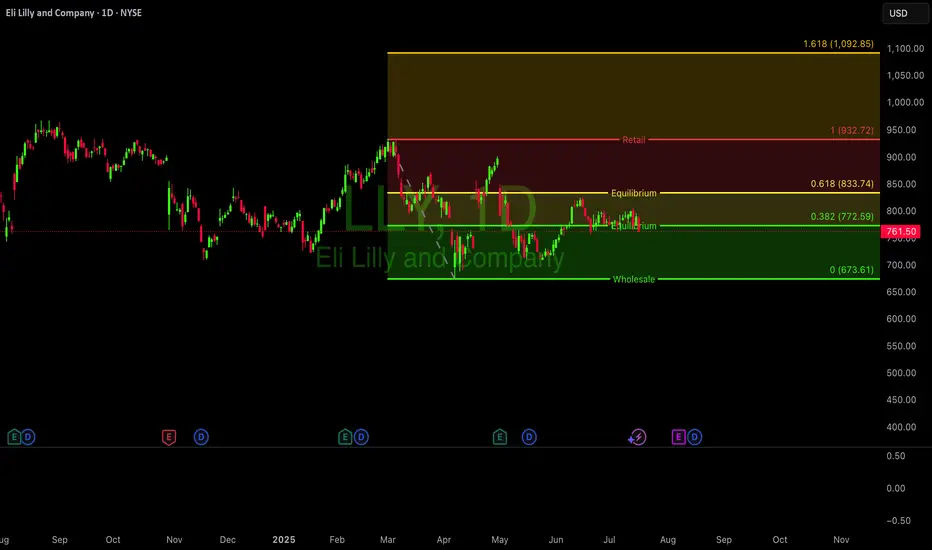
Just want to be there.. $LLYNYSE:LLY is showing classic signs of a Stage 3 top after its massive multi-year run. The trend has stalled, and the stock is now in a volatile sideways range.
Resistance: $975 Critical Support: $690
A weekly close below support would be a major bearish signal, potentially confirming the top and initiating a Stage 4 decline.
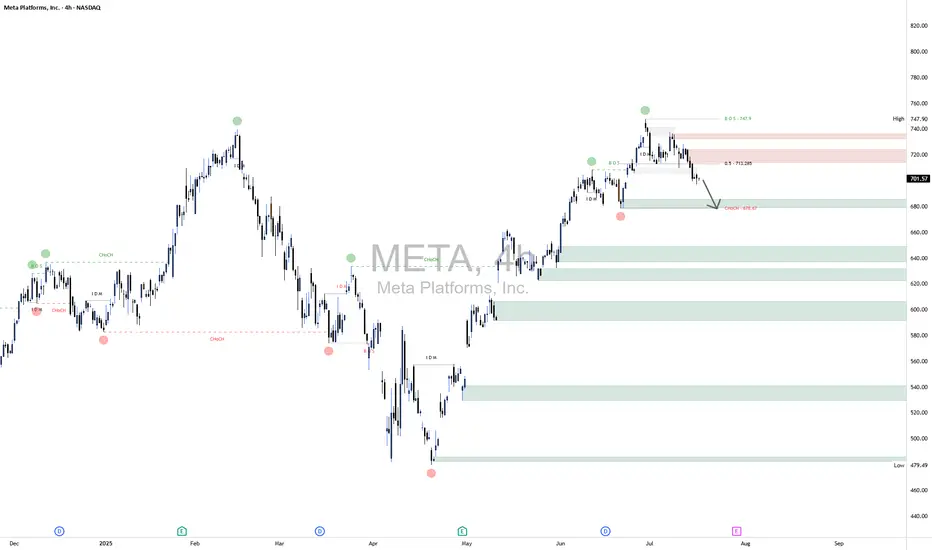
META Short📈 Scenario Outlook:
Bias: Bearish
Primary Expectation: Price is currently in a corrective decline and is expected to continue toward the 676.67 CHoCH level.
Bearish confirmation was seen upon rejection from the 713.20 mid-level, with price now printing lower highs and lower lows on the 4H chart.
This move may ultimately form a larger distribution pattern on the daily timeframe.
📌 Key Zones ("Your Borders"):
🔴 Mid-Supply Rejection Zone (Resistance)
Level: ~713.20 (50% equilibrium of last bearish swing)
This level acted as the midpoint during the retracement following the initial selloff from the top.
The market respected this region as a mid-range rejection, further reinforcing bearish momentum.
Failure to reclaim this level confirms bearish dominance in the short-to-medium term.
⚪ Target Zone / CHoCH Demand Test
Zone: 676.67 (CHoCH)
This is your projected draw on liquidity and primary downside target. It marks a structurally significant low where prior bullish order flow initiated.
If this level fails to hold, META may shift into a broader corrective phase, potentially unwinding a large portion of the prior rally.