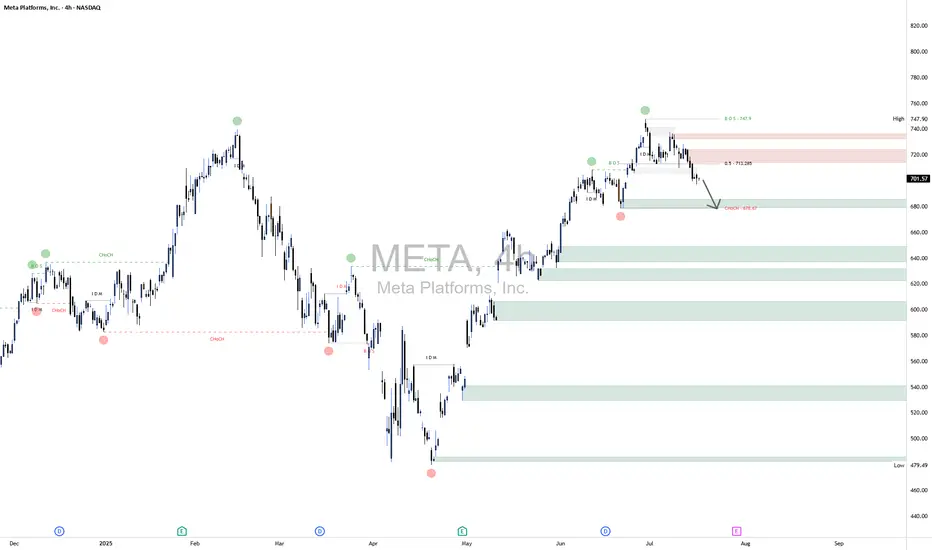
META Short📈 Scenario Outlook:
Bias: Bearish
Primary Expectation: Price is currently in a corrective decline and is expected to continue toward the 676.67 CHoCH level.
Bearish confirmation was seen upon rejection from the 713.20 mid-level, with price now printing lower highs and lower lows on the 4H chart.
This move may ultimately form a larger distribution pattern on the daily timeframe.
📌 Key Zones ("Your Borders"):
🔴 Mid-Supply Rejection Zone (Resistance)
Level: ~713.20 (50% equilibrium of last bearish swing)
This level acted as the midpoint during the retracement following the initial selloff from the top.
The market respected this region as a mid-range rejection, further reinforcing bearish momentum.
Failure to reclaim this level confirms bearish dominance in the short-to-medium term.
⚪ Target Zone / CHoCH Demand Test
Zone: 676.67 (CHoCH)
This is your projected draw on liquidity and primary downside target. It marks a structurally significant low where prior bullish order flow initiated.
If this level fails to hold, META may shift into a broader corrective phase, potentially unwinding a large portion of the prior rally.
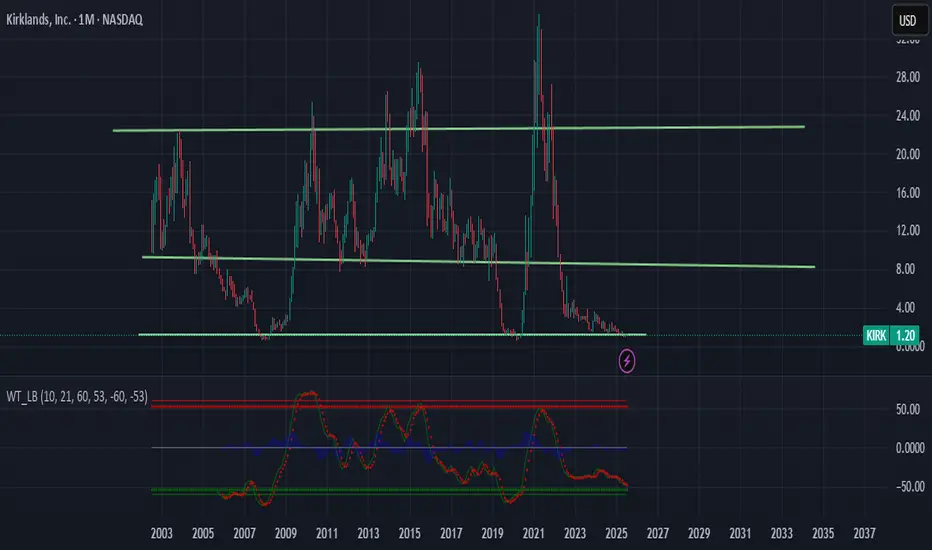
Could we really see 10$?Kirk has been a silent but aggressive stock with plenty of off exchange trading rn its primed for another short squeeze? i expect it there has been a quiet increase of buying pressure as of the past few months
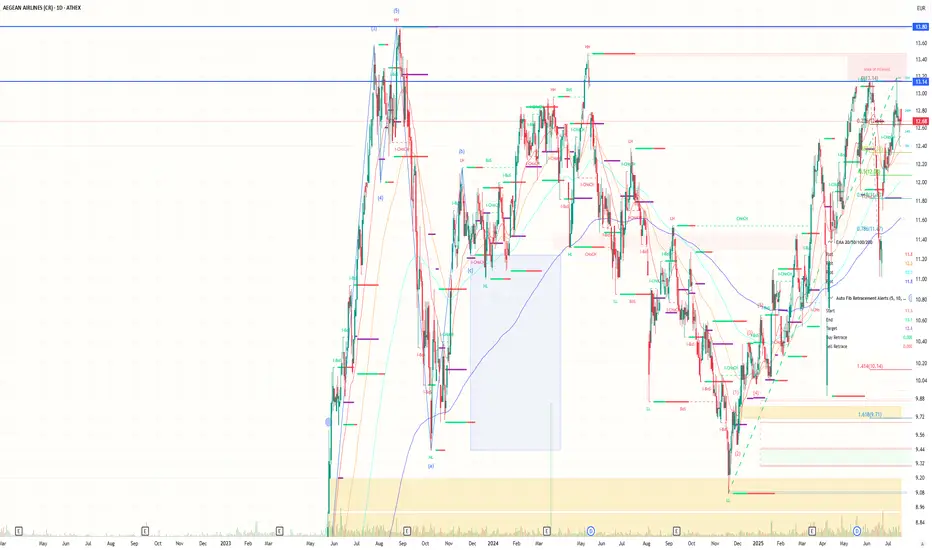
Aegean: The cheapest airline in Europe?Aegean is flying high, but the stock remains grounded at -71.5% – The market values it at just 28.5% of its real worth: The cheapest airline in Europe?
Aegean: Time for the Market to Wake Up
We’ve said a lot about Aegean. About its stock going nowhere, about how it's been ignored by the market, about how it just refuses to move. Sure, some of that skepticism is understandable—geopolitical risk, a volatile global landscape, travel disruptions. But at some point, we need to look at the numbers.
Because this isn’t just another airline stock. Aegean is sitting on assets worth over €4 billion. And its current market cap? Just €1.14 billion.
Do the math: that's a 71.5% discount — the stock is trading at only 28.5% of what the company is worth on paper.
If that’s not undervalued, what is?
60 Aircraft, €4 Billion in Investment
This isn’t hype — it's hard investment. Aegean has committed to 60 Airbus A320/321neo aircraft by 2031, with a total fleet investment reaching $4 billion. The two newest additions, the A321neo XLRs, have a flight range of over 10 hours. That opens the door to long-haul destinations far beyond Europe — like India, the Maldives, Nairobi, and more.
In fact, direct flights to India are already scheduled to start in March 2026, ahead of the original plan. This isn’t about just growing the fleet — it’s a shift in scale, reach, and ambition.
Meanwhile, Aegean has already received 36 of the 60 aircraft. The buildout is real. And it’s happening now.
An Airline Investing in Itself
Aegean isn't just growing in the air — it’s building on the ground. It has launched maintenance and training facilities, is servicing third-party aircraft, and is investing heavily in talent and education.
From 1,878 employees in 2013 to nearly 4,000 today. Dozens of scholarships. A full ecosystem of aviation infrastructure is taking shape — one that positions Aegean not just as an airline, but as a regional aviation hub.
How is all of that still being missed on the board?
The Market Is Rallying – Aegean Is Not
While the Athens Stock Exchange hits 15-year highs, and large caps are breaking records, Aegean’s stock is standing still.
It’s one of the few big names that hasn’t made a move — and that makes it a prime candidate for a snap revaluation.
All it needs is a spark — a catalyst. A major deal. A re-rating. A surprise quarter. Something to jolt the market awake. And when that happens, it won’t be slow or gradual. It’ll be violent and vertical.
Geopolitics? Sure. But Everyone’s Facing It
Yes, global tensions are high. Wars, inflation, airspace closures, unpredictability. But every airline is in the same storm. What matters is how you build resilience. And Aegean has done that.
It emerged from the COVID crisis leaner, stronger, more focused. While others pulled back, Aegean doubled down. That’s not weakness — that’s conviction.
Why the Discount Still Exists
The short answer: the market hasn't connected the dots.
The new fleet hasn’t been fully priced in.
The strategic expansion hasn’t registered.
The infrastructure buildout hasn’t translated into market value.
Investors are still judging it on short-term P&Ls — not on what it’s quietly turning into.
Time for That to Change
It’s time for the market to take another look. To see the €4 billion in assets not as a future maybe — but as a real foundation for growth. To recognize the international pivot. To price in the hidden strength.
Aegean has the fundamentals. It has the vision. It has the operational edge.
What it doesn’t have — yet — is the recognition on the board.
But that’s coming. And when it comes, the move won’t be subtle.
Aegean is undervalued. Not just theoretically, but blatantly — with a 71.5% discount staring everyone in the face. The business is solid. The growth is real. The investments are in motion.
The market will catch up. The only question is: will you be in before it does?
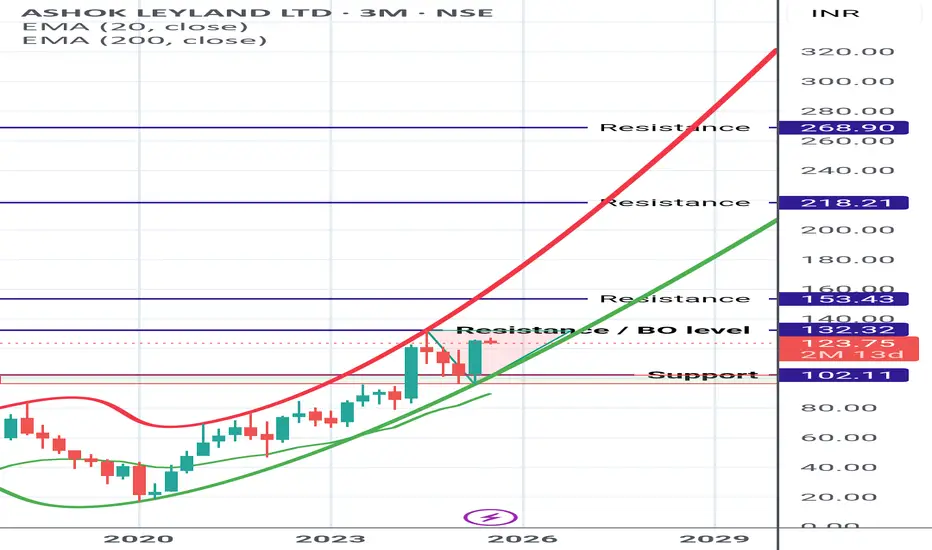
Ashok Ley land updated view Ashok ley land chart updated after price adjustment of bonus.
Currently trading in Parabolic uptrend pattern and inside Triangular zone.
On closing above the triangular marked zone (Breakout level) rest of the marked Resistance can be expected
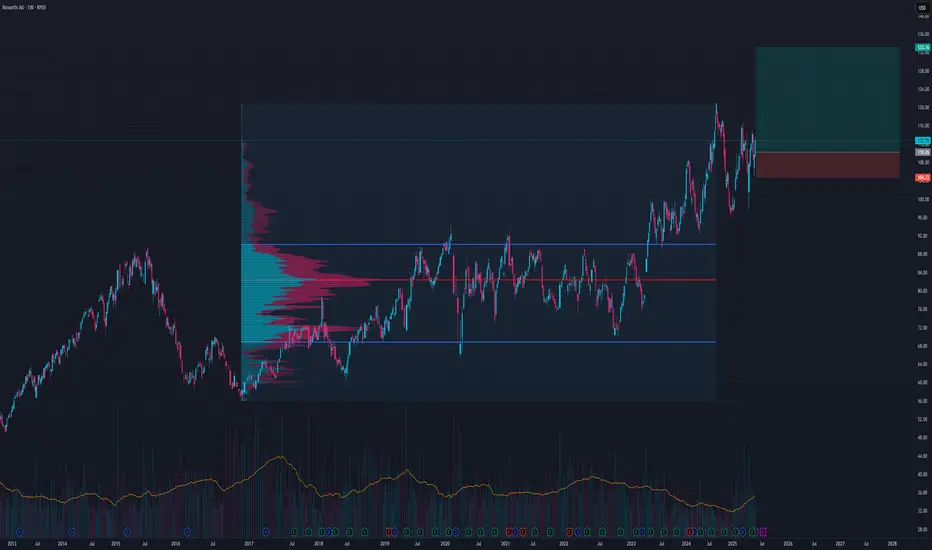
NVS Bullish Continuation LongThis looks super bullish
If we get a flat to lower open tomorrow, would be a good market entry
Best entry price around 110-108
TP1 133
TP2 154
This is a longer term play I would not expect this to play out in a couple weeks
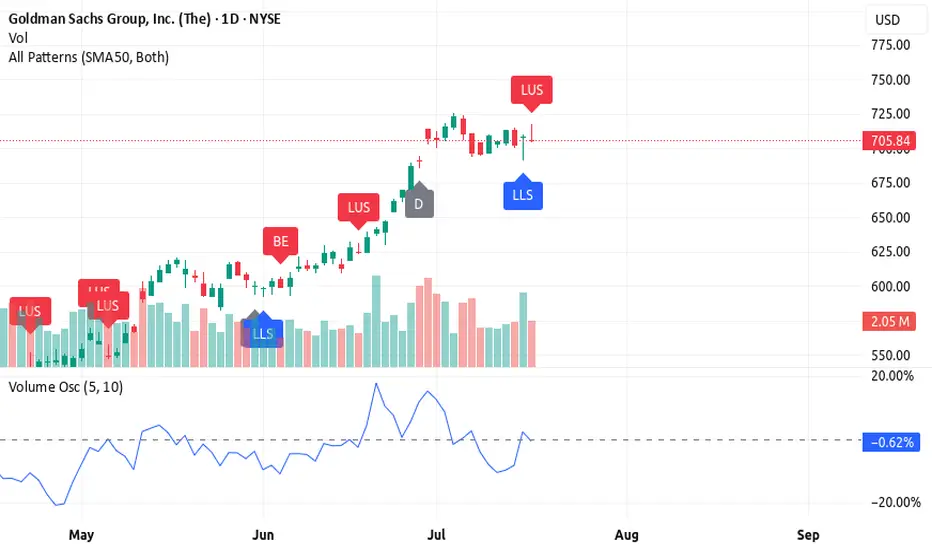
3 Reasons Why Goldman Sachs (GS) Still Looks Bullish🚀 3 Reasons Why Goldman Sachs (GS) Still Looks Bullish (Despite a Bearish Candle)
Goldman Sachs is in a bullish trend, but the latest candlestick is flashing a warning. Here's why GS still looks strong — and what to watch for next 📈
1️⃣ Candlestick pattern – long upper shadow
The long upper shadow shows sellers pushed the price down from the highs, signaling resistance. While bearish short-term, it often happens during strong trends as the market breathes before pushing higher.
2️⃣ High volume on a bearish candle
The negative volume shows resistance, but it may actually represent bear exhaustion. High volume without a breakdown
suggests bears tried to push it down — and failed. Classic fake-out.
3️⃣ Volume oscillator still rising
Despite the pullback candle, the volume oscillator is holding above zero and trending up, showing momentum is still on the bulls' side.
🔥 Rocket Booster Strategy still intact
✅ Price above 50 EMA
✅ Price above 200 EMA
⚠️ Just a temporary shakeout? If the next candle confirms support, GS may continue the bullish push.
⚠️ Disclaimer: Always use a simulation (demo) account before trading with real money. Learn proper risk management and profit-taking strategies to protect your capital.
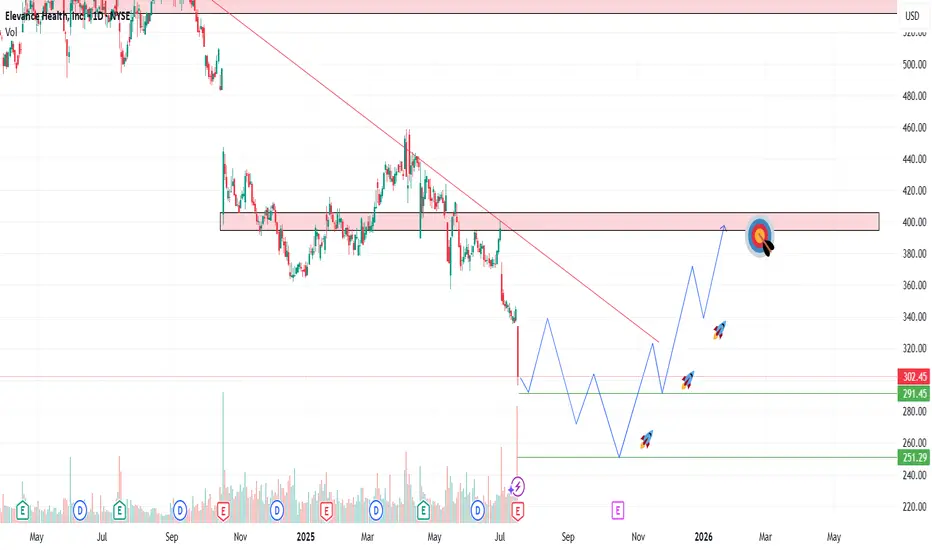
ELV (Elevance Health) – Catching the Knife or Catching Value?Elevance (ELV) just took a 12% hit after Q2 earnings missed estimates and full-year guidance was cut significantly. But here's the thing—the selloff may be overdone. The stock now trades at a forward P/E of ~10, well below industry peers, and is approaching multi-year support levels.
📥 Entry Plan :
✅ Entry 1: $302.45 (market price)
✅ Entry 2: $285 (historical support zone)
✅ Entry 3: $250 (capitulation panic level)
🎯 Target Levels:
TP1: $330 – recent gap zone + psychological resistance
TP2: $360 – key horizontal + potential MLR rebound narrative
TP3: $400 – longer-term recovery level, aligns with prior institutional range
🔔 Follow me for more deep-value setups, smart risk-reward trades, and weekly strategy posts!
⚠️ Disclaimer: This content is for informational and educational purposes only and does not constitute financial advice. I am not a financial advisor. Always do your own research and consult with a qualified professional before making any investment decisions. Trading and investing involve risk, including the potential loss of capital
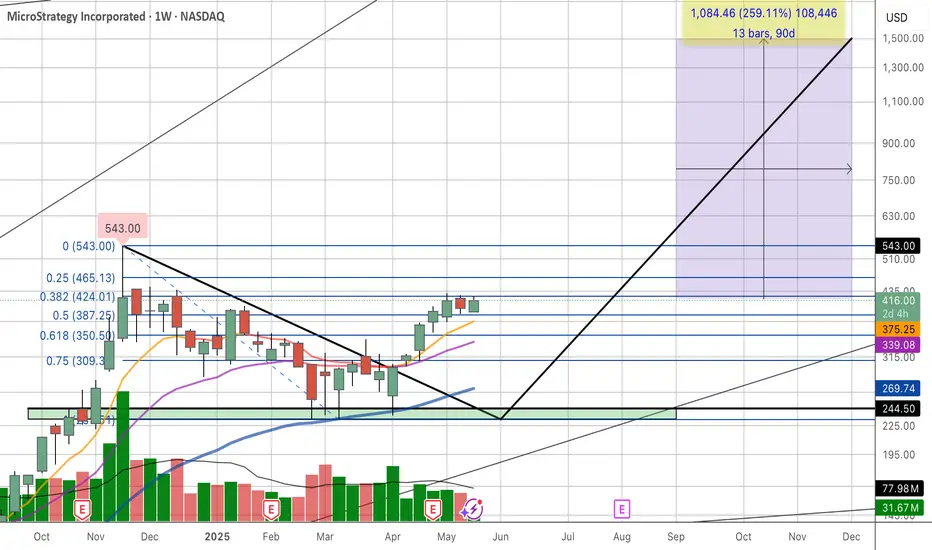
Strategy Finished Consolidating, New High With BTC Leading MicroStrategy (MSTR), the stock is currently demonstrating significant volatility and a strong correlation with Bitcoin's price movements, acting almost like a leveraged play on the cryptocurrency.
From a charting perspective, MSTR has been in a long-term bullish trend since its pivot to a Bitcoin acquisition strategy. However, it's prone to sharp corrections following Bitcoin's pullbacks, indicating high risk and reward. Key technical levels to watch would include its 200-day and 50-day moving averages as potential support and resistance zones.
The charts are now flashing strong signals that this sideways accumulation phase is drawing to a close. With Bitcoin (BTC) showing renewed strength and eyeing fresh all-time highs, MSTR, as the largest corporate holder of the digital asset, appears poised to break out. The correlation remains a potent force, and the current setup suggests MSTR is ready to re-engage its upward trajectory, targeting new price peaks in tandem with BTC
Don't Short MSFT. 2 long scenarios. Hi, I’m The Cafe Trader.
Today we’re diving into the heart of this very bullish run on MSFT. One of the key lessons I’ve learned:
Never get in the way of a strong bull trend — especially just after a breakout.
⸻
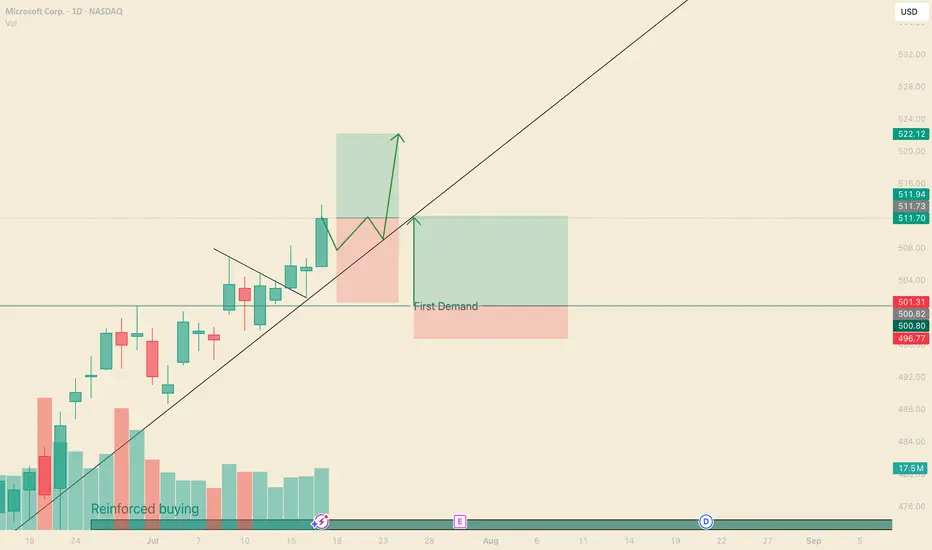
🔍 Price Action Overview:
MSFT has been respecting a strong trendline since its initial gap-up.
This has created multiple breakout trade opportunities — and we’ve just spotted another one. I’ve also outlined a secondary setup worth watching.
We recently completed a 3-bar break.
Combine that with rising volume, and this suggests a potential move to $522.23.
⏳ I’m expecting a brief consolidation (2–3 trading days) before the next leg up.
⸻
🟢 Trade Setup:
• Entry: $511.70
• Risk Level: Trade remains valid until a daily close below $500
• Reward: TP at $522.23
• Risk-to-Reward: 1:1 at entry; improves with any dip before breakout
⸻
💡 Optional Trade: Swing Trading Options
Options are about two things: price and timing.
Right now, timing looks great — but option pricing is a bit high.
The key is to go from out-of-the-money to in-the-money, and to give yourself at least 5 days on your contracts.
Here are some strike prices I’m watching (assumes expiration 7/25 or later):
• $515 Call — Entry: $2.00 or less → TP: $6.00+
• $517.5 Call — Entry: $1.30 or less → TP: $3.90+
• $520 Call — Entry: $0.70 or less → TP: $2.10+
These levels give you a strong RR if you can catch the right pullback.
⸻
🔁 Secondary Trade Idea: Bounce at $500
The $500 level is both a psychological number and a reinforced demand zone.
While it overlaps with the stop on our main setup, this trade assumes MSFT pushes higher first, then retraces to $500 for a fresh leg up.
This area will likely play a key role in future price action.
If we see a pullback into this zone with contextual selling pressure, it could offer a clean high-probability bounce.
Take profit levels would depend on how price behaves as it sells into this level — but keep this area marked.
⸻
Thanks for reading — be sure to check out my other MAG 7 analysis.
@thecafetrader
CMPS bulls are very pleased with todayCMPS had a very modest 1% pullback today after a huge 10% bull move yesterday to confirm the daily uptrend. Bulls are very happy to have seen most of those gains kept and not taken as profit.
Resistance: Daily 200 SMA, 5.15, 5.22 -> numerous weekly tops in the 5.20s
Supports: 3.50, 3.45, 3.24, 2.25

CYBN finally breaks out of its base of supportCYBN finally breaks out of 2-weeks of basing support on a very high volume bull move, close at the high of the day. I would normally anticipate a lower high below 9.83 but if this massive volume (4.5x yesterday volume!) keeps up, bulls may be able to take that level out. We will learn more in the coming days!
Resistance: Daily 200 SMA, 9.16, 9.83
Supports: 7.28, 7.11 (big red flags if lost)

MSFT - Should you Buy All Time Highs?Hello everyone, I’m TheCafeTrader.
Next up in our breakdown of the MAG 7 is Microsoft (MSFT) — this post focuses on a long-term swing trade setup.
For short-term analysis, head to my profile and check out the latest posts.
⸻
💡 The Setup:
MSFT continues to ride a strong wave thanks to AI growth, especially with Copilot and its projected impact on revenue.
Several analysts have price targets ranging from $550 to $600, which still leaves 10–20% upside from current levels.
As of this writing, MSFT closed at $511.70, about 9% above its previous all-time high — and it got there in just five weeks.
Momentum is strong, and there’s no clear sign of slowing down.
⸻
📈 Is Now a Good Time to Buy?
Let’s look at two possible strategies:
⸻
Dollar-Cost Averaging (DCA) vs. Lump-Sum Investing
If you’re unfamiliar with DCA: it’s a strategy where you buy in gradually over time.
Say you have $5,000 set aside for MSFT — you might invest $1,000 now and continue adding monthly.
This is a smart approach in choppy or uncertain markets, but MSFT is not showing weakness right now.
Historically, when strong stocks are in clear bull trends, lump-sum investing outperforms DCA.
So if you’re confident in MSFT’s long-term potential — and want exposure to the current momentum — a full position now could make sense.
If you’re looking for a better price or want to scale in patiently, keep an eye on these key zones.
⸻
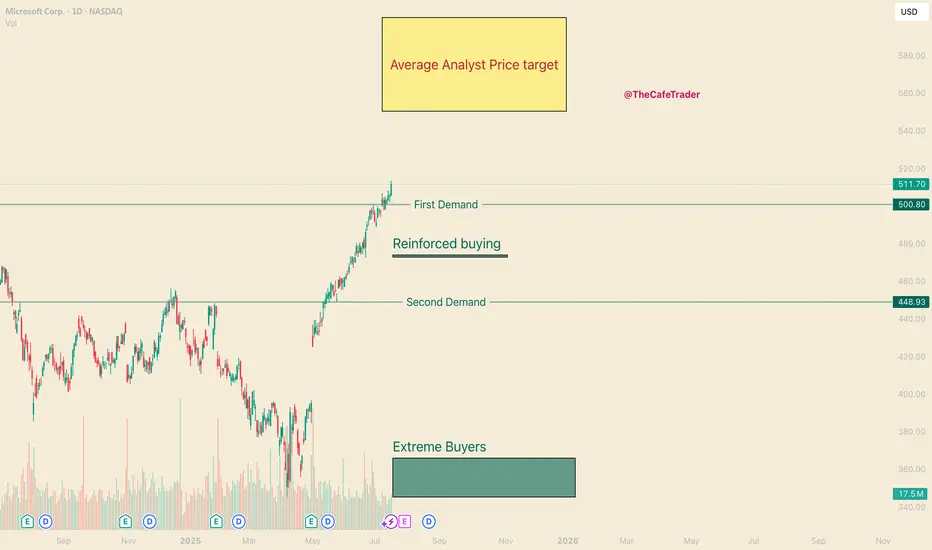
🧭 Areas of Interest on the Chart:
1. Yellow Box (Target Zone):
→ $550–$600 is the broader analyst price target range.
2. First Demand Line (~$500):
Recent signs of active buyer interest. If bulls remain in control, this could act as a springboard.
3. Reinforced Buyer Zone (~$472–$474):
This area has been tested and defended before. It’s a strong pullback entry if momentum stalls.
4. Second Demand Line (~$449):
A previous base of institutional accumulation. Price may revisit here in a broader market dip.
5. Deep Buyer Zone (~$344–$365):
A rare but powerful level where big money entered aggressively. It’s unlikely we revisit this zone — but if we do, it could be a great buy.
⸻
🧠 Strategy Summary:
• Aggressive buyers may consider entering around $500, where recent demand appeared.
• More patient traders might wait for MSFT to pull back into the $449–$474 range, where institutional interest has been high.
• The $344–$365 zone is a long shot — but would be a massive value area if touched.
⸻
That’s it for the long-term outlook on MSFT.
For more short-term trades and entries, check out my other posts — especially as we continue tracking the MAG 7.
@thecafetrader
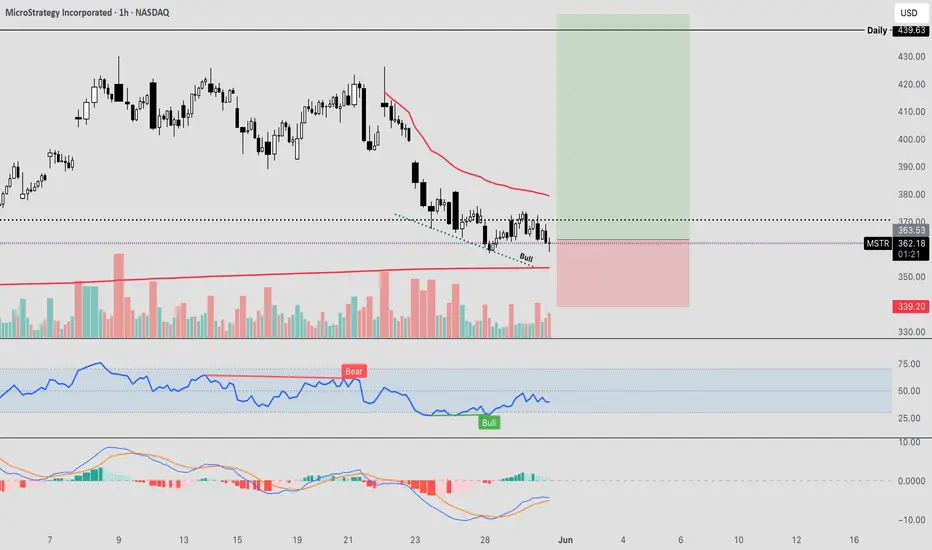
MSTR Bull DivergenceMSTR has seen a fast and sharp correction after rallying nearly 70% into some key levels of resistance , and currently pulling back into the longer term downtrend VWAP, as an attempt to flip the current downtrend.
This zone around $360 is very crucial for me personally, as we are attempting to hold the previous pivot high, and setting a firm low for continuation of the uptrend.
On the hourly timeframe we are finally starting to see some potential absorption here as price continues to make new lows, however the overall strength on the RSI is unable to continue making progress lower.
This is suggesting that the selling pressure may be running low, and MSTR can be due for a bounce.
I have laddered into this current position , and would de-leverage my risk if we start to break the lows as that could be quite a bearish sign, in the meantime, I would like to see some relief after such a harsh downtrend.
ATAI bulls look primed for another leg upATAI gave us the highest close we've seen in nearly 3 years today as bulls closed at high of the day approaching resistances from the gap up on July 1st. Today saw 2x the volume traded yesterday which is a great sign when looking for daily continuation.
Anticipate resistance at 2.81. 3.00, 3.01, and weekly 200 SMA
Red flag from here would be to fail at 3.00 and reverse to break below 2.53.

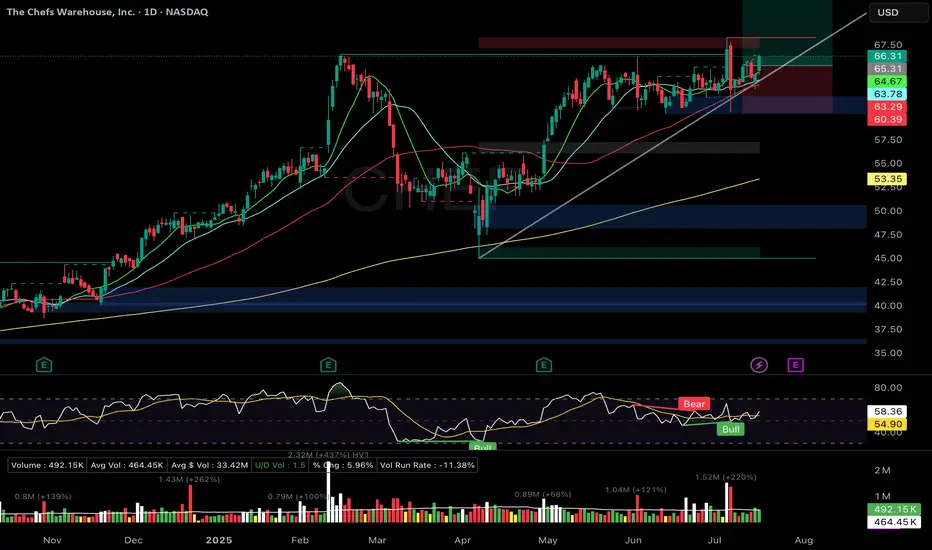
CHEF - Hammer off 21DMA + volume surge. Tight coil forming.CHEF – Chef’s Warehouse
Setup Grade: B+
• Entry: $66.35 (7/17)
• Status: Active
• Trailing Stop: $62.30 (2x ATR)
• Setup: Hammer off 21DMA + volume surge. Tight coil forming. RSI ~58.35.
• Plan: Watch for squeeze breakout confirmation. Manage with trailing stop.
• Earnings: July 3
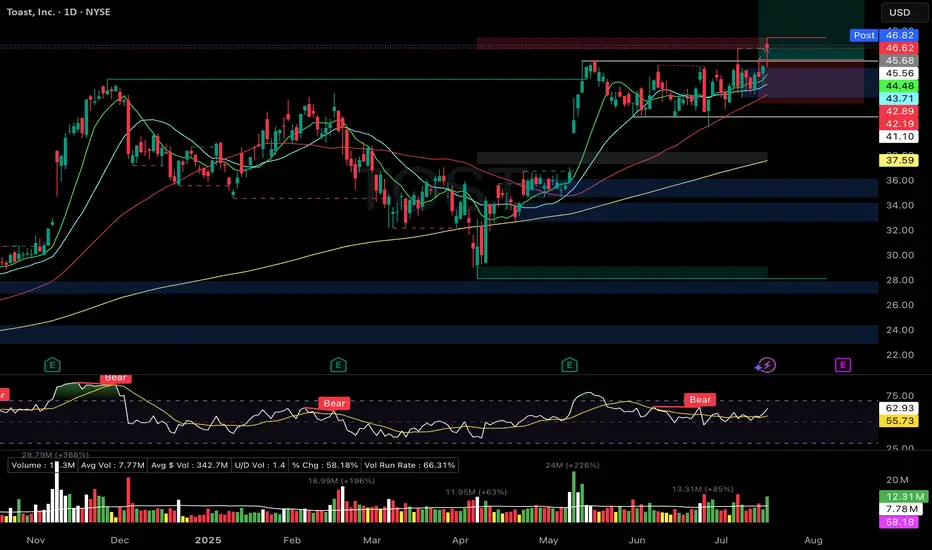
TOST – Flat base breakout. Volume confirmation. Hammer off 21DMATOST – Toast Inc.
Setup Grade: A-
• Entry: $45.68 (7/15)
• Status: Active
• Trailing Stop: $43.96 (2x ATR)
• Setup: Flat base breakout. Volume confirmation. Hammer off 21DMA. RS: 92.
• Plan: Manage breakout hold. Raise stop if price holds above $46.
• Earnings: August 5
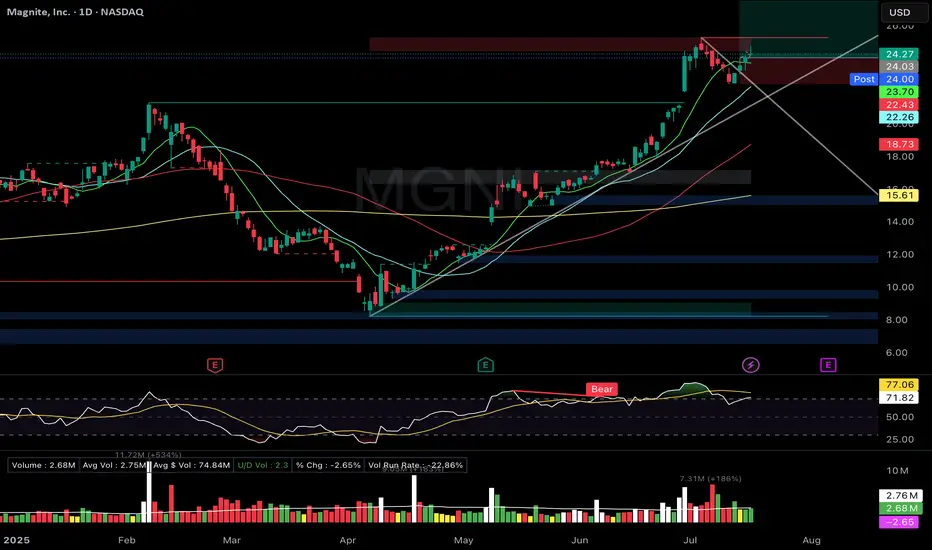
MGNI- Flag breakout. Long upper wick → cooling expectedMGNI – Magnite Inc.
Setup Grade: B+
• Entry: $24.03 (7/17)
• Status: Active
• Stop: $22.43
• Setup: Flag breakout. Long upper wick → cooling expected. RSI ~71.8 (overbought). ATH = $25.27.
• Plan: Hold unless stop breaks. Let RSI cool, watch for continuation.
• Earnings: August 6
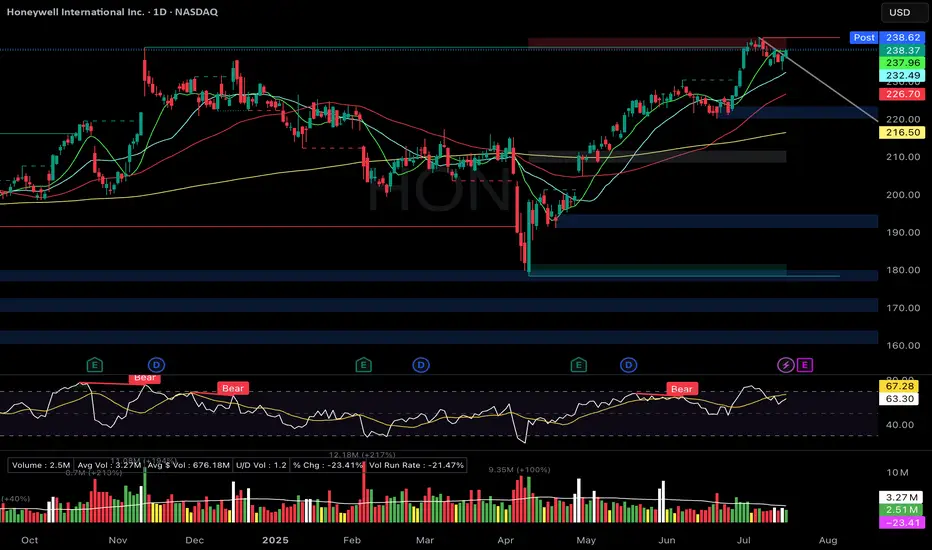
HON Bull flag + hammer off 21EMAHON – Honeywell
Setup Grade: A
• Entry: $238.12 (7/17)
• Status: Active
• Trailing Stop: $6.85 (2x ATR)
• Setup: Aerospace/defense leader. Bull flag + hammer off 21EMA. RSI ~63.
• Target: $256 (measured move). ATH = $242.77
• Plan: Hold through breakout → blue sky setup.
• Earnings: July 24
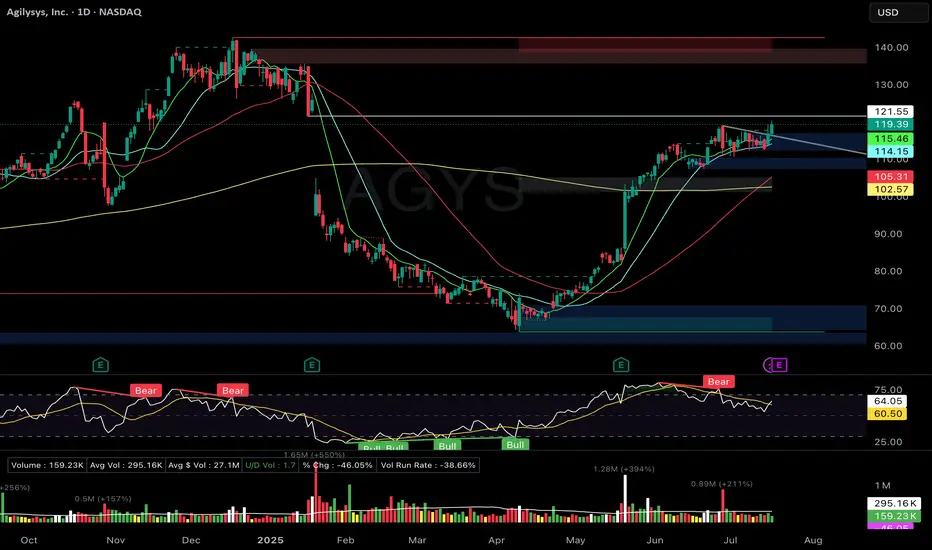
AGYS Wedge breakout + volume, gap fillAGYS – Agilysys Inc.
Setup Grade: A-
• Entry: $119.75 (7/17)
• Status: Active
• Trailing Stop: $7.60 (2x ATR) below 21DMA
• Setup: Wedge breakout + volume. RSI ~64. Resistance: $121.50 → $135.59 → ATH $142.64.
• Plan: Watch $121.50 for gap fill breakout. Raise stop if momentum builds.
• Earnings: July 21
SMR Bullish flag breakout from 21DMA → new ATHSMR – NuScale Power Corp.
Setup Grade: A
• Entry: $38.78 (7/14)
• Exit: $46.00 (7/17) → Gain: +18.6%
• Setup: Bullish flag breakout from 21DMA → new ATH ($49.27). RSI hit 70.
• Exit Reason: Doji star at highs. Expected pullback to 21DMA (~$38.89).
• Plan: Re-enter if reversal near $33.63 confirms with hammer + volume.

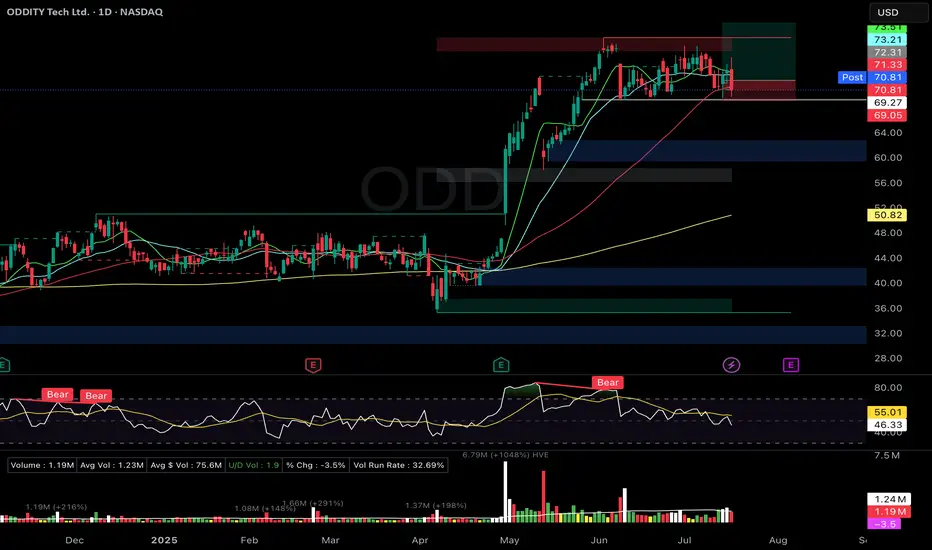
ODD – 6-week Stage 2 flat base, Hammer reversal, Tight MA'sODD – Oddity Tech Ltd.
Setup Grade: B-
• Entry: $72.31 (7/15)
• Exit: $71.04 (7/17) → Loss: -1.75%
• Setup: 6-week Stage 2 flat base, 30% depth. Hammer reversal off 50DMA. Tight MA cluster (10/21/50DMA). Accumulation volume.
• Reason for Exit: Lacked follow-through. RSI falling. Sideways structure vs. rising market. Freed capital.
• Plan: Watch for fresh setup with RS improvement.
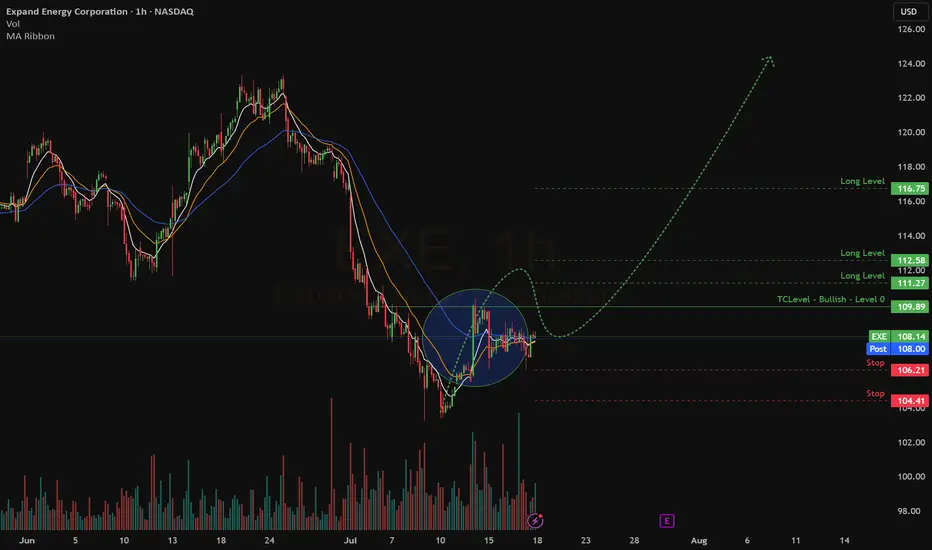
Quick View : $EXEHourly Chart. Nice Box sitting on the ema 50 while the faster emas are trying to create a bullish crossover.
Bullish ATR Break already out