Ball Corporation Quote | Chart & Forecast SummaryKey Indicators On Trade Set Up In General
1. Push Set Up
2. Range Set Up
3. Break & Retest Set Up
Notes On Session
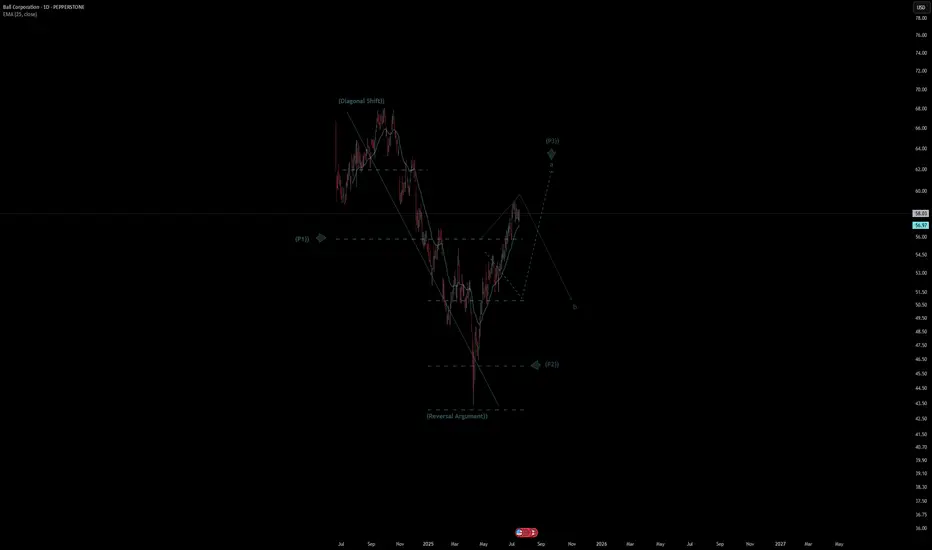
# Ball Corporation Quote
- Double Formation
* (Diagonal Shift)) At 67.00 USD | Completed Survey
* (Reversal Argument)) - *Fractional Spike | Subdivision 1
- Triple Formation
* (P1)) / (P2)) & (P3)) | Subdivision 2
* (TP1) = a / Long Consecutive Range
* (TP2) = b / Short Consecutive Pullback | Subdivision 3
* Daily Time Frame | Trend Settings Condition
- (Hypothesis On Entry Bias)) | Regular Settings
- Position On A 1.5RR
* Stop Loss At 53.00 USD
* Entry At 58.00 USD
* Take Profit At 65.00 USD
* (Uptrend Argument)) & No Pattern Confirmation
- Continuation Pattern | Not Valid
- Reversal Pattern | Not Valid
* Ongoing Entry & (Neutral Area))
Active Sessions On Relevant Range & Elemented Probabilities;
European-Session(Upwards) - East Coast-Session(Downwards) - Asian-Session(Ranging)
Conclusion | Trade Plan Execution & Risk Management On Demand;
Overall Consensus | Buy
SCWO: High Risk, Big Potential374Water Inc. (NASDAQ: SCWO) is a U.S.-based environmental technology company specializing in waste management solutions. Their flagship innovation, AirSCWO™, utilizes supercritical water oxidation to effectively destroy organic waste, including PFAS and other contaminants. This technology is particularly relevant for municipal, industrial, and military applications.  
⸻
📈 Bullish Catalysts
1. Government Contracts & DoD Engagement: 374Water’s AirSCWO™ technology has been deployed in a Department of Defense Environmental Security Technology Certification Program (ESTCP) project, highlighting its potential in federal applications. 
2. Analyst Optimism: Analyst projections suggest a significant upside, with some forecasts estimating the stock could reach $2.55 within the next 12 months, representing over a 1,100% increase from current levels. 
3. Insider Ownership: Approximately 20.3% of the company’s stock is held by insiders, indicating a strong belief in the company’s future prospects. 
4. Revenue Growth Potential: Projections indicate a substantial increase in revenue, with expectations of $26.93 million this year and $55.69 million the following year, up from $0.45 million. 
⸻
📊 Technical Analysis
As of July 17, 2025, SCWO is trading at $0.23. Technical indicators present a mixed picture: 
• Moving Averages: Short-term moving averages (MA5 to MA50) suggest a bullish trend, while longer-term averages (MA100 and MA200) indicate bearishness. 
• Momentum Indicators: The Relative Strength Index (RSI) is at 72.6, suggesting the stock is overbought. The MACD is positive, indicating upward momentum. 
• Volatility: The Average True Range (ATR) is 0.0083, reflecting high volatility. 
⸻
🔮 Price Prediction
Analyst forecasts for SCWO vary:()
• Short-Term: Some models predict a modest increase to $0.50 by the end of 2025. 
• Long-Term: Optimistic projections estimate the stock could reach $2.55 within 12 months. 
⸻
⚠️ Risk Considerations
Despite the bullish catalysts, investors should be cautious due to the company’s current financial metrics:()
• Negative Earnings: The company has a negative net income of -$12.43 million and a net profit margin of -2,791.39%. 
• High Volatility: The stock exhibits significant price fluctuations, which may not be suitable for all investors.()
• Market Sentiment: Technical indicators suggest the stock is currently overbought, which could lead to a price correction.()
Coca Cola to protect my portfolio and help it growOne of the most important things we must try to determine as investors is what company is the best at what they do in their field. In my opinion Coca Cola is and has always been the number one soft drink manufacturer, always finding new yet subtle ways to stay ahead of their competition.
The reason I have allocated a decent amount of my portfolio to Coca Cola is a combination between their reliable track record of creating value, and paying dividends. People love junk food so it gives me high conviction to hold the stock long term. The company also demonstrates consistent, and reliable methods of generating organic revenue, and constantly finding new ways to cut costs and improve their profit margins.
Despite what some other critics may claim about the stock being over valued, the intrinsic value of the stock happens to be $77 with a range between $48-$180. According to technical analysis it is over valued. I have too much respect for Coca Cola to trust technical analysis in my decision to hold the stock, I am rely solely on fundamentals. According to my perspective on the company it is in fact undervalued.
Another positive catalyst I have noticed was when President Trump said he thinks Coca Cola should be made with cane sugar in the US, I think that would be a great idea, not only would it be healthier the soda would also taste better. Coca Cola looks like its going to stay ahead of the game for the foreseeable future.
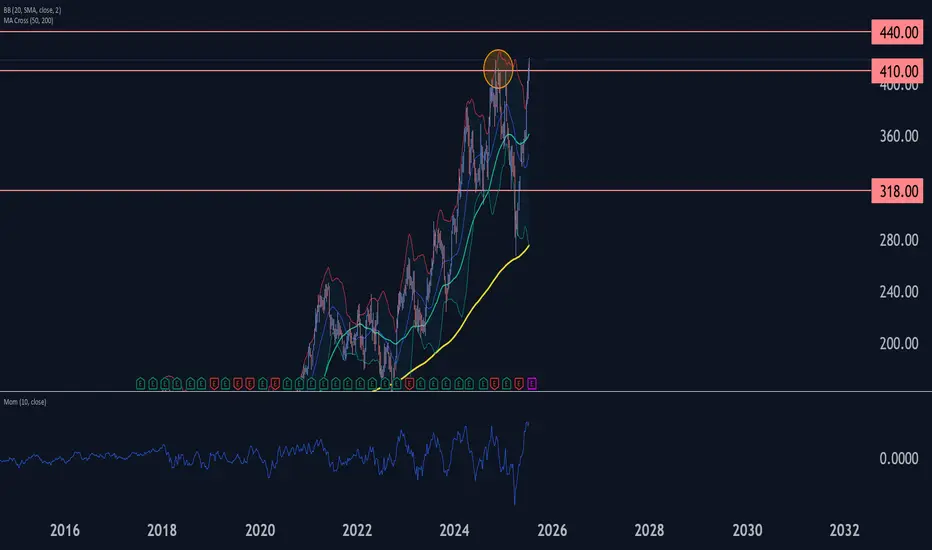
Caterpillar Wave Analysis – 17 July 2025
- Caterpillar broke long-term resistance level 410.00
- Likely to rise to resistance level 440.00
Caterpillar recently broke above the major long-term resistance level 410.00, which has been reversing the price from the end of 2024, as can be seen from the weekly Caterpillar chart below.
The breakout of the resistance level 410.00 accelerated the active intermediate impulse wave (C) from the middle of 2025.
Given the overriding weekly uptrend and the accelerating weekly Momentum, Caterpillar can be expected to rise to the next resistance level 440.00 (target for the completion of the active intermediate impulse wave (C)).
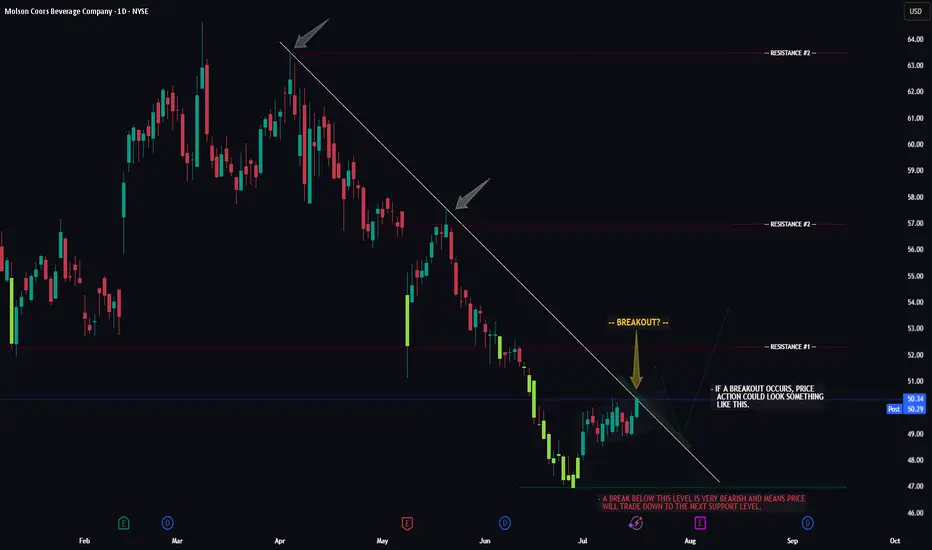
TAP -- Breakout Attempt -- Target LevelsHello Traders!
The chart of TAP (Molson Beer co.) is currently flirting with a major resistance trendline. Now whether or not price can successfully seal the deal and make it too third base remains to be seen.
If price does breakout, watch for a potential retrace to the breakout trendline first, then we could see the larger move to resistance level #1.
If price gets rejected and fails to breakout we could see a move below support before it attempts to breakout again.
Thanks everyone and best of luck with your trading journey!
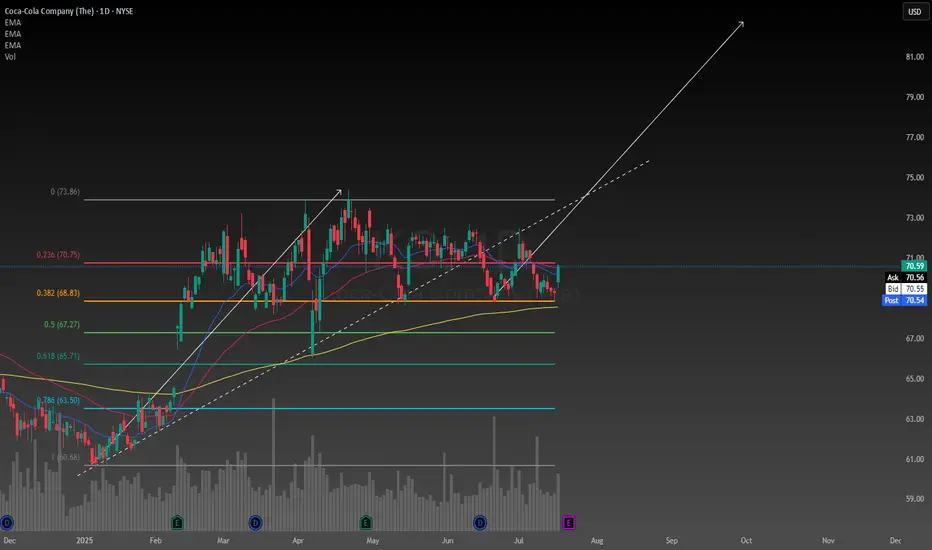
Coca-Cola Wave Analysis – 17 July 2025- Coca-Cola reversed from the support area
- Likely to rise to resistance level 72.00
Coca-Cola recently reversed from the support area between the key support level 68.55 (which has been reversing the price from May), lower daily Bollinger Band and the 38.2% Fibonacci correction of the upward impulse (1) from January.
The upward reversal from this support area stopped the previous minor ABC correction (ii).
Coca-Cola can be expected to rise to the next resistance level 72.00 (which stopped the earlier waves B, 1 and i).

Bullish for a new highI see a good confirmation for a bullish move to form a new high.
2 entry points with SL under last low.
Not a financial advice. tell me your thoughts
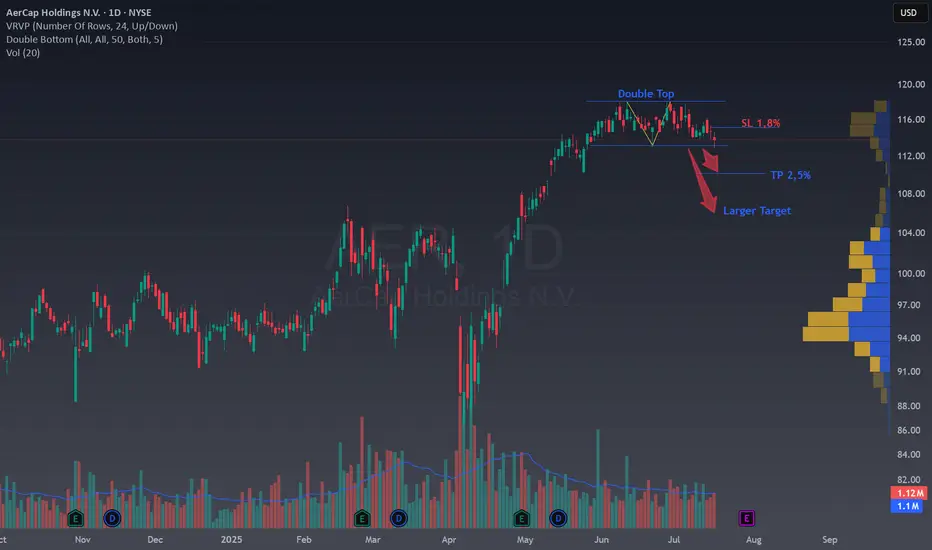
Double Top Breakdown on AER 🧠 Double Top Breakdown on NYSE:AER
Ticker : AerCap Holdings N.V. (AER)
Timeframe : 1D (Daily Chart)
Pattern : Double Top
Strategy : Bearish Reversal
✍️ Analysis
We’ve got a textbook Double Top forming after a strong bullish rally. Price failed to break above the $118 resistance twice, forming the classic M-shape. The neckline is around $113.50, almost broken.
This setup is supported by:
✅ Clean pattern structure
✅ Volume Profile (VPVR) shows a low-volume gap below current price
✅ Good Risk/Reward structure
🎯 Trade Setup
Entry : Below $113.50 (neckline break)
Stop Loss : Above $115.50 (1.8% risk)
Take Profit 1 : Around $110 (2.5% target)
Larger TP target: $106 – matches VPVR high-volume node and pattern projection. It's also a Fibo retracement level of 38,2% of the rally.
📘 Educational Notes
This is a great example of how a Double Top can signal the end of a bullish trend (at least temporary) and the start of a pullback or reversal. The volume gap below may accelerate the move. Managing risk with a tight SL and scaling out at TP1 and TP2 is key here.
💬 What do you think? Are you seeing the same setup on your end?
👍 Hit the rocket if you found this useful and follow for more clean technical setups!
Bershire Hathaway Stock Analysis/BRK.AI looked at this particular stock because of insane activity from $623,302 to $741,590 in one day. That rejection told me to pay attention Money was coming to the door. So if the market is approaching this area again, rejection is the likely response. Looking at a short is temporary. This market is bullish in nature.

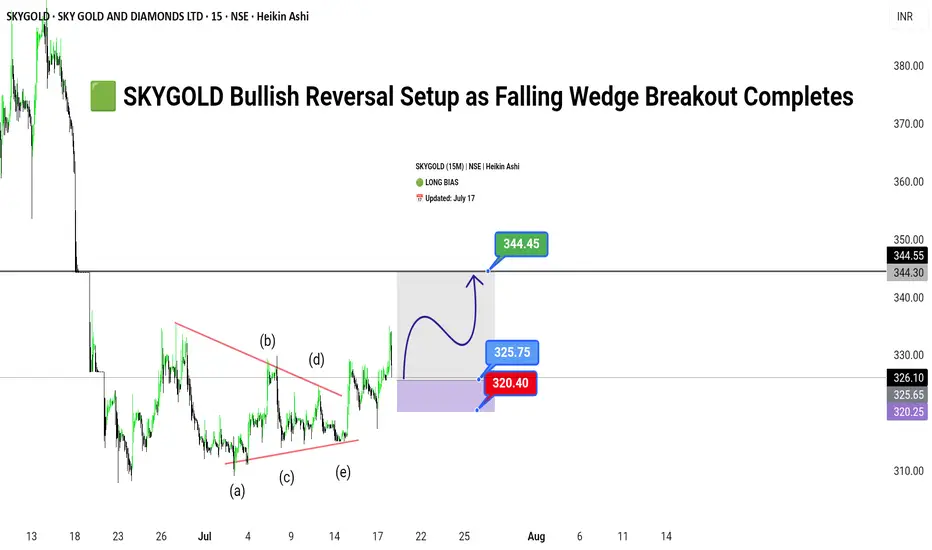
SKYGOLD Bullish Reversal Setup as Falling Wedge Breakout Complet🟩
SKYGOLD (15M) | NSE | Heikin Ashi
🟢 LONG BIAS
📅 Updated: July 17
---
🔍 Description
SKYGOLD has emerged from a prolonged corrective phase, breaking out of a well-defined falling wedge pattern on the 15-minute chart. The price action has respected a clean Elliott Wave ABCDE structure within the wedge, suggesting a completed consolidation cycle. With bullish momentum building above ₹325, the stock now appears poised for a breakout rally towards ₹344.45.
This setup reflects both a technical breakout and possible short-covering rally, making it an attractive opportunity for short-term swing traders. However, risk remains below the ₹320.40 zone, which invalidates the breakout structure if breached.
---
📊 Technical Structure (15M)
✅ Breakout above wedge resistance
✅ ABCDE wave structure complete (classic consolidation)
✅ Impulse targets in sight
📌 Upside Targets
First: ₹325.75
Final: ₹344.45
🔻 Risk Zone
Below: ₹320.40 (Breakdown invalidates setup)
---
📈 Fundamental/Flow Highlights
Sector Sentiment: Positive traction in mid-cap jewellery and gems segment.
Volume Spike: Notable rise in volume on breakout candle.
Short-Covering Potential: Highly likely due to prolonged consolidation.
---
⚠️ Risks to Watch
Sudden broad market correction in Nifty Midcap segment.
Lack of follow-through volume post-breakout.
Intraday rejection near ₹344 zone (previous supply).
---
🧭 Summary: Bias and Watchpoints
SKYGOLD is bullish above ₹325 with a breakout structure favoring continued upside toward ₹344.45. As long as the price holds above ₹320.40, the long thesis remains valid. Watch volume confirmation, and use trailing SL to lock gains.
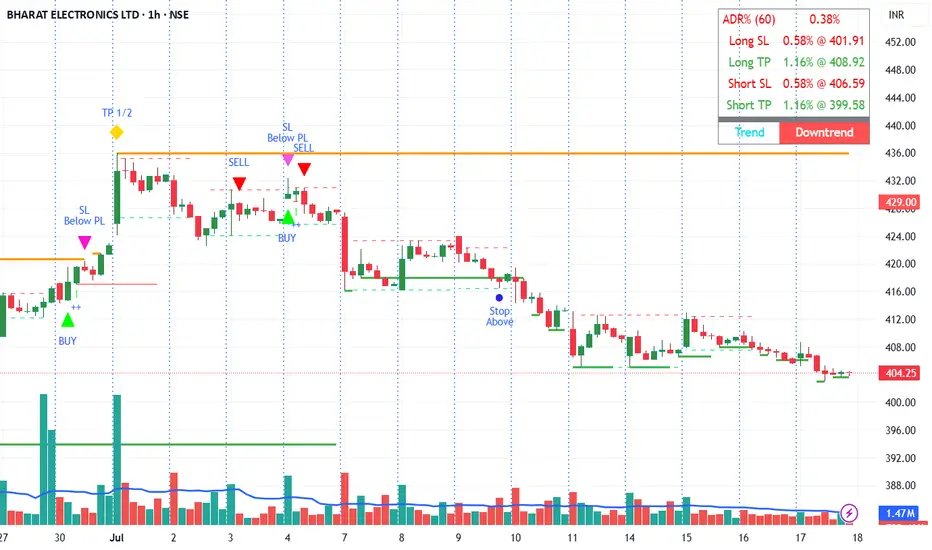
Recent trades on BHARAT ELECTRONICS LTDBHARAT ELECTRONICS LTD, Signal auto-generated by our Private Indicator, Serious traders can contact us for information.
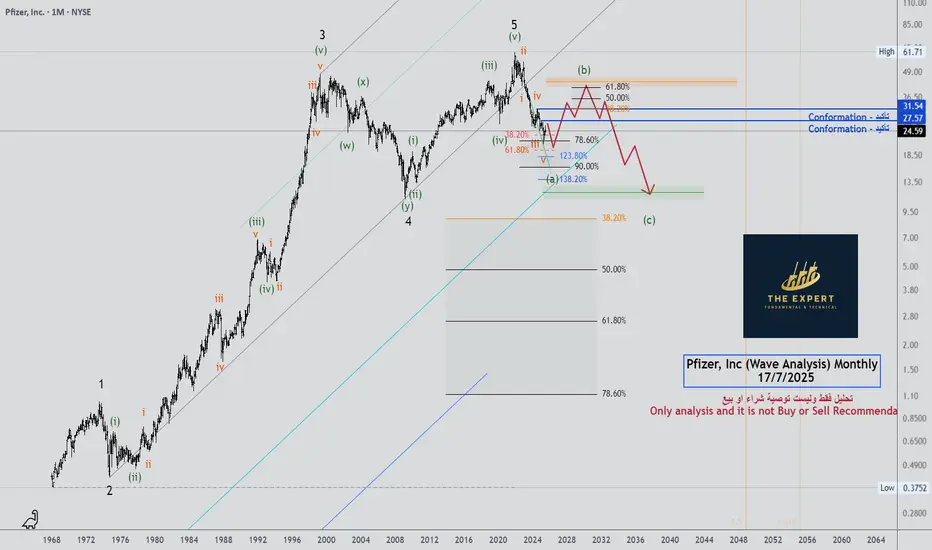
Pfizer, Inc (Wave Analysis) Monthly - Update 17/7/2025Pfizer, Inc (Wave Analysis) Monthly - Update 17/7/202
See the chart
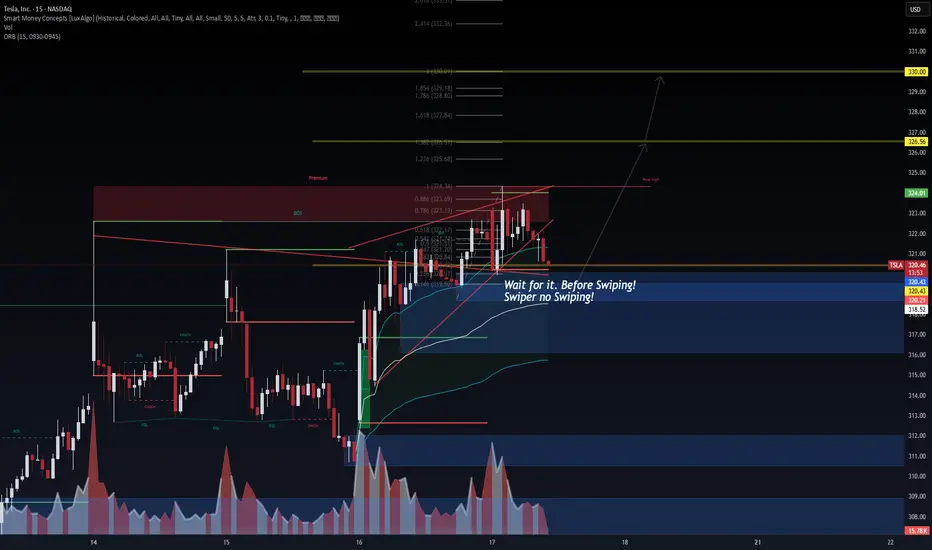
TSLA: Time for the 2/3 rally?TSLA remains tightly wedged inside a bullish pennant, hovering just above the ORB high (324.01) and within the premium SMC zone. Smart Money structure is clear:
🔹 Bullish BOS + CHoCH stacking
🔹 Fibonacci confluence from 0.618 to 0.886 holding strong
🔹 Hidden demand resting at 320.21 / 318.66 zone
🧠 VolanX DSS Logic:
Break above 324.34 unlocks liquidity toward 1.236 = 325.68, then key magnet zone 326.56
Liquidity sweep + micro pullback ideal entry signal
Volume shows absorption at each higher low → bullish intent
🎯 Trade Plan (15m):
Entry: 322.00–324.00 with confirmation
Target: 326.56 → 328.18
Invalidation: Below 320.21 BOS flip
ORB + Fib + SMC stack = High-conviction directional play
💬 Price may seek inefficiencies left in prior imbalance zones below, but current order flow favors upside continuation.
📢 This analysis is powered by the VolanX Protocol under WaverVanir DSS — where liquidity meets logic.
#TSLA #WaverVanir #VolanX #SMC #DayTrading #Fibonacci #ORB #SmartMoneyConcepts #Tesla #MacroEdge #OptionsFlow
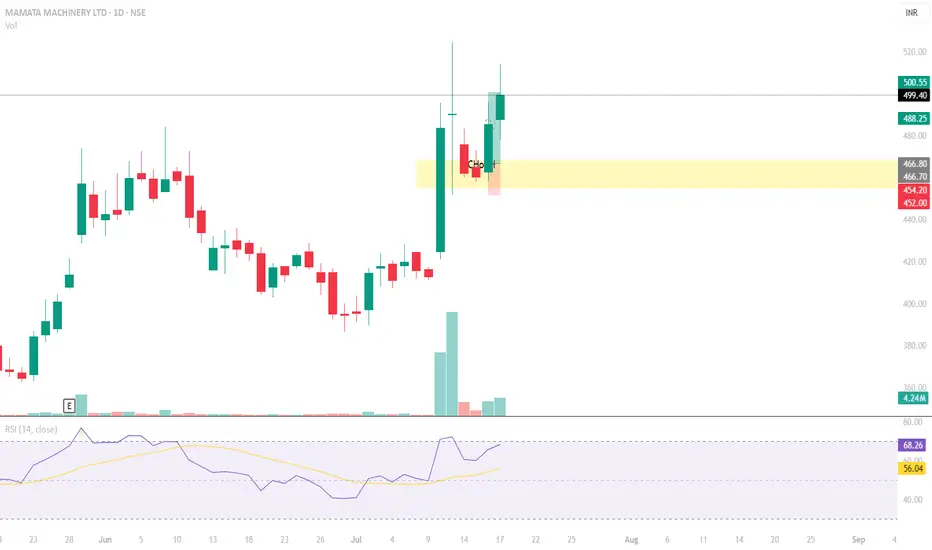
MAMATA MACHINERYTP HIT !!!
Had taken this stock at golden zone of fibnoacci retracement and had targeted the last high.
Although i closed all my positions at 1st TGT, the stock did hit my TP
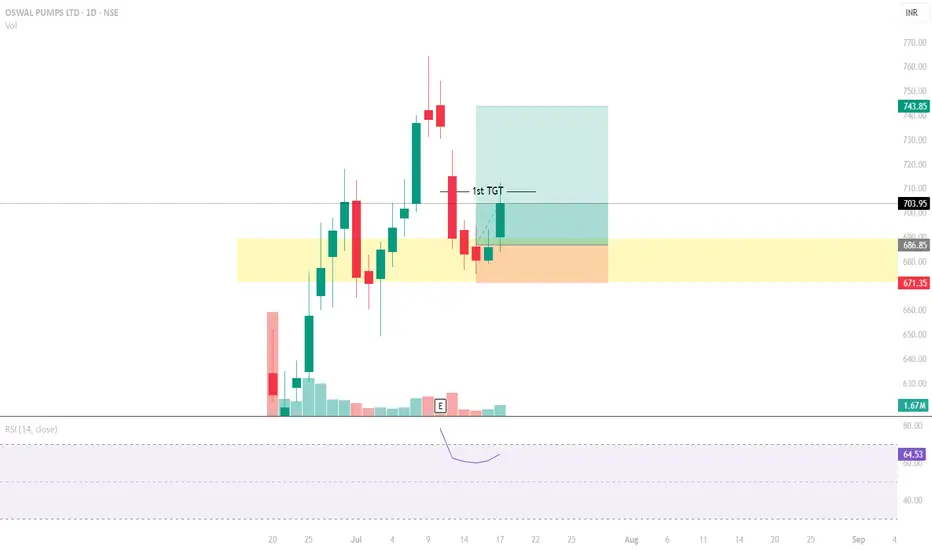
OSWAL PUMPSBased on my earlier prediction, the stock moved in my favour.
Also, i have exited all my positions at 1st TGT level
PATH --- Pop?PATH — Setting Up for a Pop?
UiPath (PATH) is showing signs of strength as it builds a base just above key Fibonacci support and prepares for a potential breakout in the broader AI + Robotics narrative.
Technical Setup:
Price holding above the 38.2% Fib retracement from the May rally.
Volume shelf + value area support at ~$12.30–$12.50 creating a launchpad.
21/50/200 SMAs converging — this type of compression often precedes expansion.
TTM Squeeze building pressure — prior squeezes on this name have led to fast directional moves.
Fundamental Tailwinds:
PATH is an automation leader riding the AI + enterprise software wave.
Sector rotation into Robotics and AI names (SYM, ROK, RR) lifting sentiment.
Recent dark pool activity shows accumulation—large 8M+ share blocks suggest institutional interest.
Thesis:
A close above $12.70 could trigger a move into the $13.40–$14.60 resistance zone, with a possible gap fill toward $18 on strong momentum.
Risk:
Invalidation below $11.80 (50% retracement / SMA cluster). Tight risk-reward if using LEAPs or long shares.
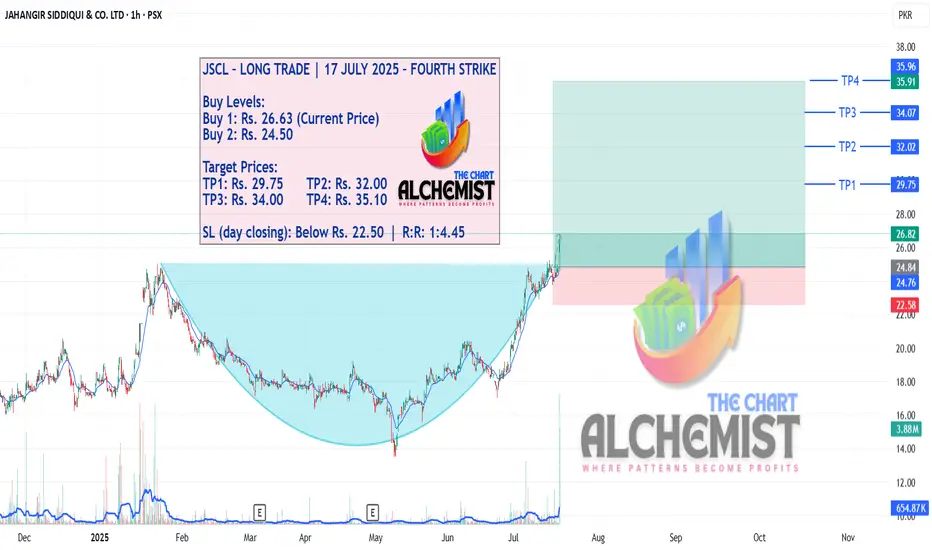
JSCL – LONG TRADE | 17 JULY 2025 – FOURTH STRIKEJSCL – LONG TRADE | 17 JULY 2025 – FOURTH STRIKE
After three successful previous buy calls, JSCL is offering another opportunity. The stock has broken out of a SLOP formation, indicating potential continuation of the bullish trend with strong upside targets.
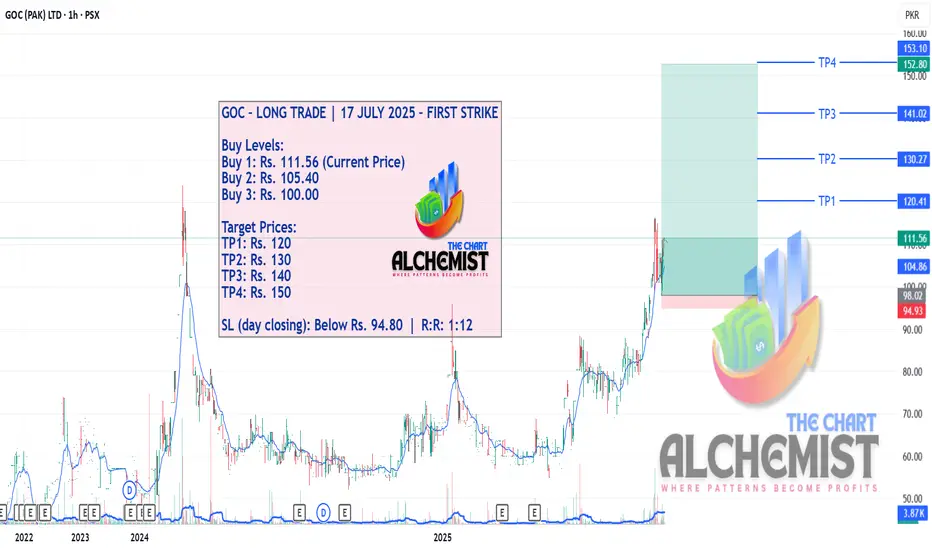
GOC – LONG TRADE | 17 JULY 2025 – FIRST STRIKEGOC – LONG TRADE | 17 JULY 2025 – FIRST STRIKE
GOC broke structure to the bullish side, hit a high of Rs. 116, pulled back shallowly, and has now resumed its upward trajectory. The current setup provides a high-probability long opportunity.
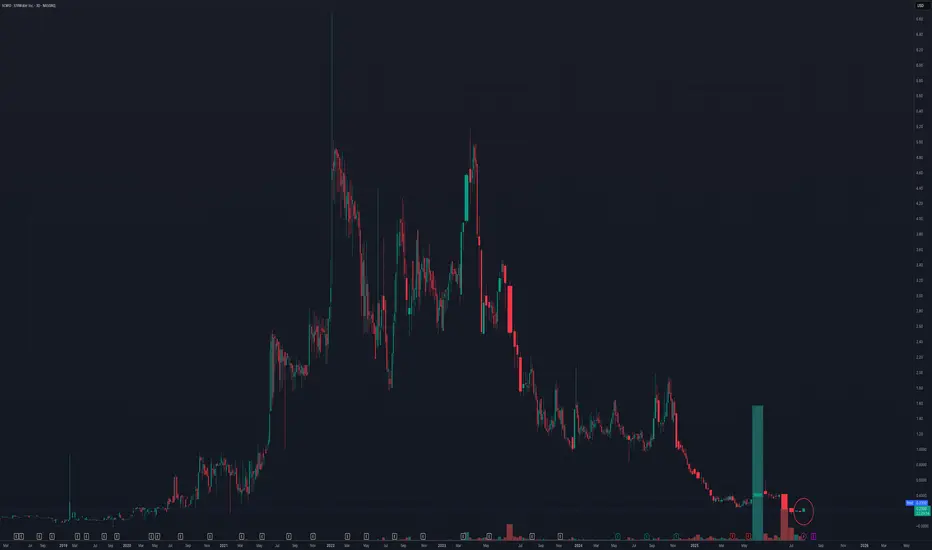
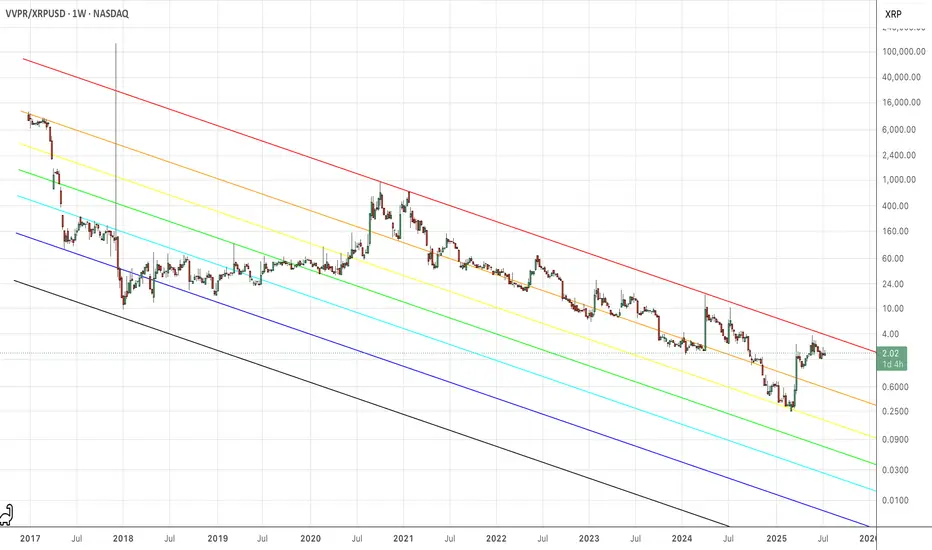
VVPR/XRPHere's my VVPR/XRP fib channel. We're looking pretty good as the ratio spends too much time betwixt the .786 and the 1. It comes on the back of XRPUSD ascending triangle breakout. I've also shown you the VVPR/BTC bearish fib channel currently breaking out for the 1-level. So, both in Ripple and in Satoshis, Vivopower is going for the 1-level bear fib. It means Vivo will run bullish Ripple, while Ripple is running bullish in sats.
Thank you for your kind attention.
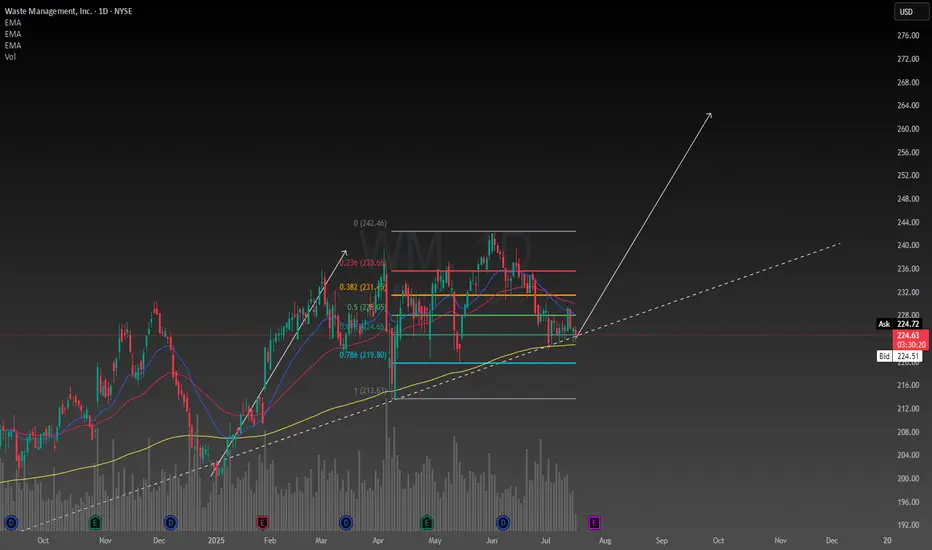
Waste Management confluencesFirst of all fundamentally the company is basically essential to our survival so I have no reason to believe they will go out of business any time soon. Earnings report soon should bring about some volatility. I was foolish enough to buy the top a couple months ago and deciding today I will add the the position because I like this price. Even though I bought the top, it was still below the intrinsic value at the time so it was a reasonable decision.
With my simple trendline and rudimentary use of a Fibonacci I am able to set a price target of $260 depicted by my drawing of a potential new leg up. This is backed up by the absolutely fundamental usage of a calculation of the intrinsic value, which by my calculation is $280, and has a range between $170-$640 however these numbers may need to be adjusted after the earnings report. The value is now well below the intrinsic value so I am seeing this stock as a really good deal now.
Despite any uncertainty in the economy Waste Management has seemed to outperform during these times so it is in my portfolio defensively. This stock is strong when it needs to be, which is why I like it.
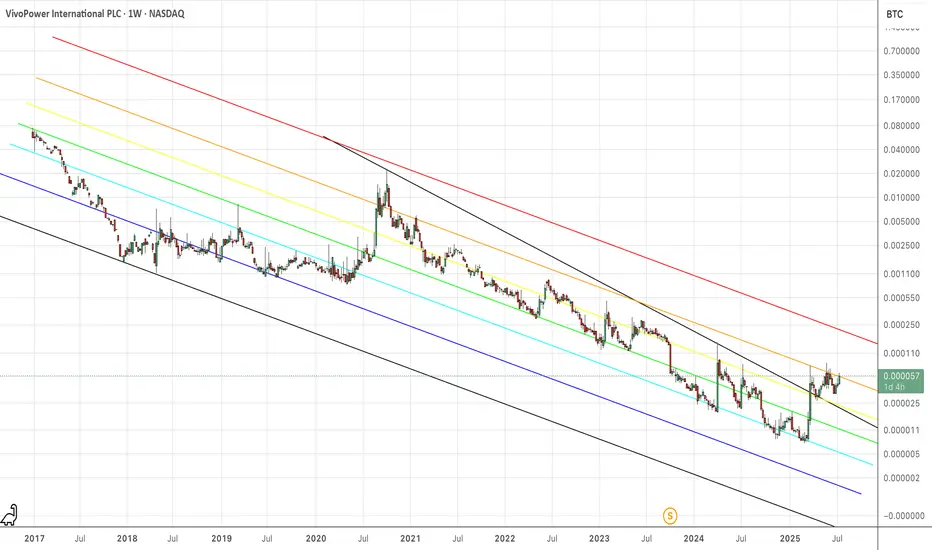
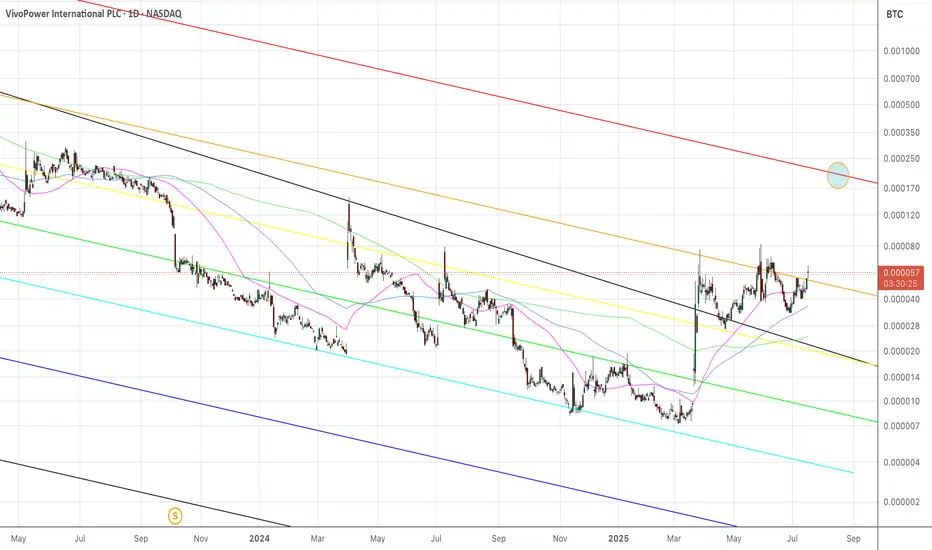
VVPR/BTCTop of the descending fib channel is about 260% pump in Satoshis. That's the point at which the bears start to rethink their decisions. If the ratio breaks out from the all-time bear fib, then it can run macro bullish sats. It's nearly impossible to find a ticker in your brokerage account that runs bullish sats for any length of time, but when you find it, it's nice to see.
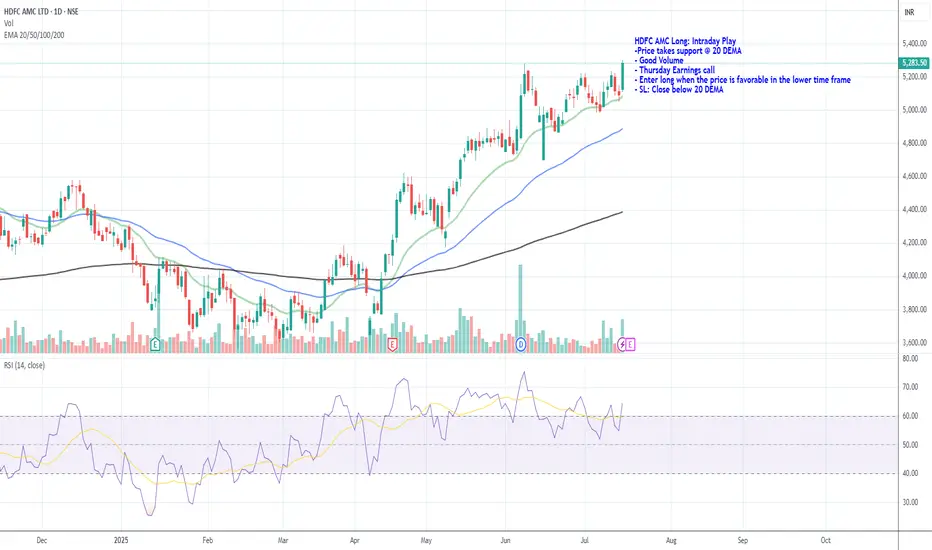
HDFC AMC Long: Intraday PlayHDFC AMC Long: Intraday Play
-Price takes support @ 20 DEMA
- Good Volume
- Thursday Earnings call
- Enter long when the price is favorable in the lower time frame
- SL: Close below 20 DEMA
Vivopower in SatoshisAnother view of VivoPower, but denominated in Satoshis. You can see my other chart of VivoPower denominated in Ripple. Everything is looking very bullish for VVPR as it breaks out, and tests the top of the sat fib channel.
Lots of crazy action in extended hours, which is great to see, and volume running 3X trailing average at 9:00am in the morning.
Good luck out there.