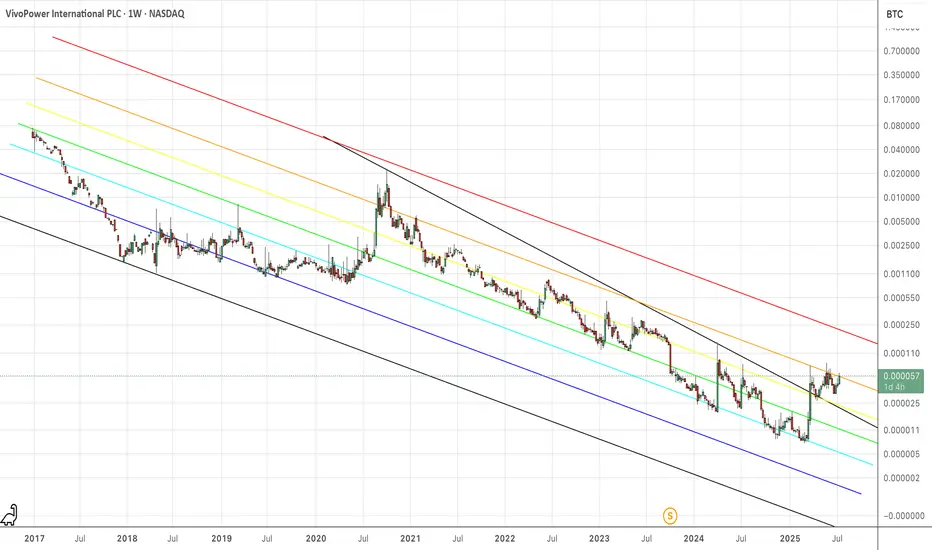
VVPR/BTCTop of the descending fib channel is about 260% pump in Satoshis. That's the point at which the bears start to rethink their decisions. If the ratio breaks out from the all-time bear fib, then it can run macro bullish sats. It's nearly impossible to find a ticker in your brokerage account that runs bullish sats for any length of time, but when you find it, it's nice to see.
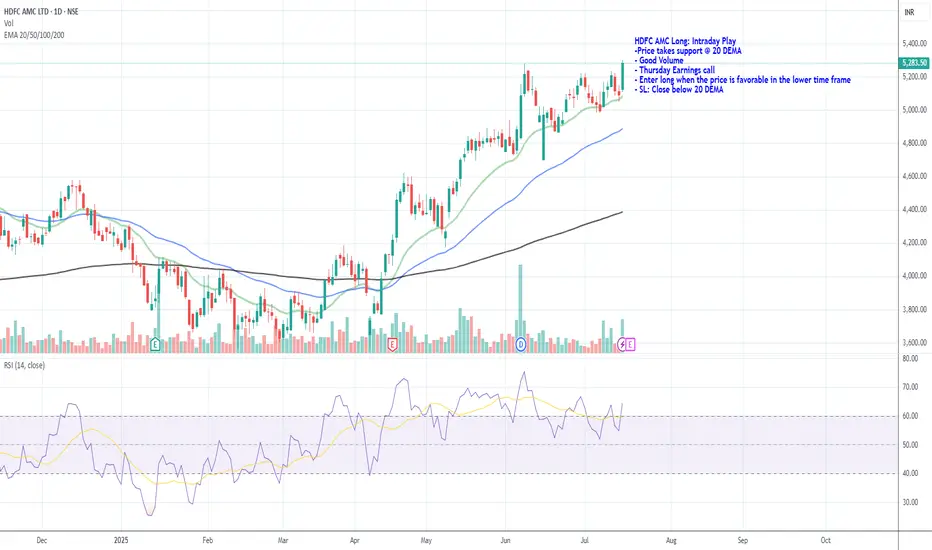
HDFC AMC Long: Intraday PlayHDFC AMC Long: Intraday Play
-Price takes support @ 20 DEMA
- Good Volume
- Thursday Earnings call
- Enter long when the price is favorable in the lower time frame
- SL: Close below 20 DEMA
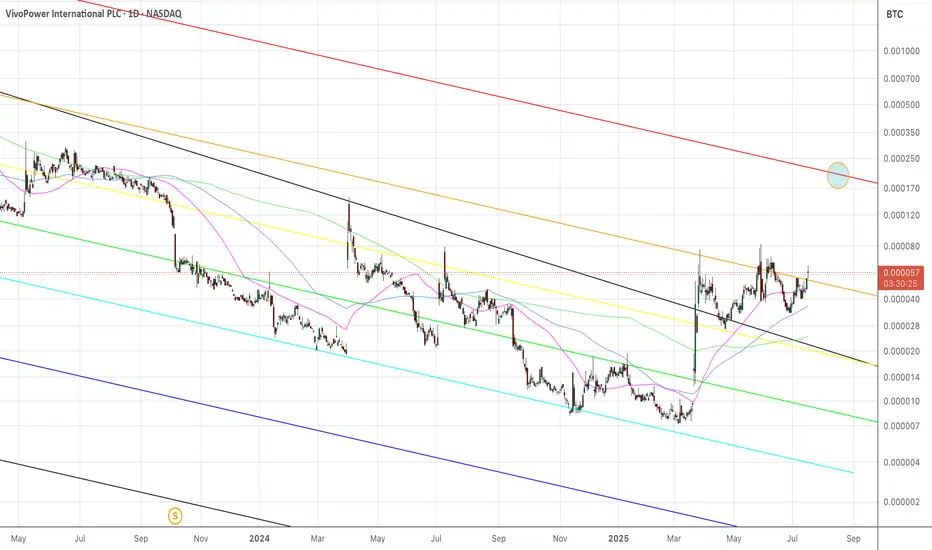
Vivopower in SatoshisAnother view of VivoPower, but denominated in Satoshis. You can see my other chart of VivoPower denominated in Ripple. Everything is looking very bullish for VVPR as it breaks out, and tests the top of the sat fib channel.
Lots of crazy action in extended hours, which is great to see, and volume running 3X trailing average at 9:00am in the morning.
Good luck out there.
LOOKS BULLISHMoving Averages (Simple & Exponential): All signals (from 5‑day to 200‑day) in both SMA & EMA suggest strong BUY .
Trend Oscillators:
MACD: Bullish with positive value ~134 .
ADX/DMI: ADX ~23 indicates weak trend, but DMI+ (32.8) > DMI– (14.8), signalling a bullish bias .
Momentum Oscillators:
RSI (~75), Stochastic K/D (~85/71), and Stochastic RSI K/D (~100/81) all in overbought territory.
CCI (~195), PSAR (~14,150) and Momentum (~4,343) are bullish.
However, True Range (~1,071) and ATR (~647) show heightened volatility—coded as SELL signals Technical Summary (May): ~83% of indicators were BUY signals, with 7% SELL, and 10% NEUTRAL
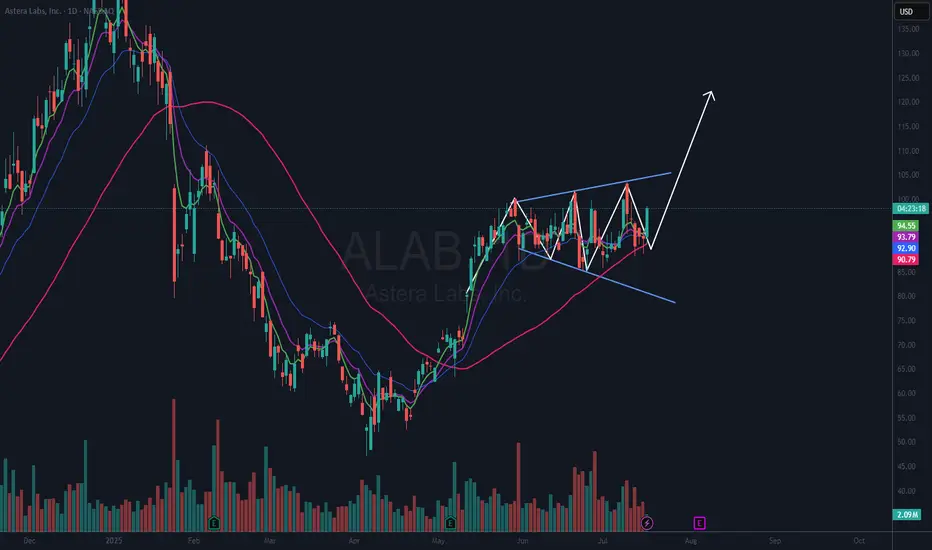
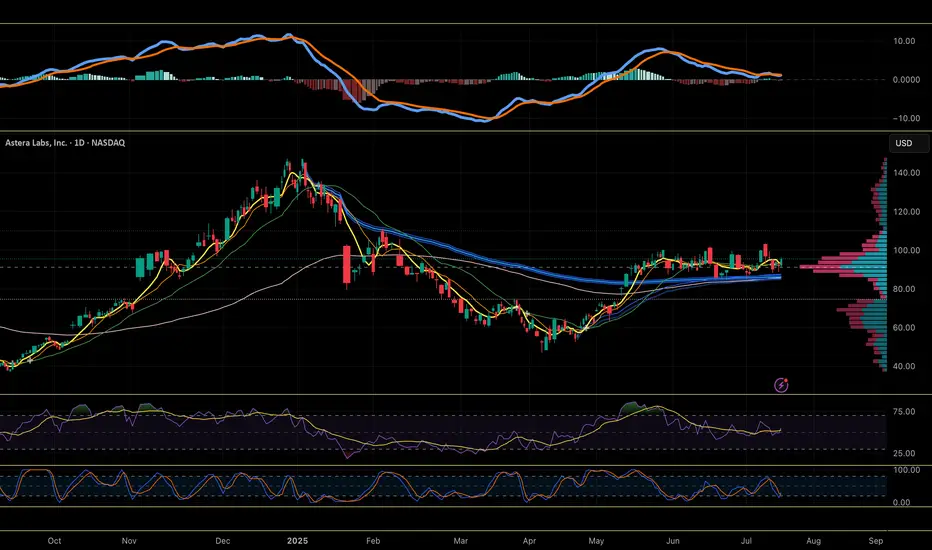
$ALAB Forming a Megaphone PatternNASDAQ:ALAB has seen a lot of volatility as of late. I took a position in it and was stopped out for a loss due to that volatility.
I may be too fixated on this name, but I want to get involved as I think it has a chance to run to previous highs. I thought it had formed a cup with handle pattern, and I got involved on Wed. June 18th only to get stopped on Monday, Jun 23rd. I have been watching it since.
Now it appears it is forming a megaphone pattern. These patterns usually resolve in the direction of the last trend. In this case that trend was up. I like too that the 50 DMA (red) is in an uptrend. I have an alert set on the upper trendline resistance area. Should that trigger, I will look for a good risk reward entry.
If you like this idea, please make it your own and follow your trading plan. Remember, it is your money at risk.
CRWV retest incoming?will we retest 130?
That's my bet. I'm sure that Fri 7/18 will be wild as it is the monthly contract. Staying below 140, I'll hold my runners.
After this bottom, I think we will reverse back upward to 145+

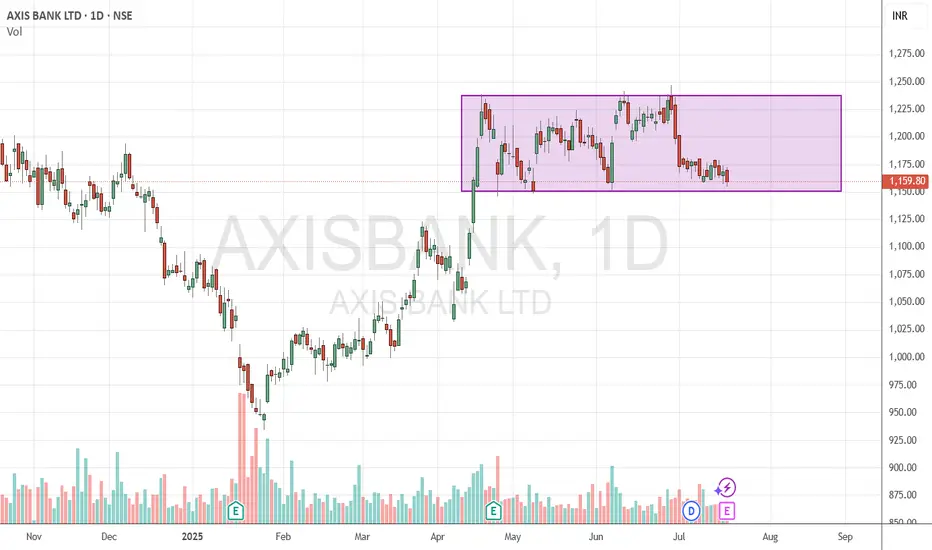
Axis Bank BuyAxis Bank trading in range. Currently it is near the bottom of the range. Buy @CMP (1165) with SL of 1140 (6 points below previous low of the range. Price may make new low before going up) and target of 1200 & 1235.
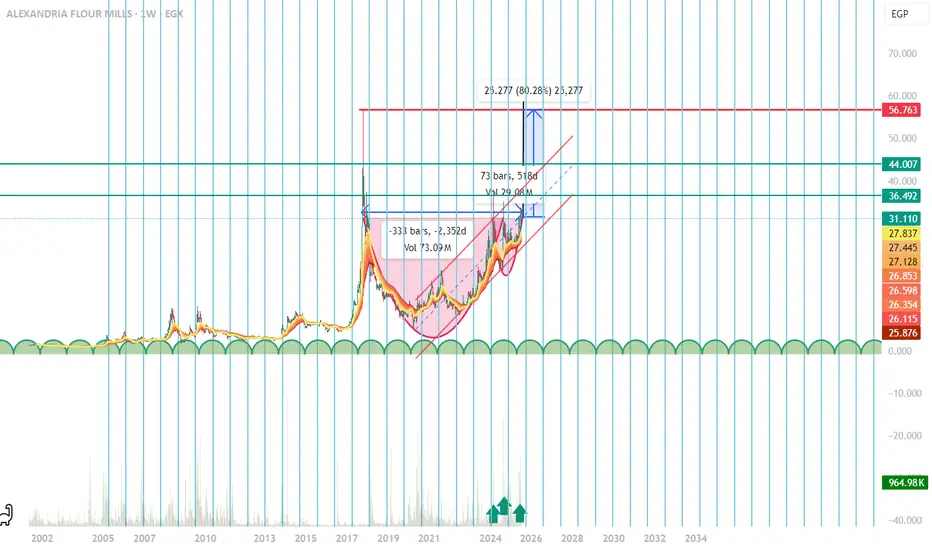
Cup And Handle with big potential Hello Traders,
i believe that is stock in the next year will make huge profits as a medium investor and long one for us as Dailly to week trade we can take advantage from this coming two month as a huge move will happen as it align with the money cycles and the pattern any down move is new opportunity to dca again targets as mentioned its just my opinion not more good luck.entry is from 28 to 33 and take profit one is 36 and the 2nd is 44 and last is 56 with stop loss 25
Gan Fan analysis of InfyGan Fan Line for infy the Gan Fan analysis for the infy has become so much important at this stage to make a long term decision watch the video till end

$ALAB coiled over AVWAP pinchNASDAQ:ALAB has been coiling in a tight range since May, when it vaulted over the AVWAP from the January high. Now above the AVWAP pinch from that Jan high and April low, consolidating above key moving averages, the stock looks ready to launch soon of the volume shelf at ~$90-92
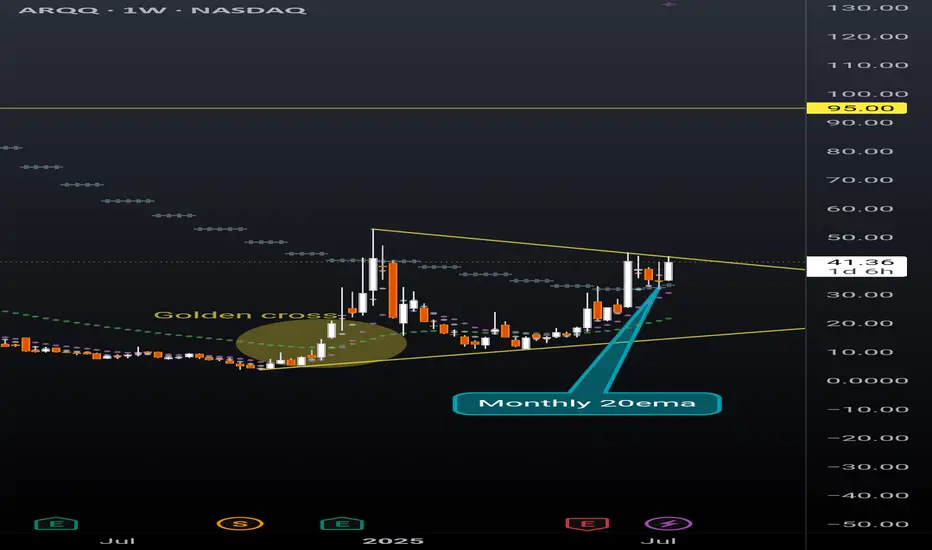
ARQQ weekly pennantBeautiful weekly pennant on ARQQ weekly timeframe. This chart is coiling nicely for a continuation. Still early in the process of reaching breakout but given the recent momentum in this sector a premature break to the upside can happen at any moment.
The ticker is currently sitting above the monthly 20ema (overlayed on this weekly chart), and just had a strong bounce off the daily 20ema (overlayed on this weekly chart). Golden cross is also highlighted that occurred in December 2024 with the daily 50ema retracing back to the daily 200ema and then continuing the uptrend earlier this spring.
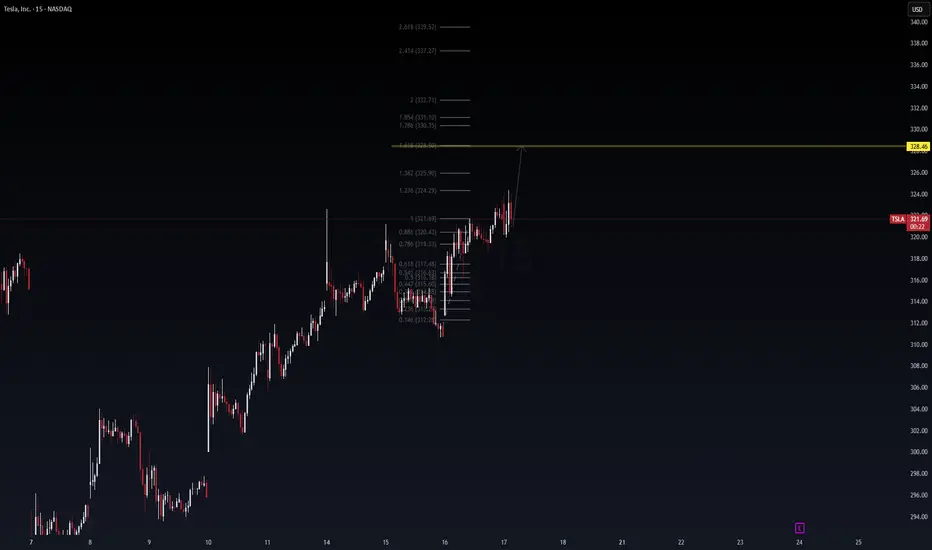
TSLA Fibonacci Launchpad: 328.46 in Sight? (15-min Daytrade Setu🔋 TSLA Fibonacci Launchpad: 328.46 in Sight? (15-min Daytrade Setup)
Posted by WaverVanir_International_LLC | Powered by VolanX Protocol
TSLA continues to show bullish continuation structure on the 15-min timeframe. After a textbook retracement to the golden pocket (0.618–0.786), bulls defended $315-$317 zone and reclaimed $321 resistance.
📌 Technical Thesis
Clean impulsive wave from $312.24 → $321.69
Consolidation → Breakout structure with low selling volume
Fib extension targets 1.618 at $328.46, followed by confluence zones at $331 and $332.71
Price respecting higher lows, forming micro bull flag
📈 Entry Idea:
Intraday breakout confirmation above $324.29 (1.236 extension)
Risk-managed long setup with stops below $320.43 (0.886)
Target zones: $328.46 → $330.35 → $332.71
⚠️ Risk Note:
Heavy resistance expected around $328–$332 zone. Scalp profits near extensions or trail stops tight.
🔮 VolanX Signal Score: 7.5/10
Favoring upside continuation unless macro catalyst shocks sentiment.
#TSLA #DayTrading #Fibonacci #Scalping #VolanX #WaverVanir #TechStocks #OptionsFlow #AITrading #PriceTargets #TeslaTraders
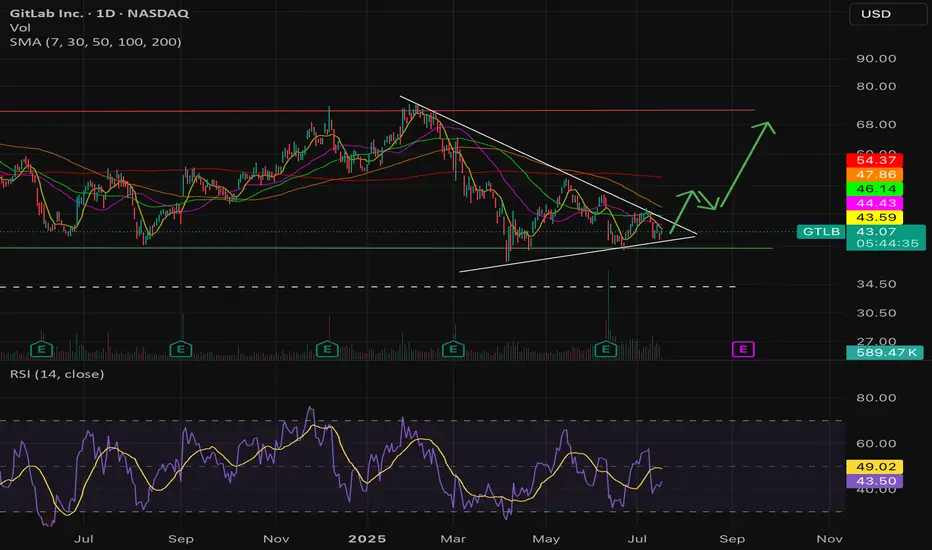
$GTLB undervalued, Potential 2X, AI assisted coding tailwind- NASDAQ:GTLB is likely one of the play for Agentic AI. When other companies like Windsurf, Codium, Cursor are in a goldrush. NASDAQ:GTLB is selling shovels.
- AI assisted coding is now a theme and is happening at a fast pace. I'm certain NASDAQ:GTLB will be a beneficiary of this trend.
- NASDAQ:GTLB has launched various AI based features on its platform which will get adoption and it will be easier for the company to upsell these features.
- P/S for NASDAQ:GTLB is depressed. If they even execute on their fiscal goals, re-rating should lift the stock up.
- NASDAQ:GTLB should be a 2X in less than 3 years in my opinion given secular shift and macro as a tailwind.
Fair value for NASDAQ:GTLB as of now is $68-72
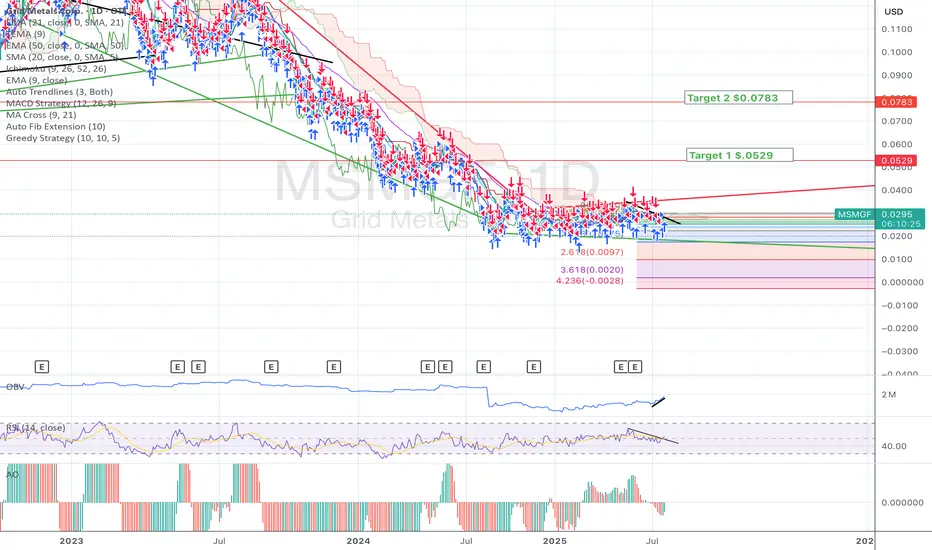
MicroCap Rare Earth Play in CanadaToo much to say about this other than more cash than market cap, Offtake Agreements and Collaboration with Teck Resources and Tanco Mine with Rising Metal Prices including huge reserves of Cesium, Lithium, PGM, Nickel, Copper... everything needed for electrification and AI transition in North America. Will be acquired in the next 12 Months IMO.
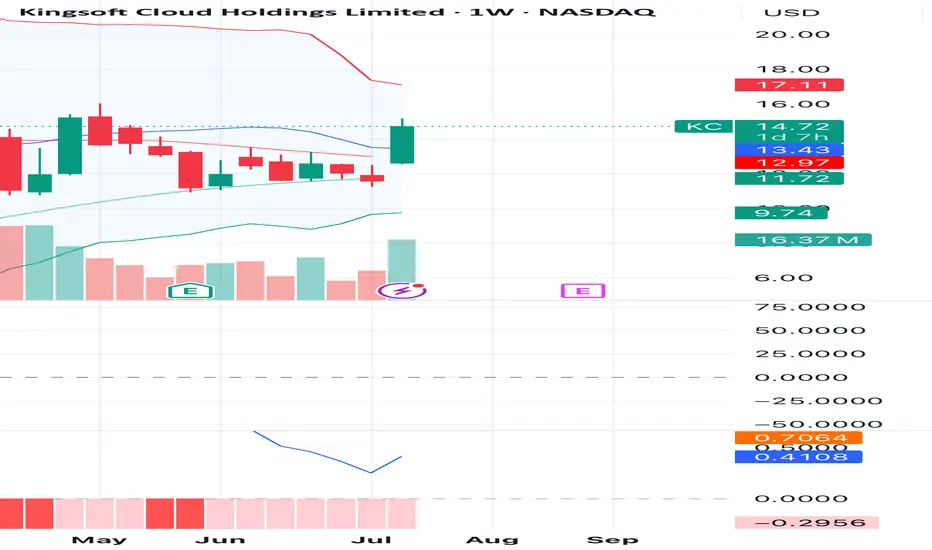
KC weekly breakout - bullish reversal in motion KC (Kingsoft Cloud Holdings) is showing a strong bullish reversal pattern on the weekly chart, breaking above the 20-week moving average for the first time in months with notable volume surge (16.13M). The breakout candle closed near the high of the week with a wide body, suggesting strength behind the move.
The MACD is beginning to curl upward from the oversold region, which could indicate a potential trend reversal forming.
🔹 Entry: $14.67
🔹 Target 1: $17.10 (previous resistance / upper Bollinger Band)
🔹 Target 2: $19.50 (gap-fill potential zone)
🔹 Stop Loss: $12.97 (below breakout candle low)
📌 Watch for follow-through next week. If KC maintains volume and holds above $13.50, the bullish setup remains valid.
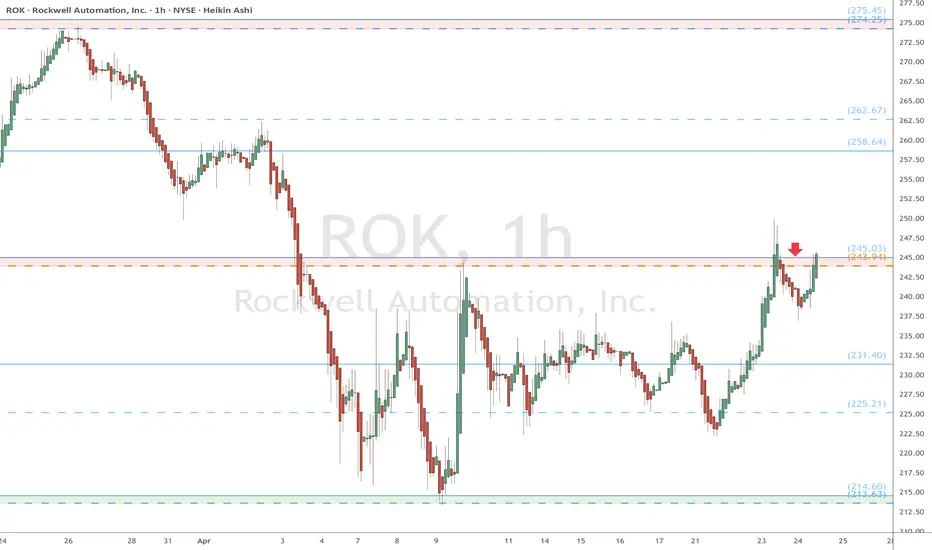
ROK eyes on $245: Key Resistance break may Mark bottomROK trying to recover along with the general market.
Now testing a well proven resistance at $243.94-245.03
Look for a Break-and-Retest for possible long term entry.
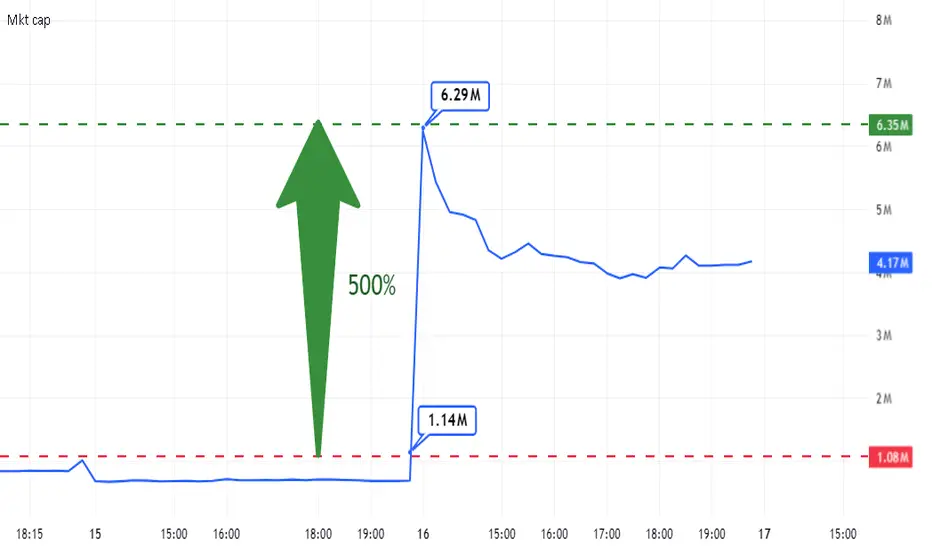
PATENT PRICINGThe nearly $5 million increase in Nuwellis stock market value following the company's patent acceptance makes the estimate of an average price of $5 million per medical product patent in small companies more credible.
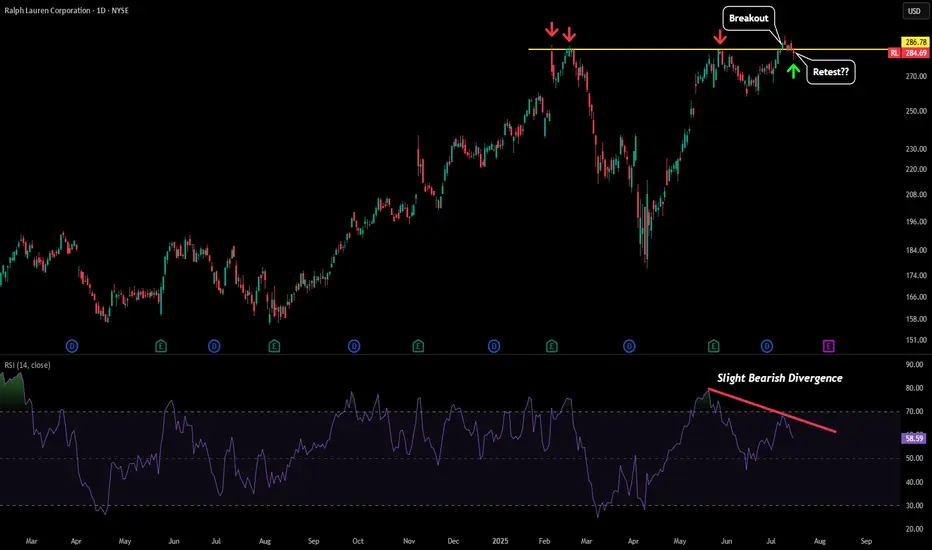
RL - One to WatchRalph Lauren is trying to breakout above the highs. So far we have seen a breach of the key $286-287 level and currently price is in the process of retesting that level as potential new support.
Its to early to say right now as this could end up being a failed breakout as the RSI has a slight bearish divergence.
But if we see price start to rise back above that level and have a successful retest then we should see a rapid increase above $300 (given other catalysts as well).
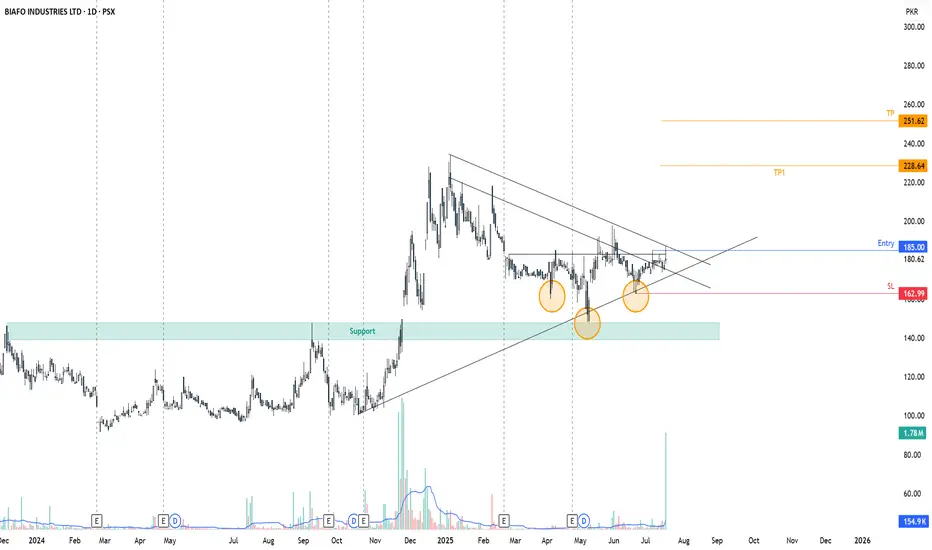
Are you seeing BIFO next Upper cap?BIFO has already shown bullish divergence and formed an Inverted Head and shoulder pattern. On the breakout of Resistance, it can make a fine move.
Are you seeing it next Upper cap?
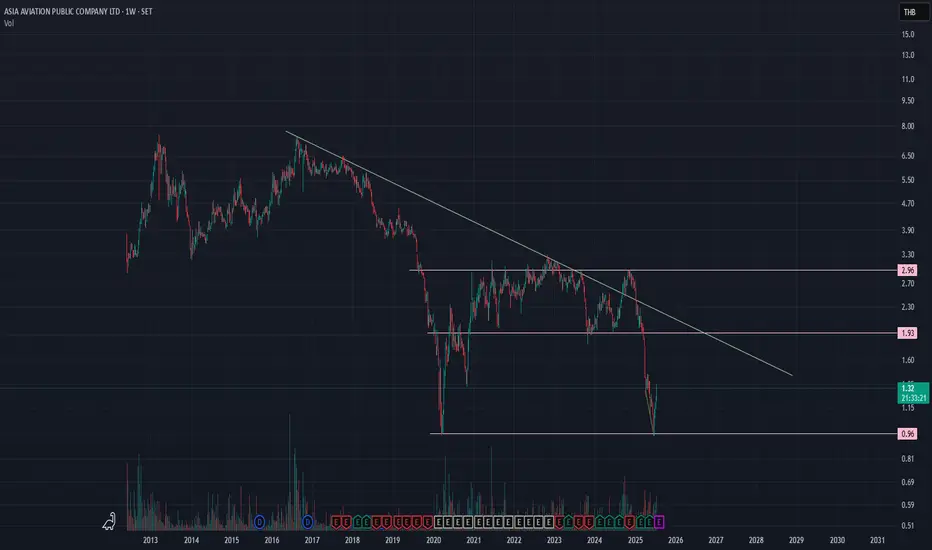
AirAsia. Most popular domestic airline of Thailand.AirAsia has become most popular domestic airline in Thailand. They now hiring more and more mechanic and investing more airplane on their fleet.
The chart showed false break-out once because SET pull it down the whole market which normal.
Buy now not the Q4. Even how bad Thai economy been but we cant denied that tourists love to visit Thailand on the New Year. Our rating might under performance but we airliner will make more profits on the end of the year. Transit flight included.
Hopefully price can stand above 3 THB and up to 7 THB.
Mid term investment.
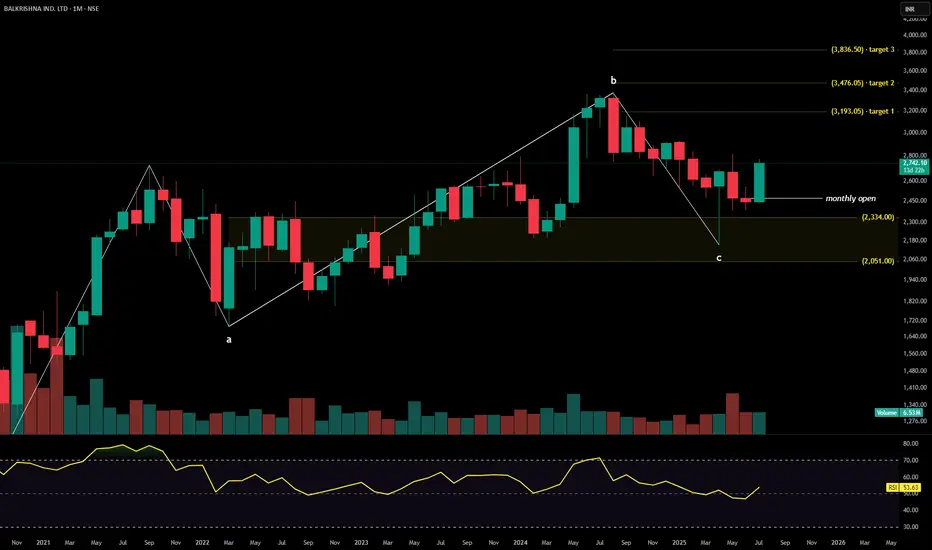
BALKRISHNA INDUSTRIESBalkrishna Industries Ltd. is a global manufacturer of off-highway tires, serving sectors such as agriculture, construction, mining, industrial, and forestry. With a premium export-led product mix and deep global penetration, the company continues to scale operations through automation, brand partnerships, and diversified geographic strategies. The stock is currently trading at ₹2,742.10.
Balkrishna Industries Ltd. – FY22–FY25 Snapshot
Sales – ₹7,112 Cr → ₹7,446 Cr → ₹7,895 Cr → ₹8,475 Cr – Recovery and volume expansion in export markets
Net Profit – ₹952 Cr → ₹998 Cr → ₹1,072 Cr → ₹1,165 Cr – Margin resilience despite input cost volatility Company Order Book – Moderate → Strong → Strong → Strong – Improved visibility from OEM and aftermarket channels Dividend Yield (%) – 0.88% → 0.91% → 0.95% → 1.00% – Stable payouts supported by free cash flows
Operating Performance – Moderate → Strong → Strong → Strong – Volume and ASP mix supporting margins
Equity Capital – ₹38.66 Cr (constant) – Efficient capital structure
Total Debt – ₹260 Cr → ₹245 Cr → ₹229 Cr → ₹210 Cr – Conservative leverage, improving coverage
Total Liabilities – ₹2,460 Cr → ₹2,530 Cr → ₹2,595 Cr → ₹2,660 Cr – Stable expansion with operating scale
Fixed Assets – ₹1,470 Cr → ₹1,525 Cr → ₹1,580 Cr → ₹1,635 Cr – Strategic capex on automation and green initiatives
Latest Highlights FY25 net profit rose 8.7% YoY to ₹1,165 Cr; revenue increased 7.3% to ₹8,475 Cr EPS: ₹60.13 | EBITDA Margin: 25.4% | Net Margin: 13.74% Return on Equity: 19.42% | Return on Assets: 11.95% Promoter holding: 58.30% | Dividend Yield: 1.00% Growth in U.S. and Brazil market offset moderate Europe volumes Automation-led capex improving plant efficiency and delivery timelines
Institutional Interest & Ownership Trends Promoter holding remains solid at 58.30% with no pledging or dilution. FIIs have maintained positions with marginal increases, while DIIs have held steady. Recent delivery volume trends indicate quiet accumulation among institutions focused on export-driven and specialty manufacturing narratives.
Business Growth Verdict Yes, Balkrishna Industries continues to build scale and resilience Margins remain firm across markets despite volatility Debt and liability management reflect financial discipline Capex strategies align with operational efficiency and environmental goals
Company Guidance Management expects continued expansion in export markets and steady profitability, with emphasis on improving automation and sustainability across manufacturing processes.
Final Investment Verdict Balkrishna Industries Ltd. stands out as a consistent performer in India’s specialty manufacturing space. Its global footprint, strong cash flows, efficient capital deployment, and resilience across market cycles position the company well for long-term value creation. Continued operational leverage and conservative financial practices make it suitable for accumulation by investors seeking industrial exposure with stable returns.
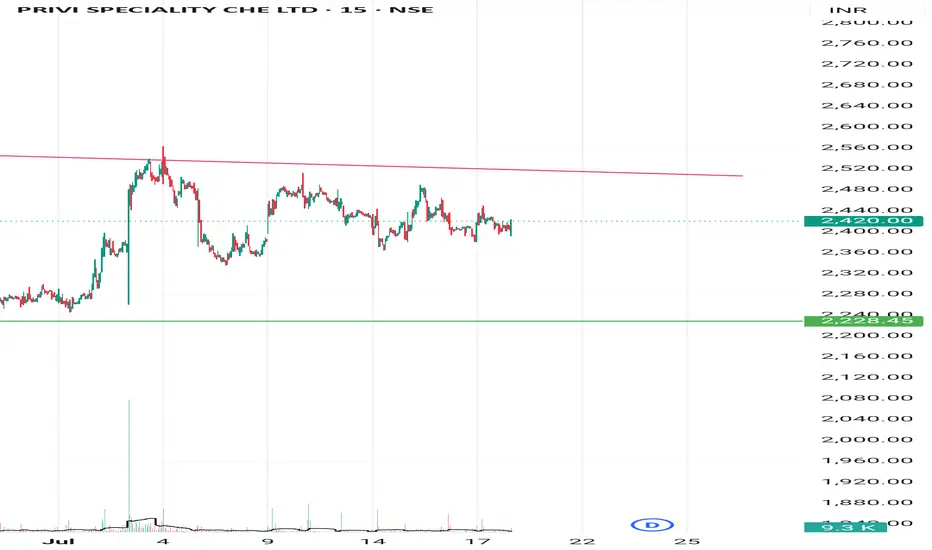
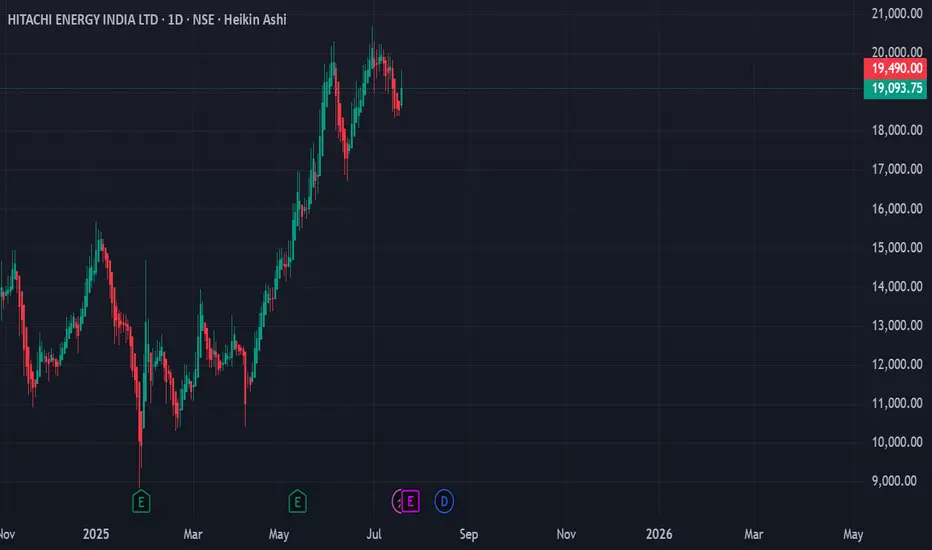
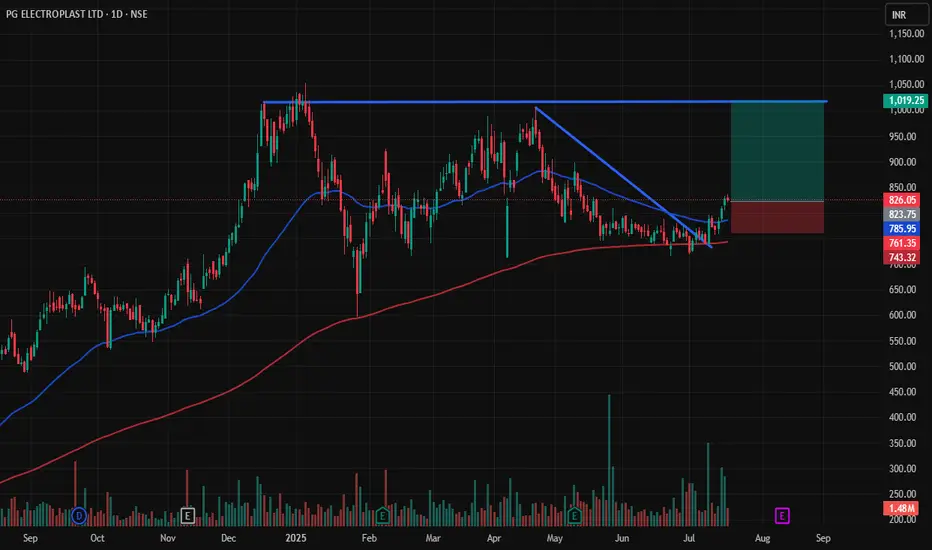
Good bullish signOn weekly tf, previous ath broken and trying to sustain. And if it breaks 15 mins tf with better volume, it may go up. This is only for educational purposes. Do your own analysis and do trade