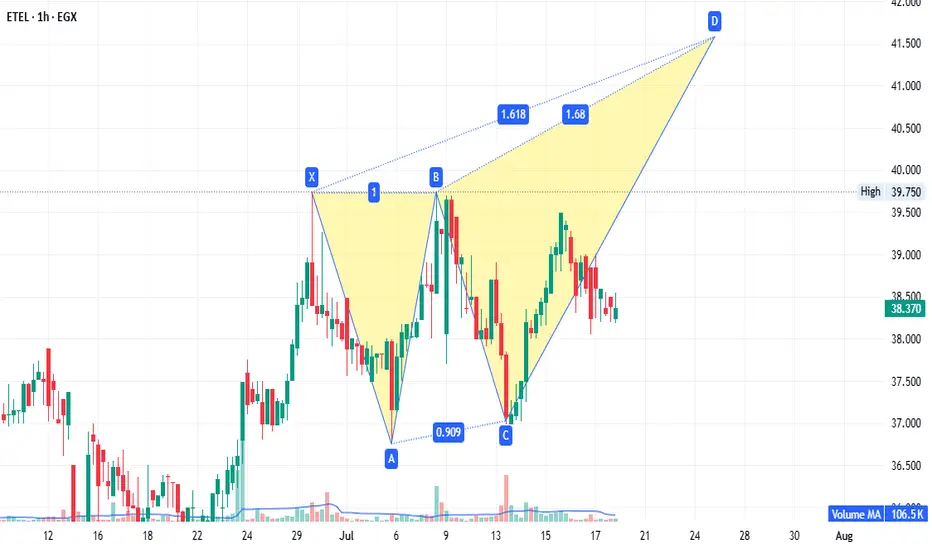
ETEL - strong fundamentals.EGX:ETEL 1-hour timeframe:
A potential bearish Gartley pattern targets 41.50. If prices reach 41.55 (without breaking 37.00), it becomes a sell point with targets at 39.73 and 38.60. Conversely, if prices continue rising and close above 42.70, rebuy what was sold at 41.50, targeting 52.00. This setup is both strategic and supported by strong fundamentals.
Disclaimer: This is not financial advice, only our analysis based on chart data. Consult your account manager before investing.
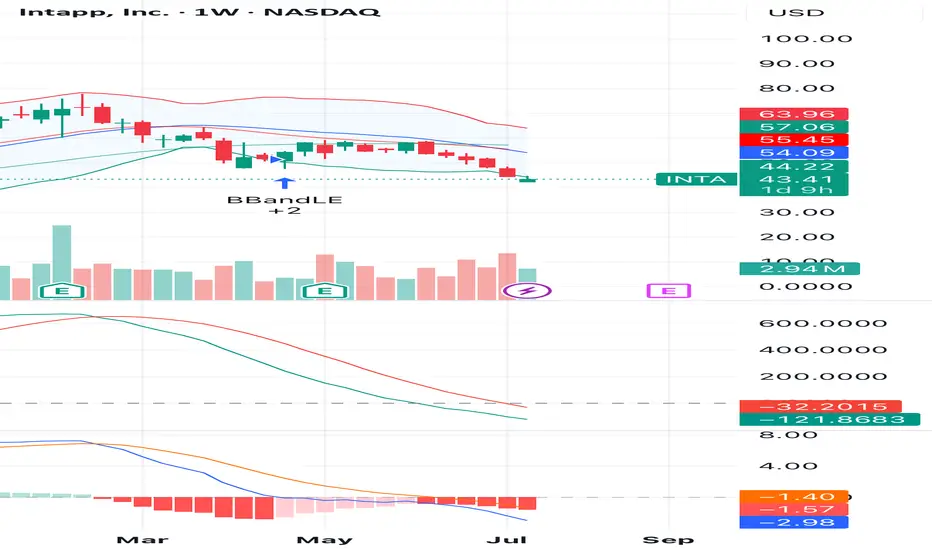
Potential Reversal for INTA – Weekly SetupINTA is showing signs of a potential reversal after a consistent downtrend. On the weekly chart, the price touched the lower Bollinger Band with increased buying volume and a bullish candle forming. This may signal the end of the selling pressure.
Momentum indicators such as MACD and KST are flattening, suggesting a possible shift in momentum. A break above $44.22 could confirm a short-term bounce.
📈 Entry Zone: $43.00 – $44.50
🎯 Target 1: $54.00
🎯 Target 2: $57.00
🛑 Stop Loss: Below $41.00
This idea is based on technical signals; monitor volume and market conditions closely.
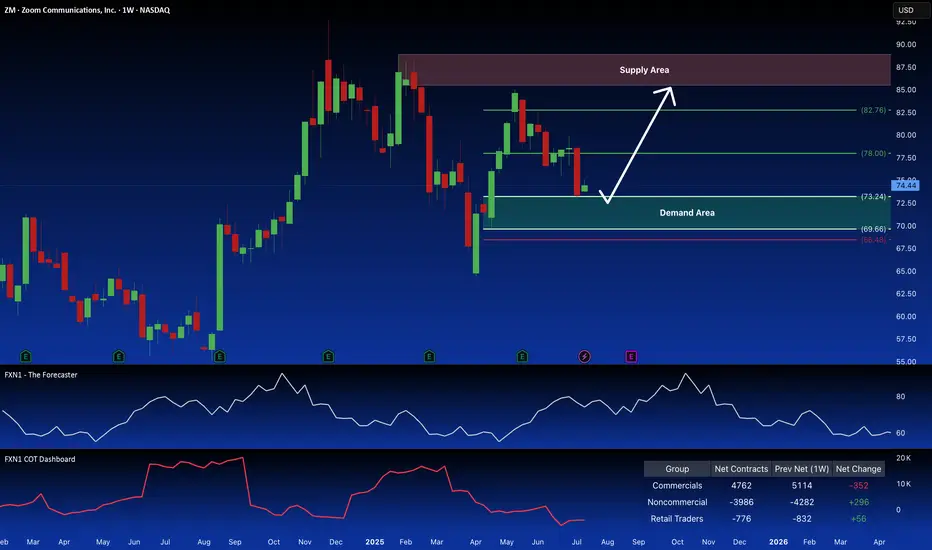
Zoom (ZM): Potential Long Setup at Demand ZoneZoom Video Communications (ZM) recently experienced a rejection at a key demand zone on its weekly chart. Non-commercial traders have increased their long positions, and forecasts suggest a potential upward trend. I'm considering a long trade setup based on a retest of that demand zone. What are your thoughts?
✅ Please share your thoughts about ZOOM in the comments section below and HIT LIKE if you appreciate my analysis. Don't forget to FOLLOW ME; you will help us a lot with this small contribution.
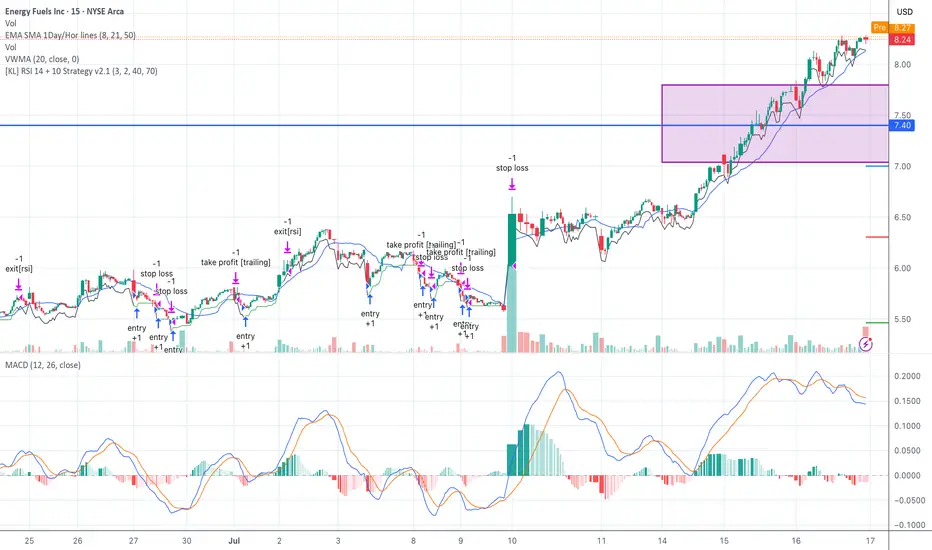
UUUU: Clean Breakout from Base — Seed System Scalped & StackedUUUU just broke out of a strong 5-day consolidation between $7.40 and $7.90. The Seed System fired multiple entries, trailed out of chop, and caught the breakout cleanly.
Volume expansion, VWMA support, and MACD alignment confirm trend strength. Currently riding above the 8 EMA.
Partial profits locked. Watching for continuation or reversal signals.
This is a textbook example of what Seed System is built for — stacked wins, managed risk, no FOMO.
#UUUU #SeedSystem #Breakout #SwingTrading #TrendFollowing #MACD #Volume #Uranium
The Crypto Market Shaken by USDe Collapse – What’s Next for BtcIn early July 2025, the crypto market was rocked by the sudden destabilization of one of the fastest-growing stablecoins — USDe by Ethena. In just a few days, the token lost over 10% of its value, dropping to $0.88. This triggered a wave of liquidations across DeFi protocols and a sharp decline in major crypto assets like Bitcoin and Ethereum.
Why USDe Collapsed
The main cause of the collapse was a weak collateral model. Unlike USDT and USDC, USDe lacked full fiat backing. Its reserves were partially based on derivatives and complex hedging strategies. When a few large wallets began withdrawing liquidity, panic spread quickly. The rush to exit USDe overwhelmed the system, breaking the $1 peg.
This led to an accelerated loss of trust and triggered cascading liquidations across multiple DeFi platforms.
Impact on DeFi and the Broader Market
DeFi was hit hard. The total value locked (TVL) across major protocols like Aave, Curve, and MakerDAO dropped by 17% in one week. Some platforms halted USDe-related activity to contain losses.
Bitcoin fell below $58,000, and Ethereum dropped under $3,000, driven not only by lower liquidity but also by renewed skepticism from institutional investors. The volatility in what was perceived as a “safe” asset reignited debates around the future of algorithmic stablecoins.
What Happens Next?
The fallout from USDe is a major stress test for the entire DeFi ecosystem. If the team behind Ethena fails to restore trust, other algorithmic stablecoins could come under pressure. There are already growing calls for greater transparency, independent audits, and stricter collateralization rules.
On the flip side, many see this as a healthy correction — a purge of undercollateralized, risky experiments. The long-term winners could be robust, transparent protocols, and Bitcoin, with its capped supply and increasing institutional demand, may once again be seen as a flight-to-safety asset.
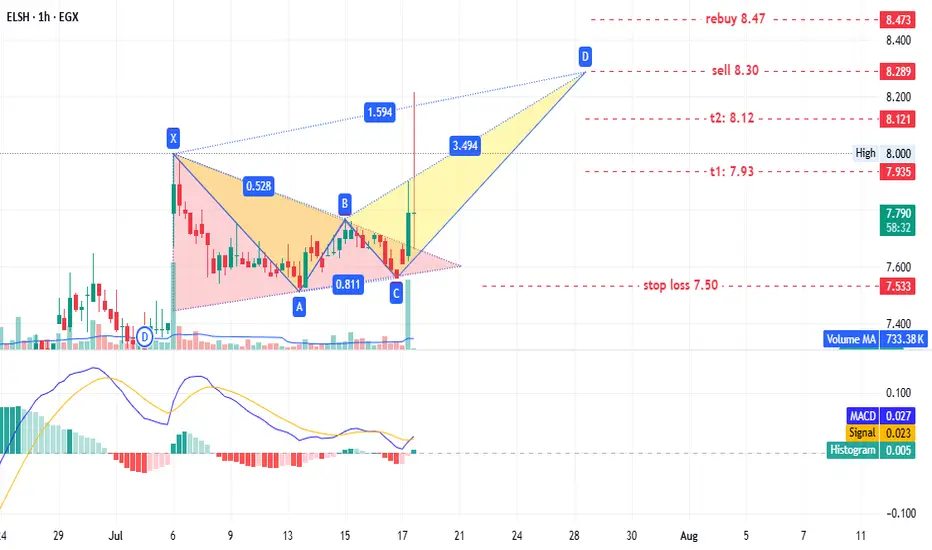
ELSH - old player EGX:ELSH timeframe: 1 hour.
A triangle pattern was identified, targeting 8.20. No new entry is recommended for shareholders, but if prices retest the triangle pattern at 7.65–7.60, it could present a low-risk entry opportunity.
This may also form a potential bearish Gartley pattern with targets:
- T1: 7.93
- T2: 8.12
- T3: 8.30 (sell point)
Stop loss: 7.50.
If prices continue rising and close above 8.47, consider rebuying what was sold at 8.30.
Disclaimer: This is not financial advice, only our analysis based on chart data. Consult your account manager before investing.
Good luck!
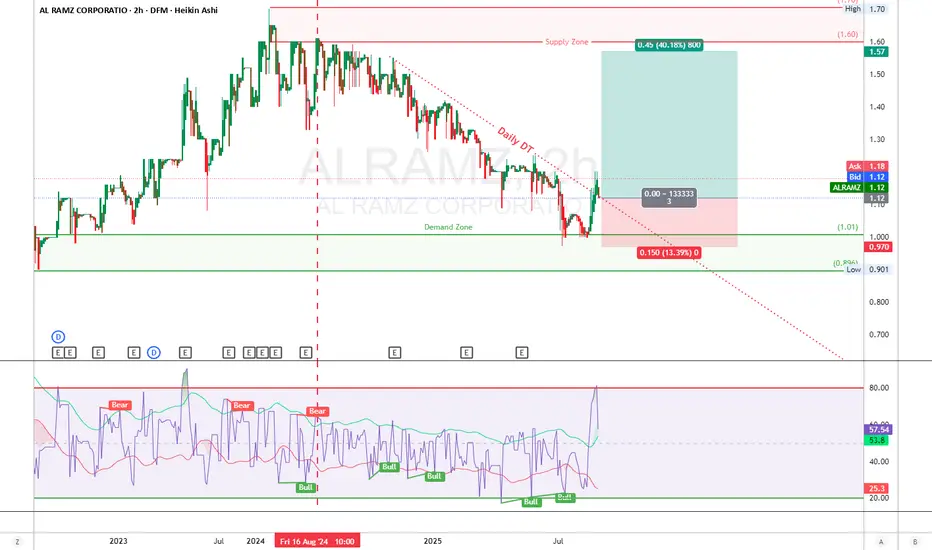
AL RAMZ CORPORATION -DFM-LongAL RAMZ CORPORATION (2H chart)
ALRAMZ just threw down a textbook bounce off the demand zone, broke the daily downtrend line, and momentum's lit. That 1.57 level? That’s the kill zone. Could be Wave A or 1 — either way, bulls are cookin'.
Looks like we’ve completed a **corrective structure** post-Wave 5 top near 1.70.
The impulsive drop into the **Demand Zone (0.97–1.01)** has been met with strong buying — potential by breaking the daily trendline and start of a new motive wave or large corrective rally.
* **Demand Zone:** 0.97–1.01 (key support that triggered this bounce)
* **Supply Zone (Target):** 1.57–1.60 (prior consolidation & resistance)
RSI Recently triggered a **Bullish Divergence**
RSI has spiked above 80, suggesting **strong bullish momentum**
🧠 **Trade Setup**
* **Entry:** 1.12 (post-breakout retest)
* **Stop Loss:** 0.97 (below Last Low)
* **Take Profit:** 1.57 (major supply resistance zone)
**Risk/Reward:**
* **R/R = 3:1**
"In trading, it's not about prediction, it's about preparation." – Mark Douglas
### ⚠️ **Disclaimer:**
This analysis is for educational purposes only and not financial advice. Trading involves risk, so manage position size accordingly and always use stops.
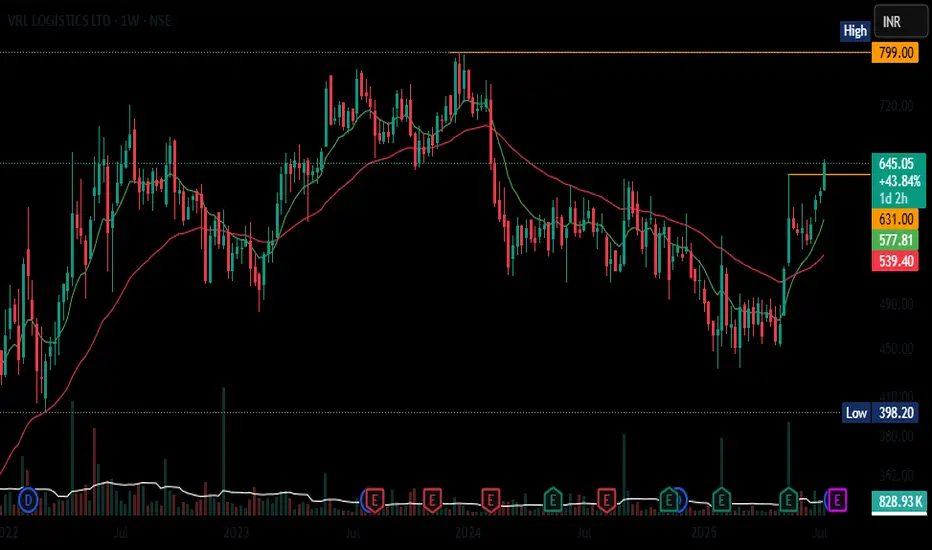
VRL LogisticsVRL Logistics has broken out of a year-long base above ₹610 with strong volume and bullish momentum. Price is above key moving averages, signaling a fresh uptrend
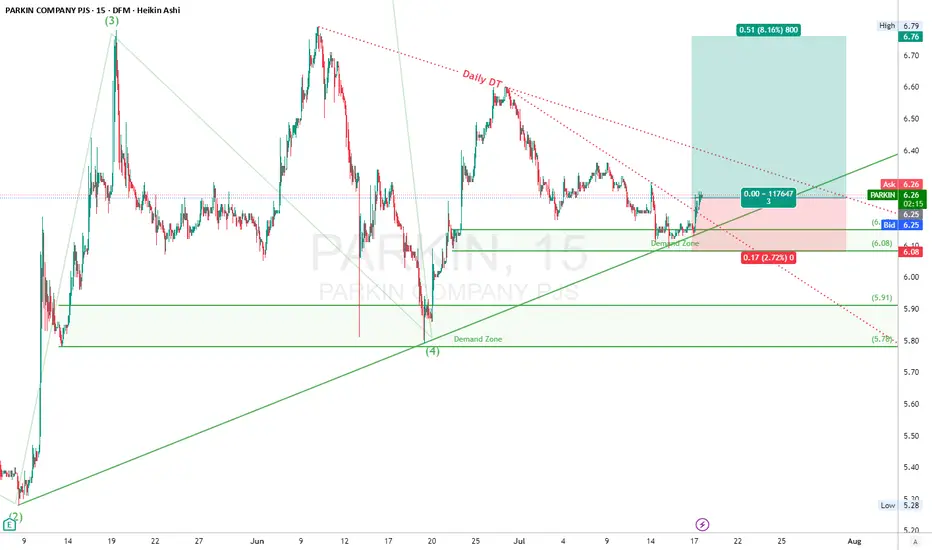
PARKIN-DFM (long setup)PARKIN had Impulsive breakout, confirmed by price piercing the descending Daily trendline (Daily DT)
Double confirmation from the demand zone bounce and RSI bulls waking up. Trendline’s toast. If Wave 5 is truly kicking off, that 6.76 zone’s gonna be the magnet. Let it rip.
Demand Zone :** 6.08–6.15 (held strong multiple times)
Supply Zone:** 6.71–6.79
RSI signaling strong momentum with bullish divergence supports upside continuation
🎯 **Trade Plan**
* **Entry:** 6.26 (confirmation candle post-breakout)
* **Stop Loss:** 6.08 (below demand zone structure)
* **Target 1:** 6.76 (supply zone near prior highs)
**Risk/Reward:**
* **R/R = 3:1**
"It’s not about being right or wrong. It’s about how much you make when you’re right and how much you lose when you’re wrong." – George Soros
### ⚠️ **Disclaimer:**
This analysis is for educational purposes only. Trading involves risk, and past performance is not indicative of future results. Always do your own due diligence.
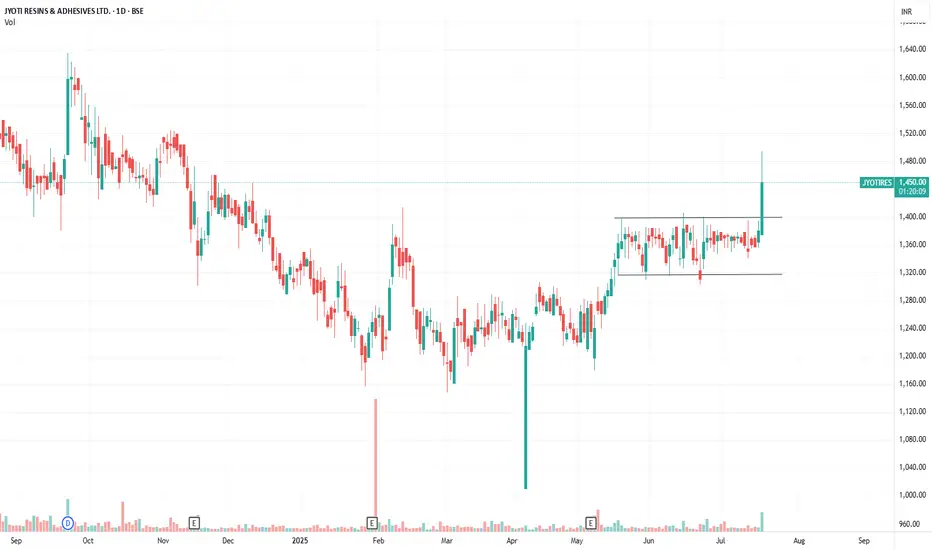
Watch out for the box breakout in Jyoti ResinWatch out for the box breakout in Jyoti Resin. Crude price is in control. As the consumption demand improves, this stock will run up. For this it will take 4-6 months. But one has to enter in lower levels to capture full move.
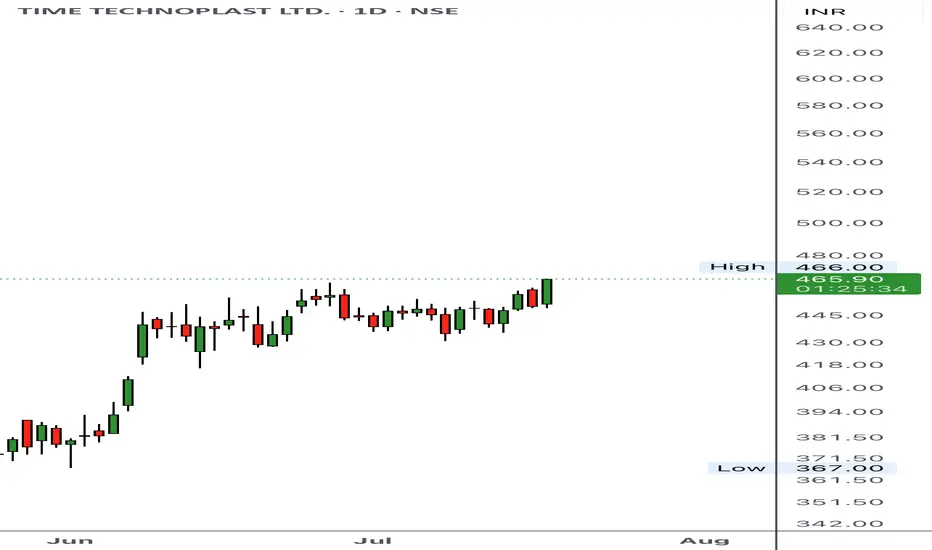
Time techno⏱️ Time Technoplast – Building Strength!
Clean technical setup, solid volume, and eyes on higher zones.
Positional traders, stay tuned ! 📈🚀
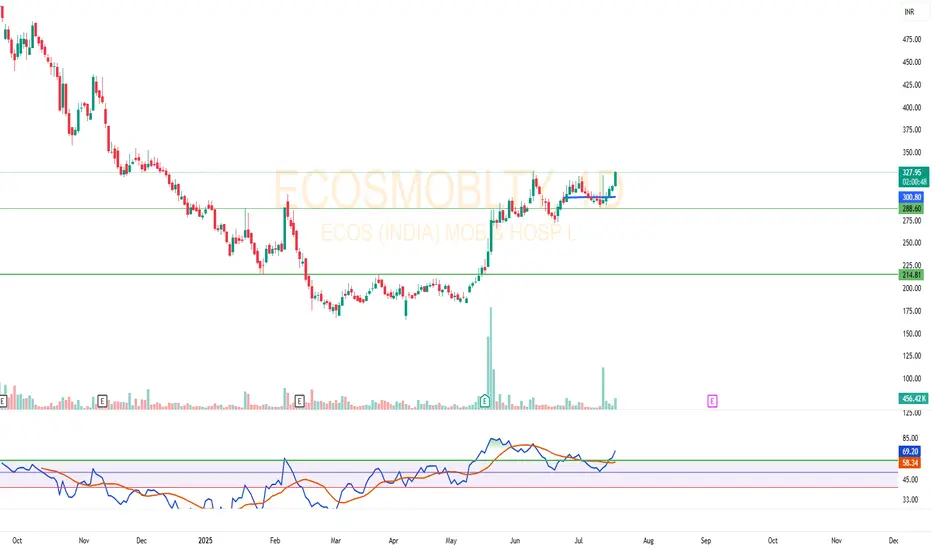
ECOSMOBLTY Breakout Attempt | Volume + RSI Analysis📈 Stock: ECOS (India) Mobility & Hospitality Ltd
🔹 Price broke out of strong ₹300 resistance zone with volume support.
🔹 Current market price: ₹327.50
🔹 RSI also moving above 58 – showing bullish momentum.
💡 Observation:
- ₹300–₹305 was a key resistance zone.
- Breakout with bullish candle and volume.
- Next possible zone to watch: ₹350+
🚫 Not a buy/sell call. This is for educational purposes only.
⚠️ I am not SEBI registered. Do your own analysis before making any investment.
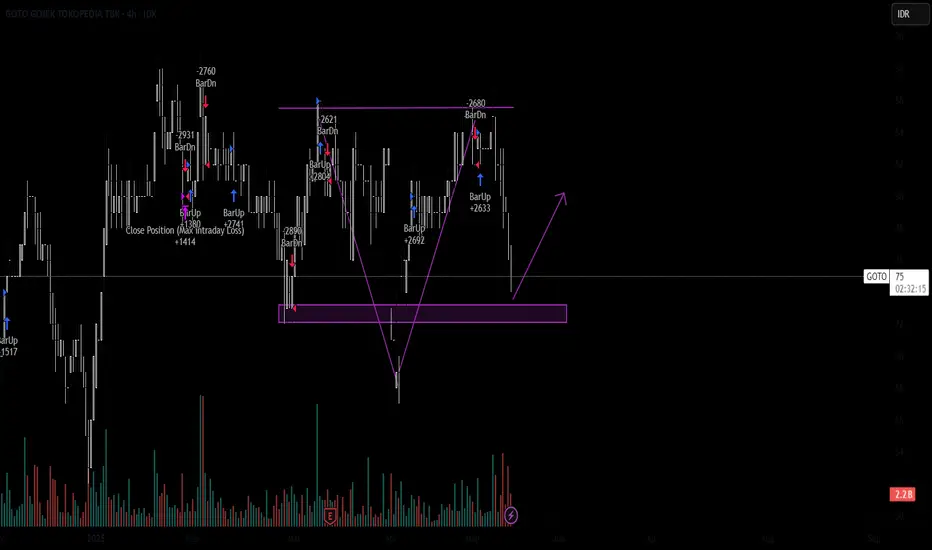
GOTO With news speculating around a possible merger between GOTO and GRAB, there might be some good news for the stocks as well. We’ve got an Inverted Head and Shoulders pattern forming here, and we might expect a bounce back as we re-enter the testing zone. But we need to be cautious at the support level if it breaks down, the reversal fails.
#FREEBANDZ #NOTAFINANCIALADVICE
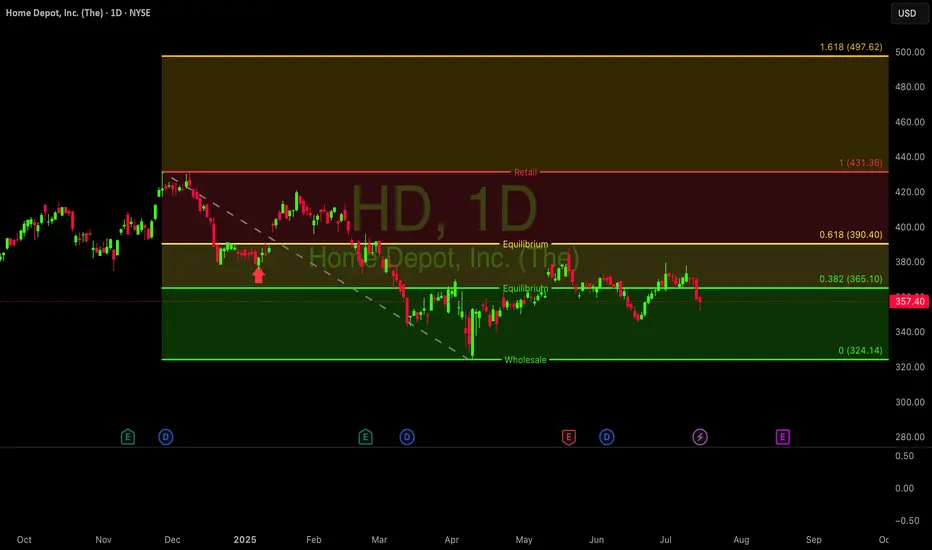
$HD - One of my bestfriend favorites <3NYSE:HD looking strong here, testing the 200-week EMA as a key support level. A classic spot for a long-term bounce. If it holds, could be building a base for a run back to the $426 highs. #HomeDepot #TechnicalAnalysis #Trading #Investing
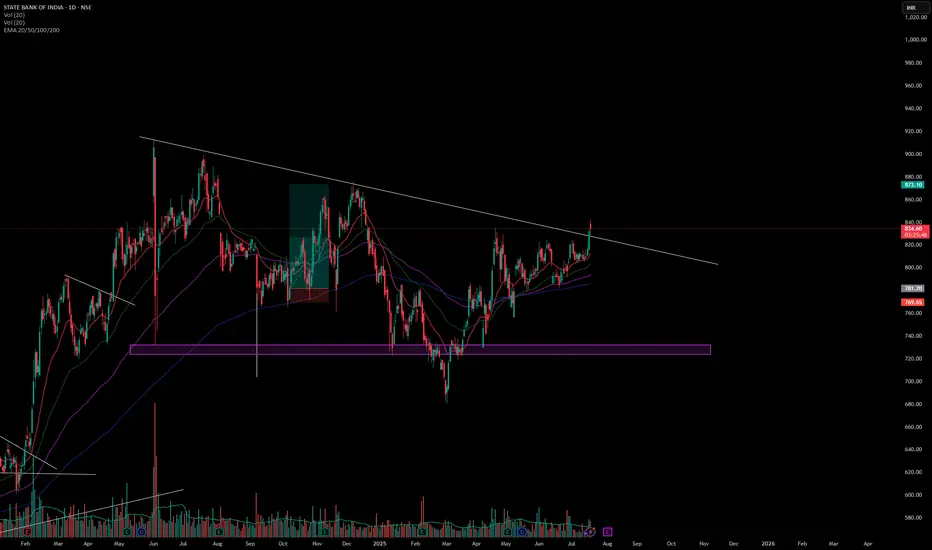
SBIN (Swing Trade) LONGThis stock has broken out of a trend line and looking good for a good upper move. Current CMP is 835, book your profit on 900 , SL will at last swing(805) .
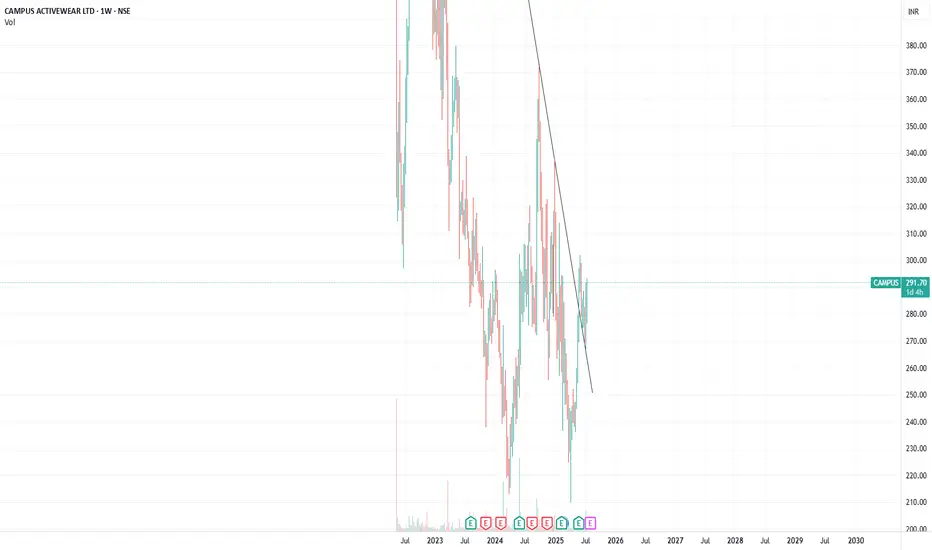
Breakout to keep in watch list. Breakout Campus activewear . Currently, comsuption is weak but might revive from Q3(because of Diwali). So this stock might take time to recover. Can take small position at this point of time
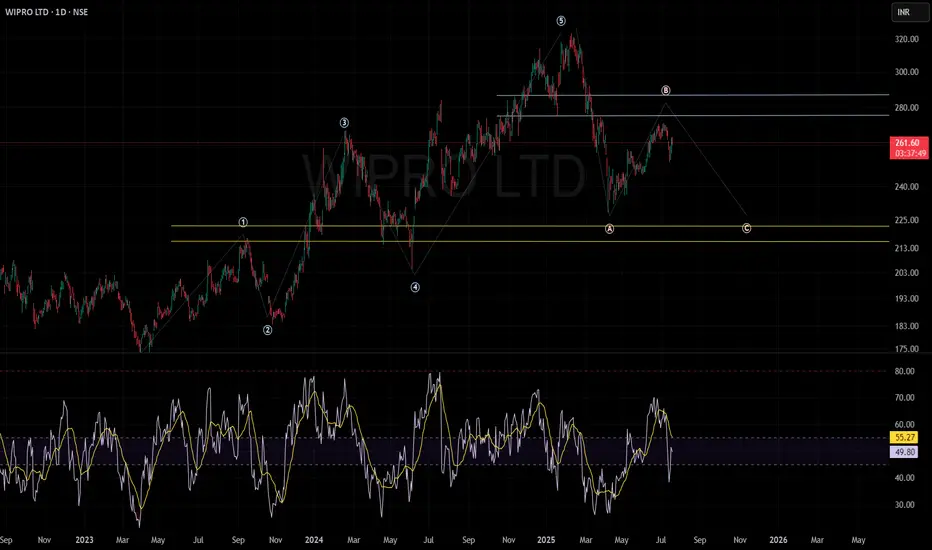
WIPRO CAN STILL FACE SOME PRESSUREWIPRO LTD.
Wave Structure:
The chart depicts a well-defined Elliott Wave pattern, illustrating a completed five-wave impulse sequence succeeded by a classic ABC corrective phase.
Wave B retracement appears to be underway, with resistance anticipated around the ₹275–₹285 zone.
Support & Resistance:
Key resistance levels are established at ₹275–₹285, which historically coincided with selling pressure and reversal zones.
Major support zones are highlighted between ₹210–₹225, a region with repeated buying interest and robust price recovery in the past.
Technical Outlook:
The current price structure suggests continued corrective bias, with a probable move towards the lower support band (₹210–₹225), barring any decisive reversal above the key resistance.
Unless momentum breaks out above ₹285 with conviction, the base scenario remains cautious to bearish.
My analysis is anchored in classical price action and Elliott Wave theory to identify potential market inflection points.
Sentiment:
The prevailing market sentiment remains neutral to negative as the price fails to breach significant resistance and is trading below the Wave B peak.
A shift in momentum can only be confirmed if there is sustained price action above resistance with increased volume.
Disclaimer:
This analysis is strictly for educational and informational purposes, not intended as trading or investment advice.
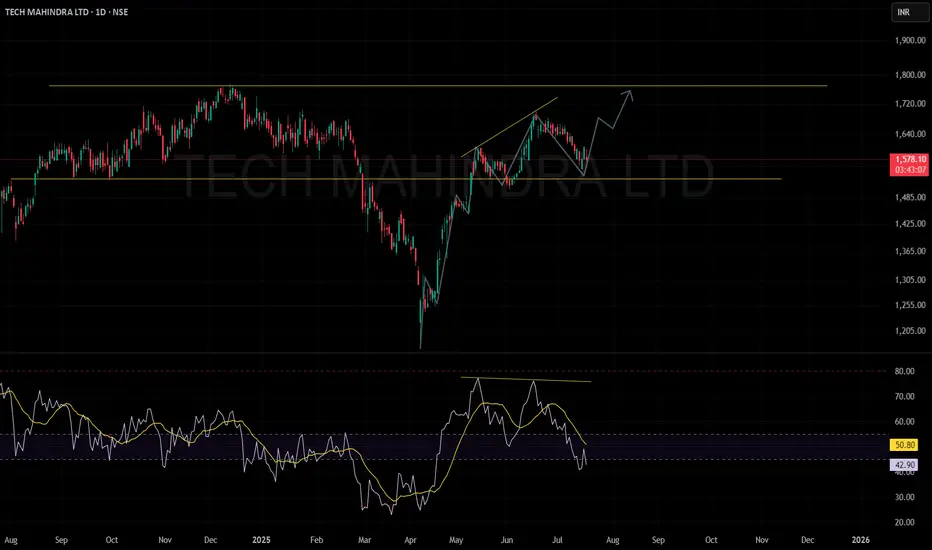
TECH MAHINDRA POISED FOR AN UPMOVE#TECHMAHINDRA
Support and Resistance:
A support zone is identified near ₹1,500 (lower yellow horizontal line).
The resistance zone is marked around ₹1,800 (indicated by the upper yellow horizontal line).
Trend Analysis:
Following a significant decline, the stock has shown a sharp recovery and is now consolidating.
A possible bullish scenario is depicted, anticipating a move towards the resistance zone, subject to price confirmation.
RSI (Relative Strength Index):
Currently, RSI is around 43.56, suggesting mild bearishness.
The RSI previously formed a bearish divergence (lower highs on RSI while price made higher highs), and has since declined.
The yellow moving average line on RSI indicates the momentum trend is still down.
Chart Pattern:
The recent pattern suggests that the stock has pulled back after a failed attempt to break higher, possibly setting up for another upward move.
Summary: Tech Mahindra is at an important technical juncture, consolidating after a recent decline. If it holds above support and momentum improves, a move towards ₹1,800 is possible; however, the current RSI weakness suggests caution until clear strength emerges.
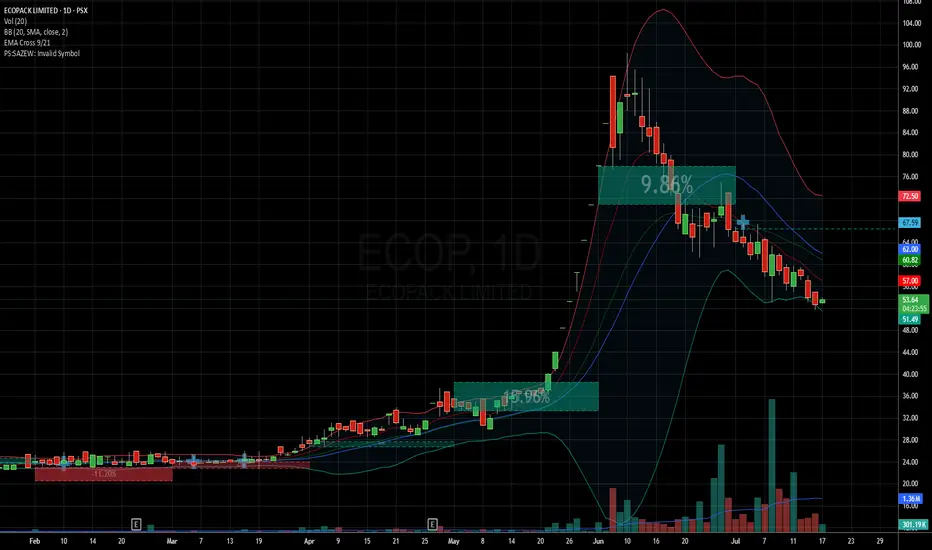
ECOP - SHORT TERM TRADE The Stock is to be kept in the active watch list. Long position recommended when stock starts making an upside move. This has a good probability of reasonable short term profits.
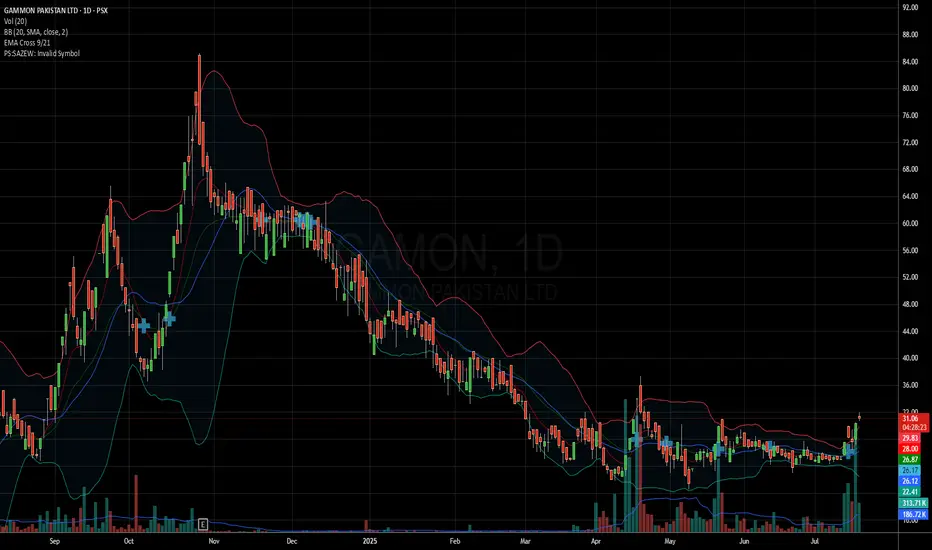
GAMON - Low risk / return tradeAt good levels, and one can expect the stock to move with market, and give high profit trade.
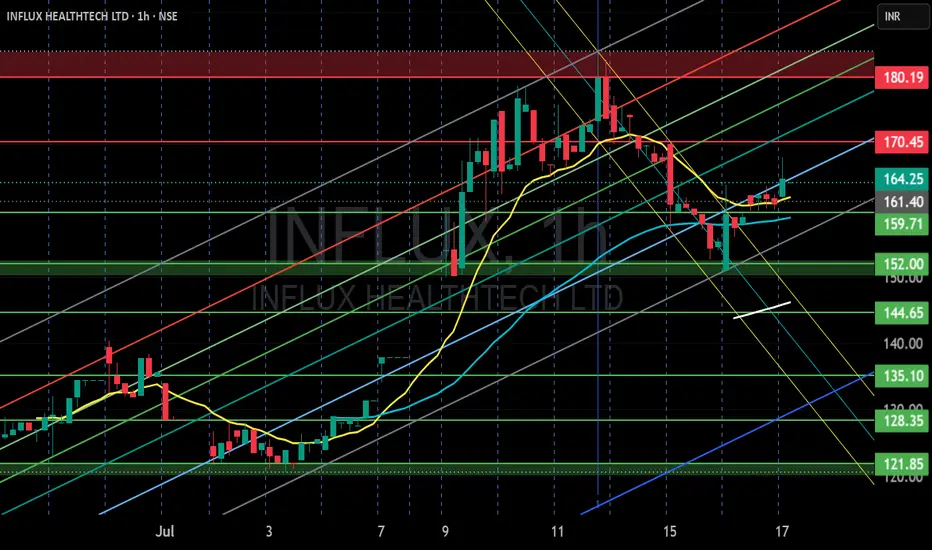
INFLUX HEALTHTECH LTD S/R Support and Resistance Levels:
Support Levels: These are price points (green line/shade) where a downward trend may be halted due to a concentration of buying interest. Imagine them as a safety net where buyers step in, preventing further decline.
Resistance Levels: Conversely, resistance levels (red line/shade) are where upward trends might stall due to increased selling interest. They act like a ceiling where sellers come in to push prices down.
Breakouts:
Bullish Breakout: When the price moves above resistance, it often indicates strong buying interest and the potential for a continued uptrend. Traders may view this as a signal to buy or hold.
Bearish Breakout: When the price falls below support, it can signal strong selling interest and the potential for a continued downtrend. Traders might see this as a cue to sell or avoid buying.
MA Ribbon (EMA 20, EMA 50, EMA 100, EMA 200) :
Above EMA: If the stock price is above the EMA, it suggests a potential uptrend or bullish momentum.
Below EMA: If the stock price is below the EMA, it indicates a potential downtrend or bearish momentum.
Trendline: A trendline is a straight line drawn on a chart to represent the general direction of a data point set.
Uptrend Line: Drawn by connecting the lows in an upward trend. Indicates that the price is moving higher over time. Acts as a support level, where prices tend to bounce upward.
Downtrend Line: Drawn by connecting the highs in a downward trend. Indicates that the price is moving lower over time. It acts as a resistance level, where prices tend to drop.
Disclaimer:
I am not SEBI registered. The information provided here is for learning purposes only and should not be interpreted as financial advice. Consider the broader market context and consult with a qualified financial advisor before making investment decisions.