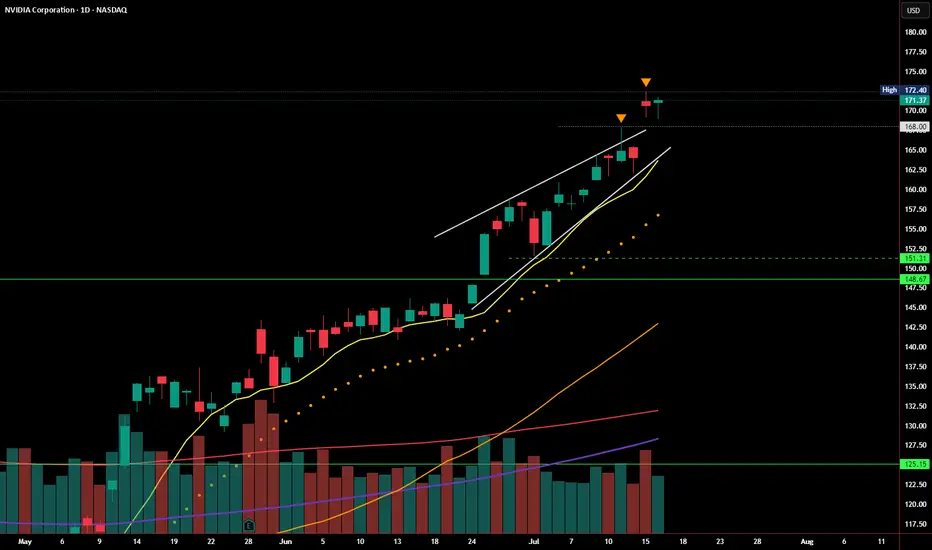
NVDA Follow-Up: Breakout Holding, But Still on Thin IceIn yesterday’s post, I highlighted the rising wedge pattern and noted that a breakout above $168 needed strong follow-through to confirm. Today, NVDA managed to hold above that level, closing at $171.37, just beneath the recent high of $172.40.
So far, the breakout attempt is intact — but not yet convincing.
🔹 Volume came in lighter, suggesting buyers aren’t fully committed
🔹 The candle printed a modest gain, but without expanding range or momentum
🔹 Price is still riding above the rising wedge, but hasn’t cleared resistance with authority
As long as NVDA stays above $168, bulls remain in control — but a daily close back below that level would re-enter the wedge and raise the risk of a false breakout, putting $151–148 back on the radar.
Until we see a strong breakout above $172.40 with volume, this remains a cautious breakout, not a confirmed one.
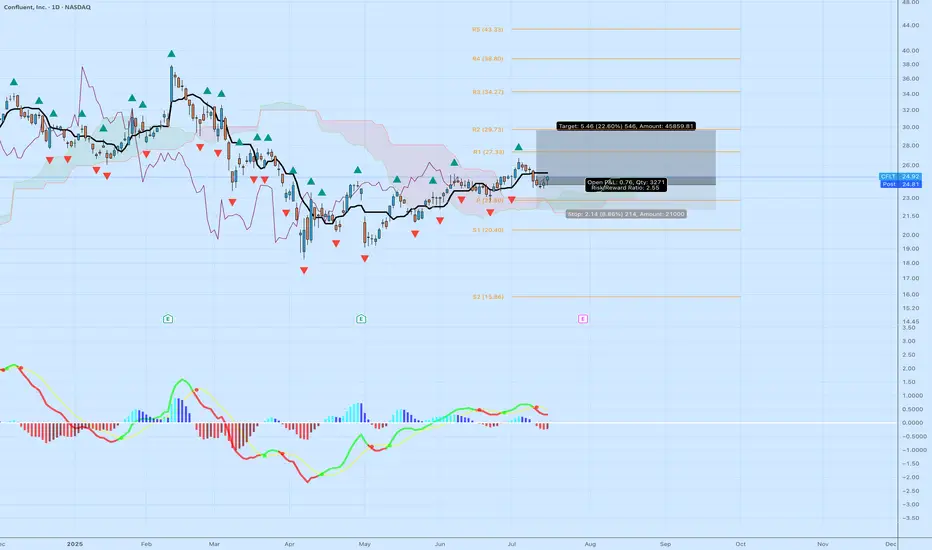
CFLT: Bullish Momentum Breakout Targeting $29.76 – Strong R/R Ticker: NASDAQ:CFLT (Confluent, Inc.)
Bias: Long
Timeframe: Daily (with momentum building from May lows)
Entry: Around $24.30 (near recent breakout above pivot at $22.80)
Stop Loss: $22.14 (below swing lows, ~8.86% risk)
Target: $29.76 (near R2 resistance, ~22.60% reward)
Risk/Reward Ratio: 2.35:1
Position Sizing Suggestion: Limit risk to 1-2% of capital (e.g., ~$21,000 total risk on 3,271 shares as shown)
Confluent (CFLT) is showing strong bullish momentum on the daily chart, breaking out from a multi-month consolidation base between $18–$23 since April 2025 lows. The price has formed higher highs and lows, supported by a bullish MACD crossover (green signal line above red, positive histogram bars), indicating accelerating upside potential. RSI is neutral around 54–60, leaving room to run without being overbought. Volume has ticked up on recent green candles, confirming buyer interest.
From a smart money perspective, institutional ownership stands at ~78%, with net buying in Q2 2025 (e.g., hedge funds adding ~7.1M shares). This aligns with Confluent's growth in real-time data streaming for AI and cloud applications, boosted by the July 2025 AWS Marketplace expansion for AI agents. Fundamentals support this: Q1 2025 beat expectations (EPS $0.08 vs. $0.07, revenue +26% YoY, Cloud segment +42%), though guidance was conservative amid macro IT spending slowdowns.
Pivot points guide the trade: Break above P ($22.80) targets R1 ($27.33) then R2 ($29.73, close to my $29.76). If momentum holds (e.g., breakout above $25.82), we could see extension to $31–$32 based on analyst averages (Moderate Buy consensus, target ~$31.50 from 30 analysts).
Risks to Watch: Upcoming Q2 earnings on July 30 could introduce volatility—consider trailing stops or exiting beforehand if holding through. Competition from hyperscalers (AWS, GCP) and broader tech sector dips (CFLT beta 1.71) could pressure if support fails. Not financial advice; always DYOR.
If you agree with this setup or have thoughts on CFLT, drop a comment below! Hit like if this helps, and follow for more ideas. Let's see how this plays out—I'll update as needed. 🚀
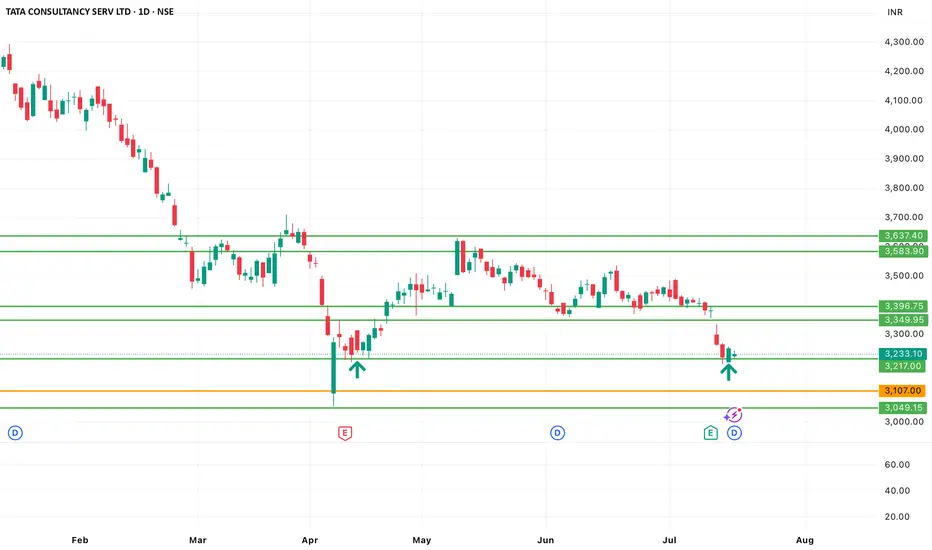
At demand areaIn stock trading, a demand area, or demand zone, refers to a price range where buying interest is strong, potentially leading to a price increase or a price bounce. It's essentially a "buying hotspot" where buyers are actively purchasing, pushing the price upward
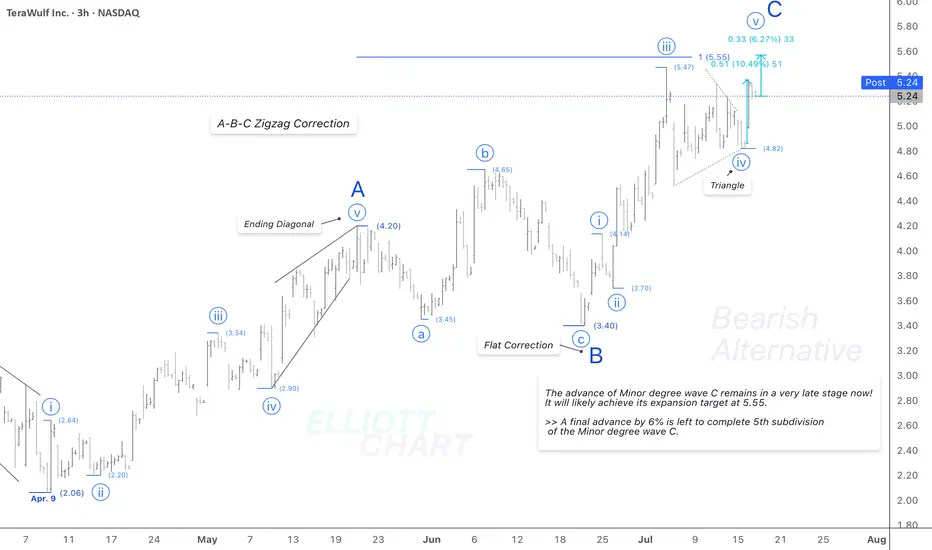
WULF / 3hAccording to the prior analysis, NASDAQ:WULF rose by 10.5% intraday in a swift advance as expected.
Wave Analysis >> The triangle correction in wave iv(circled) worked, followed by a swift advance in the same degree wave v(circled), which its 6% is left to conclude the Minor degree wave C of the entire correction in an A-B-C zigzag as a countertrend advance in Intermediate degree wave (B) >> Not shown in this frame.
Target >> The Fib expansion target at 5.55 remains intact >> Where Minor degree wave C would equal the same degree wave A.
Trend Analysis >> The countertrend advance as Intermediate degree wave (B) will probably change to decline in the same degree wave (C) very soon!! And it'll likely last until the end of the year!
#CryptoStocks #WULF #BTCMining #Bitcoin #BTC
NASDAQ:WULF CRYPTOCAP:BTC MARKETSCOM:BITCOIN
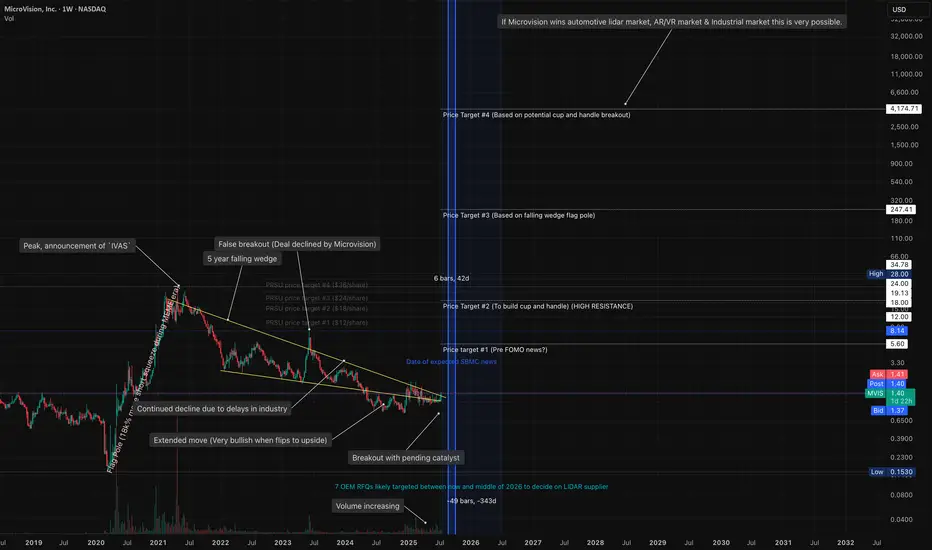
Markets Converging MVIS market changing potentialMicrovision is weeks away from hitting an intense inflection point.
Pending news for SBMC (decision date August 29th )
Microvision is partnered with NVDA for their driving lidar and software -- and have a plug and play system better than any competitor. (an update was made to MVIS website while not yet on the NVDA website. Possibly indicating pending news related)
Industrial contracts are positioned to come in by September of this year.
Potentially in the month of August/September MVIS could announce news of wins in 3 different verticals absolutely flipping the bear base upside down. causing an insane short squeeze. (to TRUE/FAIR market evaluations)
The 5 year chart I have shown indicate moves and price targets as well as time frames for news. The consolidating 5 year wedge can also be seen as wyckoff accumulation. There are multiple indicators implying bullish divergences on the 5 year time frame. People WANT MVIS.
These markets MVIS are entering are HUGE and going to grow astronomically. The potential upside if MVIS is established as the key player could be INSANE.
Lidar competitors have typically 1 vertical. Microvision has 5.
I believe the catalyst to all of this is news related to SBMC. industrial and automotive OEMs are conservative and want a company that will survive to fulfill their needs. an SBMC would guarantee survivability and military approval.
I believe multiple OEMs are waiting for this exact moment. if MVIS is selected by the DoD, then a domino effect will happen in all 3 markets.
META, GOOGLE, APPL will also then see the AR tech validated & may proceed with trying to buy them out or purchase licenses.
This stock, could be THE stock of a lifetime.
Netflix: Hovering Just Below Key Target ZoneNetflix has rebounded over the past two sessions after falling below the beige Short Target Zone ($1,270–$1,432) and is now trading just beneath it. A renewed push into this range could complete turquoise wave 3, followed by a corrective wave 4 likely dipping below $1,180. Alternatively, with a 33% probability, turquoise wave alt.3 may already have peaked, opening the door for an immediate drop through $1,180. A broader correction in beige wave IV is expected once wave III concludes, before upside resumes in wave V.
📈 Over 190 precise analyses, clear entry points, and defined Target Zones - that's what we do (for more: look to the right).

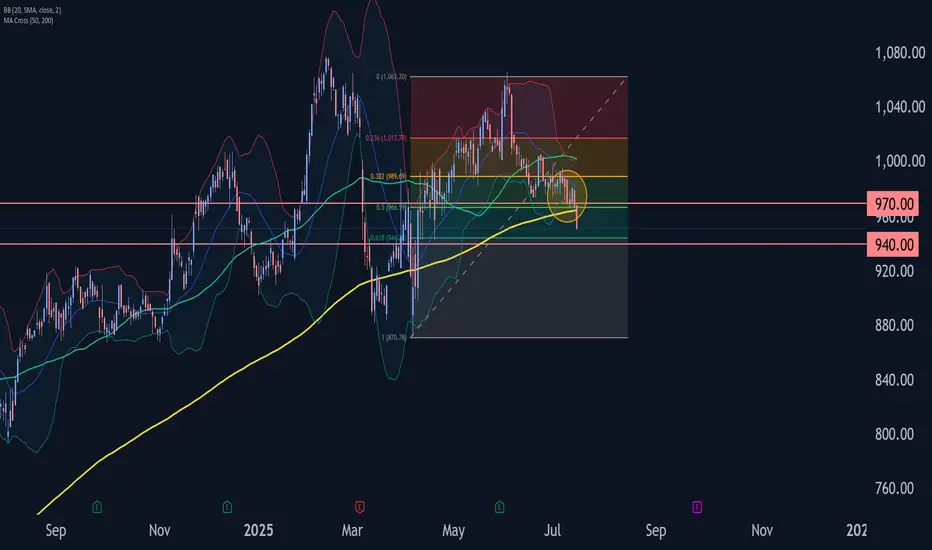
Costco Wave Analysis – 16 July 2025
- Costco broke the support area
- Likely to fall to support level 940.00
Costco recently broke the support area located between the pivotal support level 970.00 and the 50% Fibonacci correction of the upward impulse from April.
The breakout of this support area accelerated the C-wave of the active ABC correction (2).
Costco can be expected to fall to the next support level 940.00 (target price for the completion of the active C-wave).
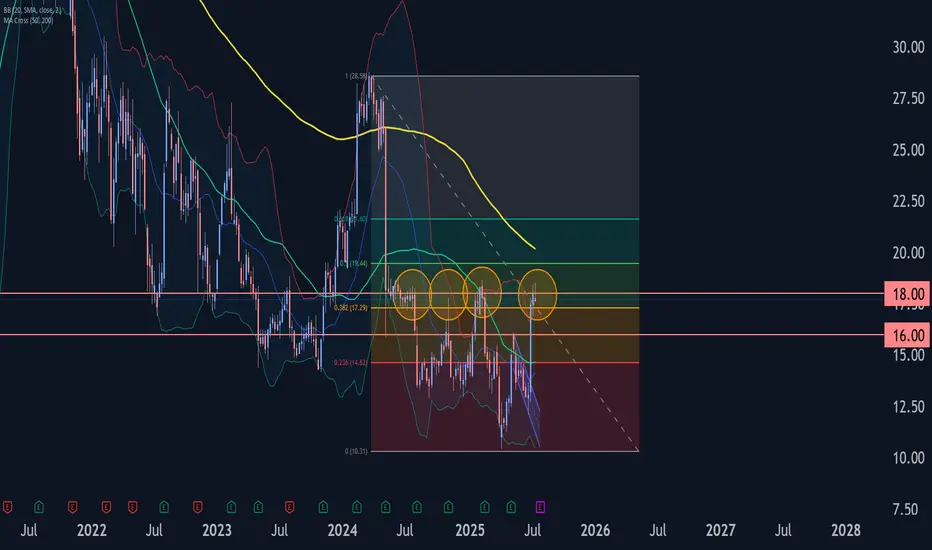
Trip Wave Analysis – 16 July 2025- Trip reversed from resistance area
- Likely to fall to support level 16.00
Trip recently reversed down from the resistance area located at the intersection of the strong resistance level 18.00, upper weekly Bollinger Band and the 38.2% Fibonacci correction of the weekly downtrend from 2024.
The downward reversal from this resistance area stopped the earlier weekly impulse waves i and C.
Given the strength of the resistance level 18.00 and the overbought weekly Stochastic, Trip can be expected to fall to the next support level 16.00.
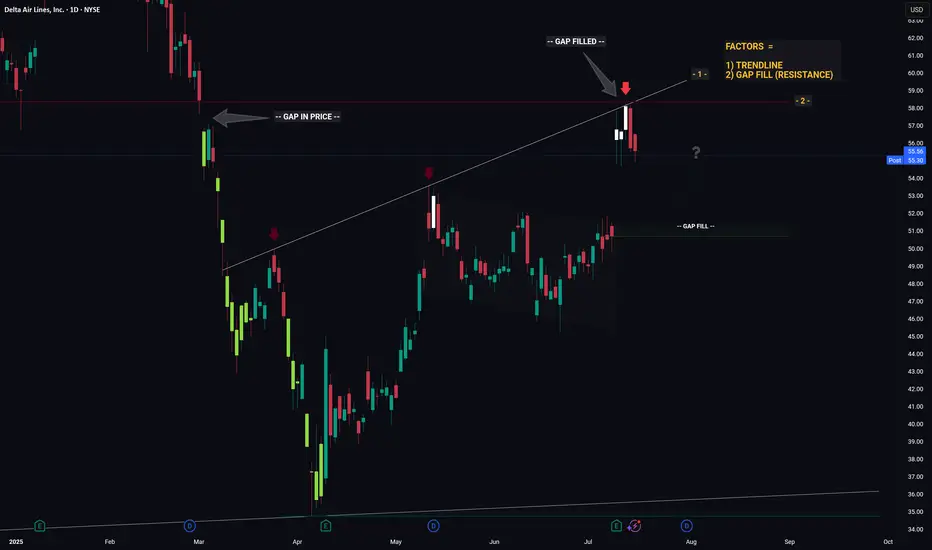
DELTA - Converging Levels Creates Huge Resistance - Retrace?Hello Traders!
Whichever Hedge Fund that is responsible for the recent price action in DELTA mustve been in a generous mood... because theyre giving us an excellent hint as to what price will likely do next.
And what hint might that be you ask...
1) Trendline (connecting the recent highs)
2) Gap Fill (Resistance)
Individually these factors are relatively strong, however when combined they essesntially create a strong barrier that will be very hard for price to break through. Think about it like a wall made from Captain Americas shield... now try and break through that.. aint gonna be easy.
So whats next for price? If I was a betting man (and I am, incase you were wondering) I would say theres a high probability that price is going to trade down from this resistance level then retrace to the gap fill below. From the gap fill level we will likely see a bounce.
Thanks, I hope you found this post educational or helpful and best of luck on your trading journey!
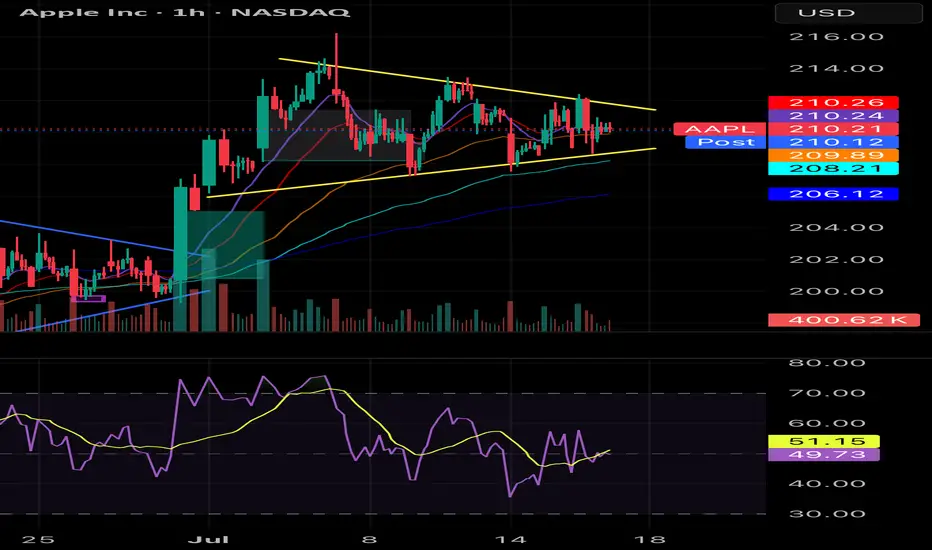
AAPL BULLISH WEDGEApple previously wedged, and broke out into the 213s. I previously tracked it but didn't enter. As of recent the volume has been thinning and the PA has been consolidating. I believe Apple has potential to breakout once again. The EMAs are also in more of a bullish stack. Hoping to hit somewhere in the 218-230. From a technical standpoint looks good but watch for general market sentiment and other tech stocks / QQQ as many have claimed they're due for a pullback and I agree. If they move Apple moves. Nfa
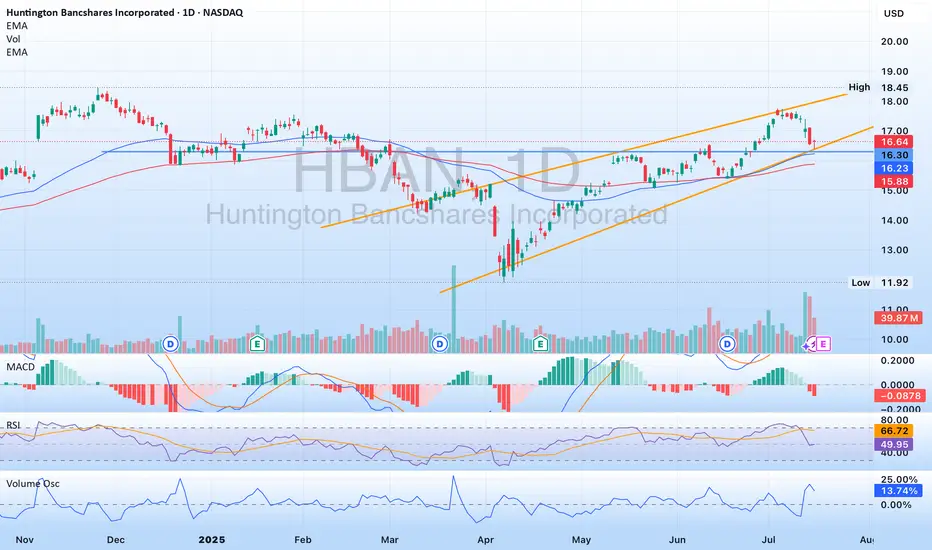
$HBAN - well positioned to continue on its pathNASDAQ:HBAN has been in a rising channel since April, and is no touching the lower band of the channel. His area also includes some previous resistance turned support, as well as some movement paces. NASDAQ:HBAN recently announced they are acquiring Veritex ( NASDAQ:VBTX ) which will strengthen their mark in Texas. Please note NASDAQ:HBAN is releasing earnings July 18th. A good report should see the stock moving towards the upper band of the channel, maybe break through it.
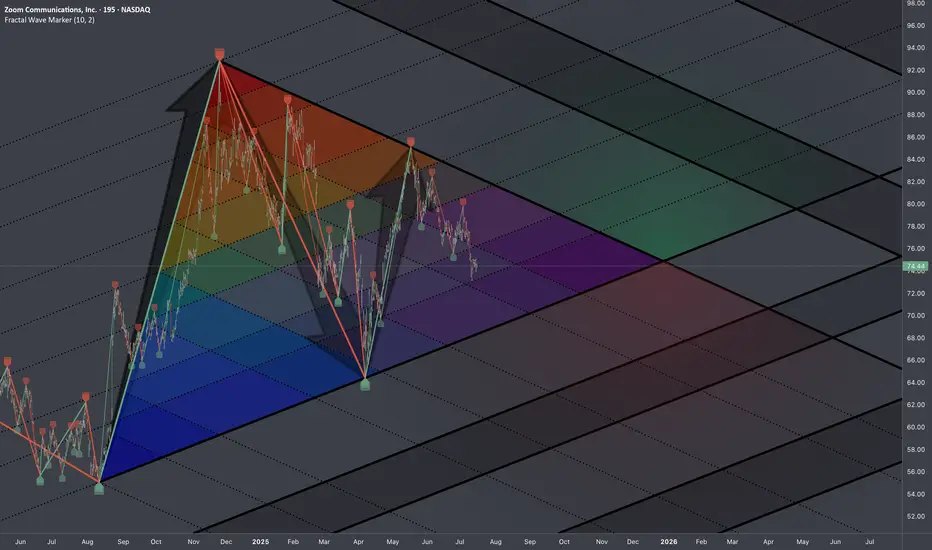
$ZM: Fib TriangleChose TF 195m (3h15m) so that each candle is half of trading session.
Research Notes
Documenting identified compression of cycles and their phases on multiple scales:
Fib Interconnections of critical points:
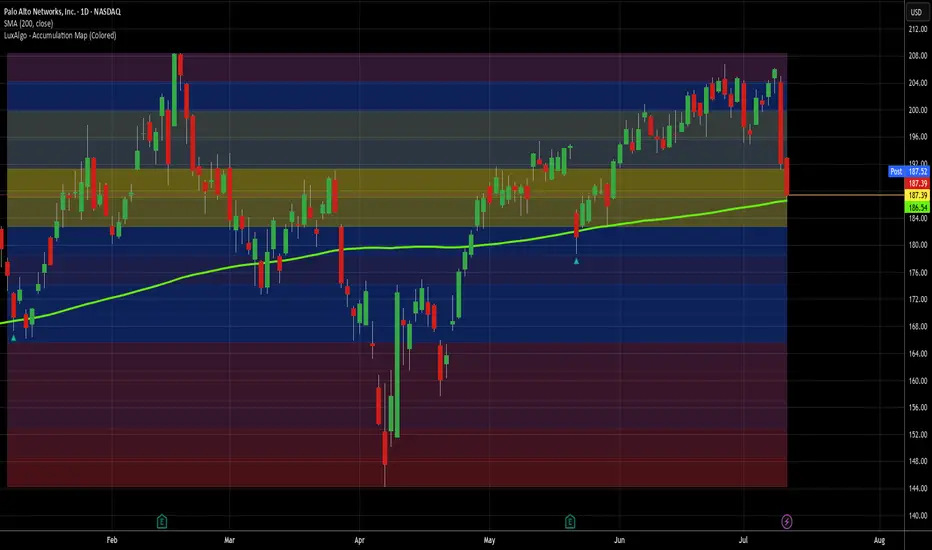
Taking another trip to Palo Alto for a quick flip If you want all the details on why I'm taking this trade, refer back to my Palo Alto ideas from Jan 8th and May 21st of this year. The only thing that has changed since May is 4 more profitable trades on PANW, so it's now 25-0. The longest of those 4 has taken 4 days and the average return on them has been 2.16%. So I'm going to Palo Alto again.
The entire cybersecurity sector took it on the chin yesterday, with NET, CRWD, ZS and others all down big and it continued today for them. I know PANW the best, so that's why I'm choosing it, but I think any of them could do well here. PANW is right on its 200d MA and has been above it for the better part of the last 3 years. Even if this trade takes longer than expected to produce, PANW and cybersecurity are not going anywhere. If I had to hold this one for years, I'd be happy to. Well, not "HAPPY" happy, but you get the point.
My exit is signal-based rather than price level based, but I'm targeting under a week for a return of 1-3% on average. Let's hope PANW keeps its record intact and makes this my best trade of the day.
As always - this is intended as "edutainment" and my perspective on what I am or would be doing, not a recommendation for you to buy or sell. Act accordingly and invest at your own risk. DYOR and only make investments that make good financial sense for you in your current situation.
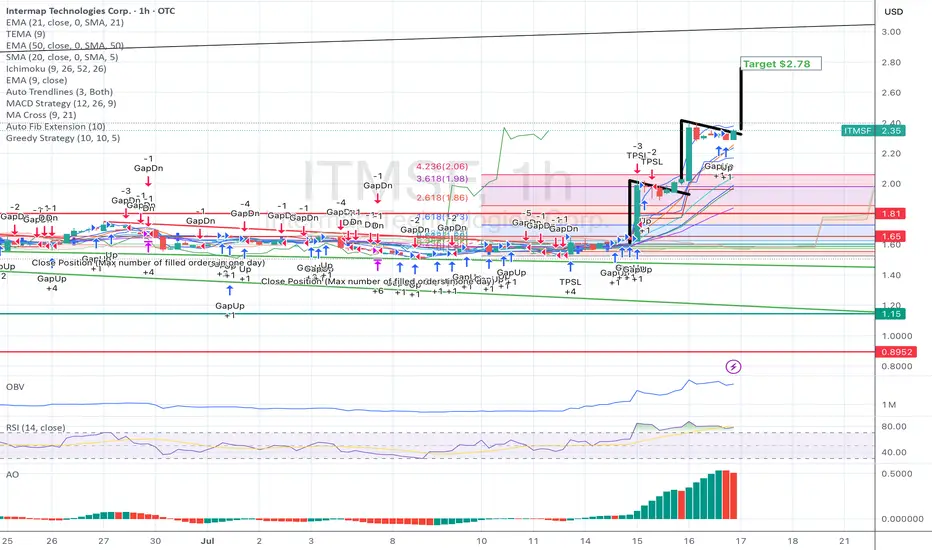
Continuation with exact bull flag for back to back %15 on ITMSF Price discovery is occurring and much more to go to get to $5.... :)
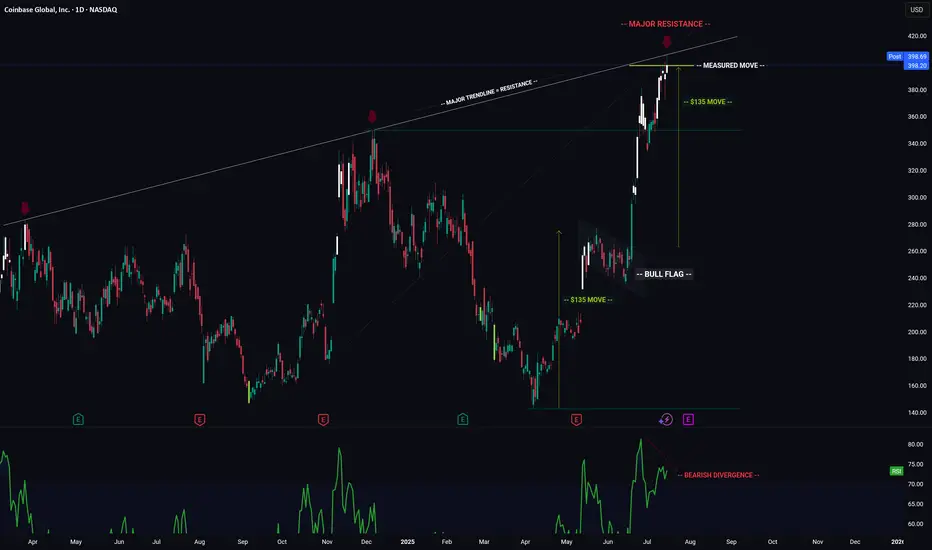
COIN -- Major Trendlines + Bearish Divergence = Breakdown?Hello Traders!
Today I have shared the chart of COINBASE. Of course we cant know for sure what price will do, however you can take clues and combine them to give you a high probability reading of the chart.
Here are the clues:
1) MAJOR TRENDLINE
2) TRENDLINE
3) BEARISH DIVERGENCE
4) BULL FLAG MEASURED MOVE
When we combine these clues, a very bearish picture is painted... This signals to me that there is a high probability price will likely reverse and trade to the downside in the near future.
I hope everyone enjoyed this post and is able to use it as an educational tool.
Thanks everyone and best of luck on your trading journey!
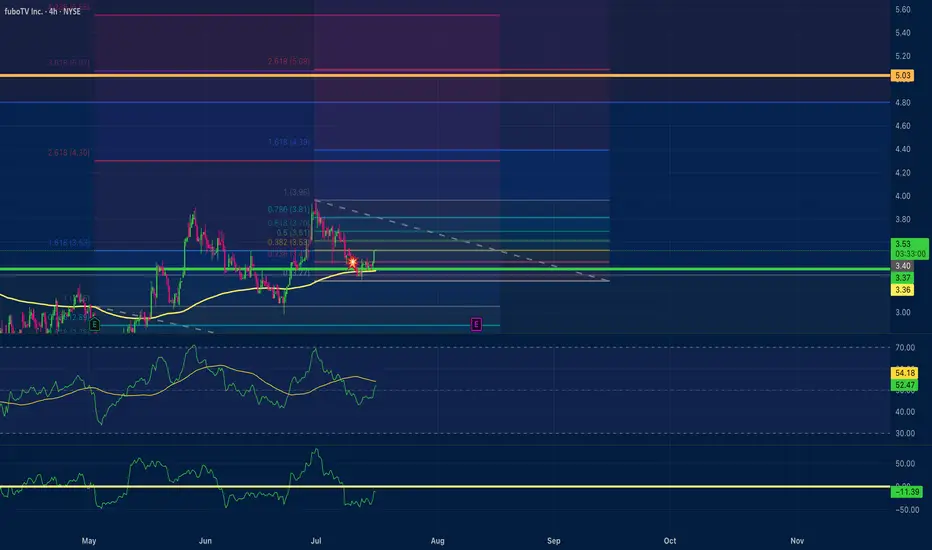
fuboTV $5.00 price target Positive Divergence Multi time frameMy trade on fuboTV has a $5.00 price target. With positive divergence multiple time frames 15,1hr, 4hr. An RSI scoop where the hrly RSI with a length setting of 36 shows upward momentum? The Chande momentum oscillator with a setting of 24 indicates the price may not stall at $4.50.
Stocks SPOT ACCOUNT: APPLE stocks Buy Trade with Take ProfitStocks SPOT ACCOUNT:
MARKETSCOM:APPLE stocks my buy trade with take profit.
This is my SPOT Accounts for Stocks Portfolio.
Trade shows my Buying and Take Profit Level.
Spot account doesn't need SL because its stocks buying account.
Looks good Trade.
Disclaimer: only idea, not advice

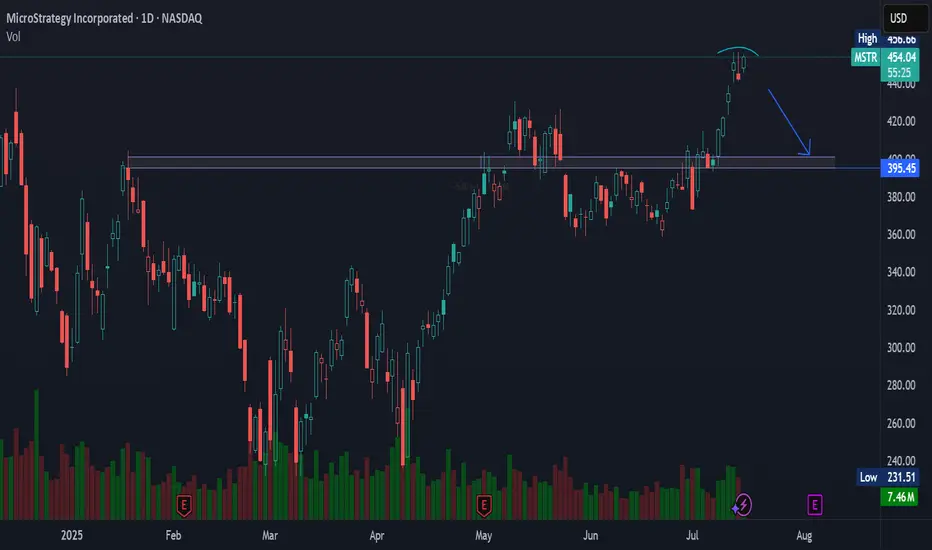
MSTR NASDAQ:MSTR looks like it’s gearing up for a pullback — eyes on the $395 level for a potential retest.
Watch the support. 👀📉
#MSTR #Bitcoin #Stocks #Tech #Trading
Why Circle Internet Group (CRCL) Could Reverse Course and Target
After a period of extreme volatility and sharp corrections, Circle Internet Group (NYSE: CRCL) is showing technical and fundamental signs that a reversal toward $240 is plausible. Here’s why investors and traders should watch for a potential rebound:
1. Strong Underlying Growth Drivers Remain Intact
Despite recent profit-taking, the core business fundamentals that fueled CRCL’s parabolic rise remain robust. Circle operates the world’s second-largest stablecoin (USDC), with over $60 billion in circulation and a dominant position in blockchain-based financial infrastructure. Its revenue model—primarily interest income from USDC reserves—remains highly lucrative in the current high-rate environment, and the company continues to expand its enterprise API and non-stablecoin revenue streams.
2. Technical Support and High-Volume Reversal Zone
The latest chart action shows that after a steep sell-off from highs near $299, CRCL found strong support in the $175–$185 range, coinciding with key moving averages and previous breakout levels. The stock has since stabilized and begun consolidating above these supports, with buyers stepping in on high volume—often a precursor to a reversal, especially after such a rapid drawdown.
3. Analyst Sentiment and Price Targets
Despite recent volatility, analyst consensus remains bullish. The average 12-month price target is in the $183–$230 range, with several analysts highlighting the potential for further upside if Circle continues to scale USDC and diversify revenue. The recent correction may have reset overbought technicals, giving the stock room to run if sentiment improves.
4. IPO Volatility and Mean Reversion
CRCL’s post-IPO performance has been extraordinary, with the stock surging nearly 750% since its debut at $31 per share. Such explosive moves are often followed by sharp corrections as early investors take profits. However, historical IPO data suggests that high-growth tech stocks frequently experience a mean-reverting bounce after initial corrections, especially when underlying fundamentals remain strong and speculative excess is flushed out.
5. Macro and Industry Tailwinds
Circle’s leadership in the stablecoin market positions it at the heart of the rapidly growing digital finance sector. As regulatory clarity improves and institutional adoption of blockchain accelerates, Circle stands to benefit from increased transaction volumes and new use cases, supporting a higher valuation over time.
Conclusion: The Path to $240
With technical support established, bullish analyst sentiment, and powerful industry tailwinds, CRCL is well-positioned for a reversal. If the stock can maintain support above the $180 level and regain momentum, a move back to the $240 zone—a key psychological and technical level from its recent trading history—is well within reach. Investors should watch for confirmation via increased volume and a break above short-term resistance to validate the reversal thesis.

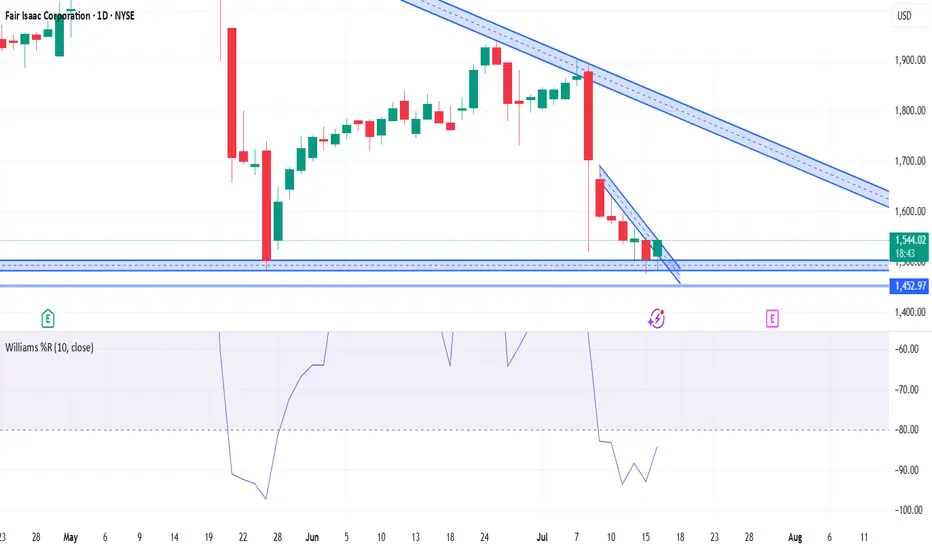
$FICO Bullish too good to ignore here. seems like it has finally found support just where it did a few weeks ago. Williams % range curling as well. Invalidation would be a close below the S/R flip zone below. First target would be to test the falling trend zone and hopefully find a breakthrough
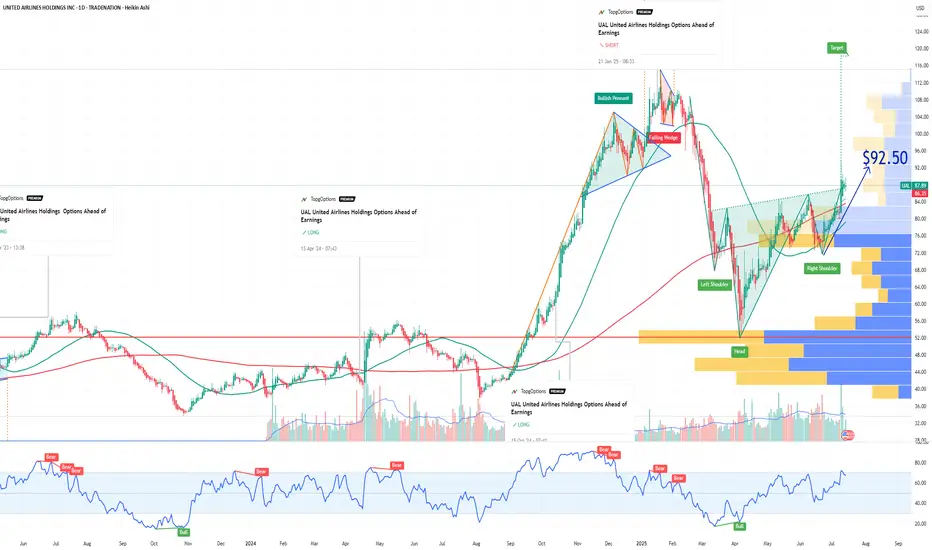
UAL United Airlines Holdings Options Ahead of EarningsIf you haven`t exited UAL before the recent selloff:
Now analyzing the options chain and the chart patterns of UAL United Airlines Holdings prior to the earnings report this week,
I would consider purchasing the 92.5usd strike price Calls with
an expiration date of 2025-9-19,
for a premium of approximately $5.12.
If these options prove to be profitable prior to the earnings release, I would sell at least half of them.
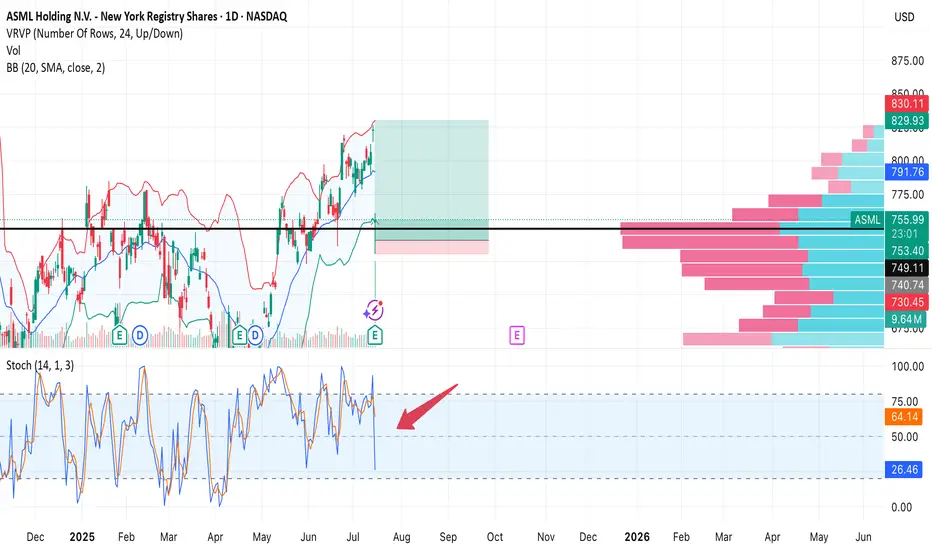
ASML — Strong earnings, sharp drop on profit-taking. Second chanAfter a strong quarterly report, NASDAQ:ASML stock initially surged, but then dropped -7.6% in a single session. Most likely due to profit-taking and a broader tech sector correction. Still, the key $754 support held, and the uptrend remains intact.
Trade Setup:
• Buy Zone: $754–760 (on retest)
• Target: $849 (+12%)
• Stop Loss: $730 (below support and volume shelf)
• Risk/Reward: 1:8
Earnings were great, fundamentals are solid. This drop could be a shakeout before continuation. As long as $754 holds, bulls have a second chance.