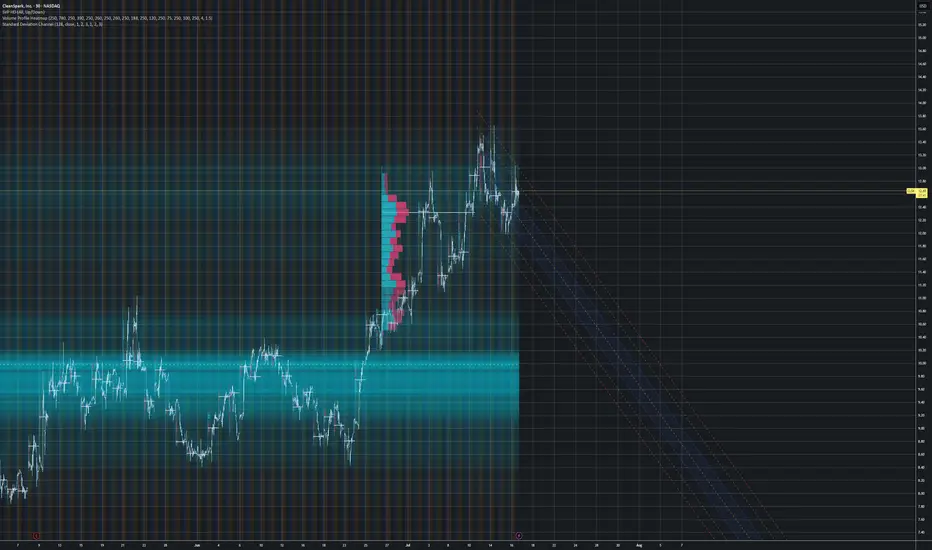
[$CLSK] CleanSpark Inc. - Farming [$BTC] LongNASDAQ:CLSK
no finanical advice
📑market outlook
+ Fed rate cut priced in --> short term risk-on environment
+ total FIAT-debasement in motion --> Precious &Crypto are poomping
- geo-political risk can drag down the 'weaker ANTI-Fiat' risk-on positions
💡idea
we want to farm BTC indirectly by selling covered-calls /placing cash secured puts
🧪approach
derivatives options with i.e. 0.1 BTC ~ 10,000 USD
🏁target
get 2% yield per month
⚠️ caution
Only weekly options: --> Crypto Cycle could take hits of -50% which would basically demolish your position
--> check weekly volume/sentiment on BTC
Don't forget:
⏳ Theta is our alley. Always have been!

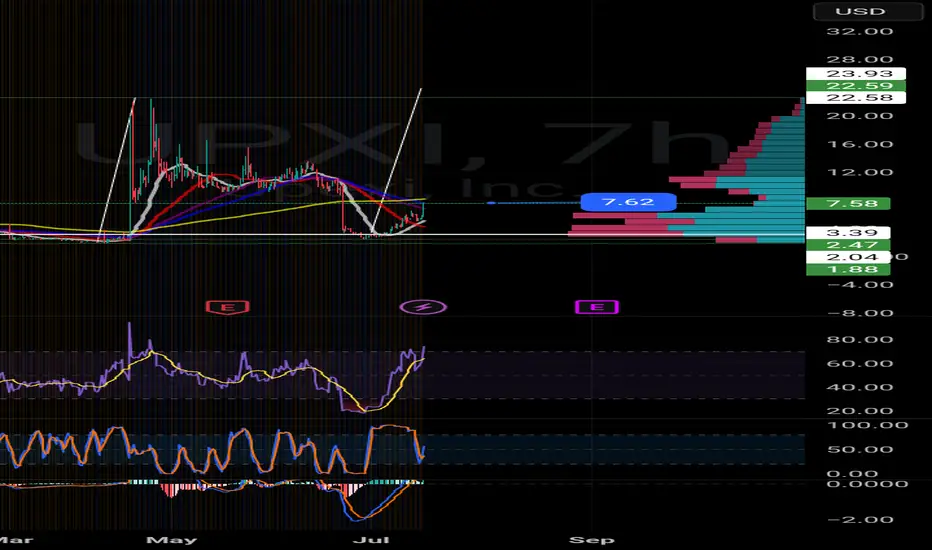
Upxi7hr low stochastics
Potential hidden bullish divergence here.
I could see a 23 a share target.
My humble opinion
[$CLSK] CleanSpark Inc. - Farming [$BTC] Long[ NASDAQ:CLSK ]
no finanical advice
📑market outlook
+ Fed rate cut priced in --> short term risk-on environment
+ total FIAT-debasement in motion --> Precious &Crypto are poomping
- geo-political risk can drag down the 'weaker ANTI-Fiat' risk-on positions
💡idea
we want to farm BTC indirectly by selling covered-calls /placing cash secured puts
🧪approach
derivatives options with i.e. 0.1 BTC ~ 10,000 USD
🏁target
get 2% yield per month
⚠️ caution
Only weekly options: --> Crypto Cycle could take hits of -50% which would basically demolish your position
--> check weekly volume/sentiment on BTC
Don't forget:
⏳ Theta is our alley. Always have been!
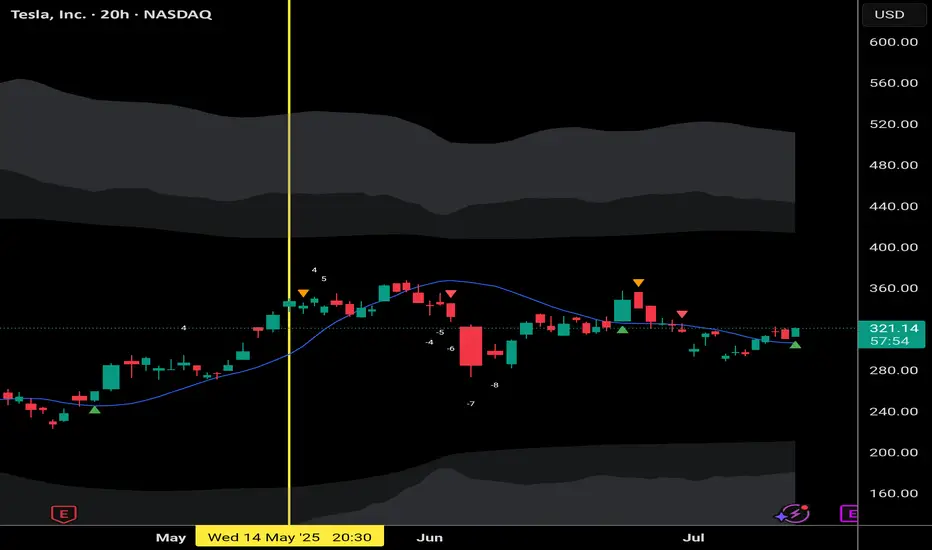
TSLA about to put in a huge reversal dayCoinrotator.app signaling higher after a 3 month consolidation.
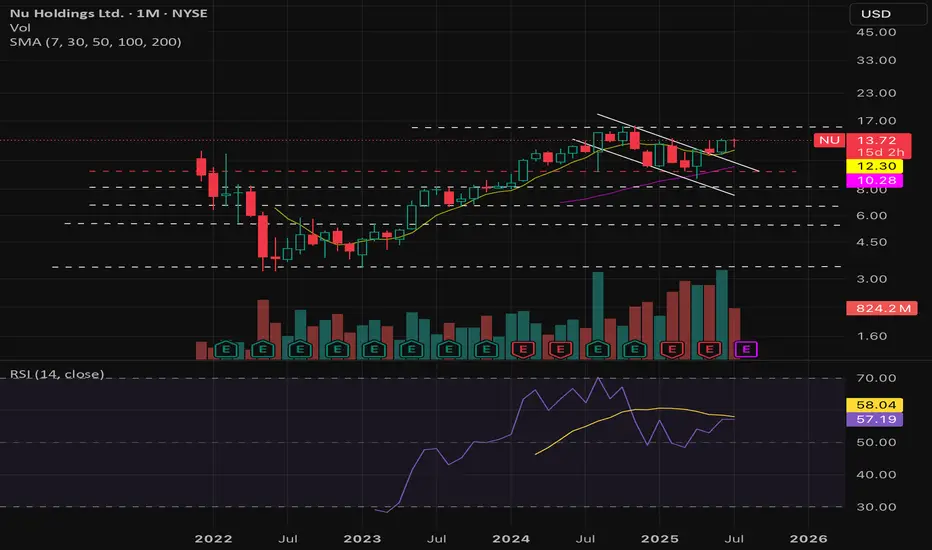
$NU : 30% CAGR for your portfolio for the next 3-5 years!- NYSE:NU is a big name in the LATAM.
- LATAM is expected to grow significantly in next decade with digitalization as the strongest theme.
- Let's talk about fundamentals:
Year | 2025| 2026| 2027 | 2028
EPS | 0.56 | 0.77 | 1.05 | 1.45
EPS growth% | 31.99% | 37.71% | 36.05% | 38.58%
For a company growing EPS at 30%+ deserves a forward p/e of 30
Base Case Stock Value ( Forward p/e = 30 ):
Year | 2025| 2026| 2027 | 2028
fair value | $16.8 | $23 | $31 | $43
Bear Case ( Forward p/e = 20 )
Year | 2025| 2026| 2027 | 2028
fair value | $11.2 | $15.4 | $21 | $29
Bull Case ( Forward p/e = 35 )
Year | 2025| 2026| 2027 | 2028
fair value | $19.6 | $26.95 | $36.75 | $50
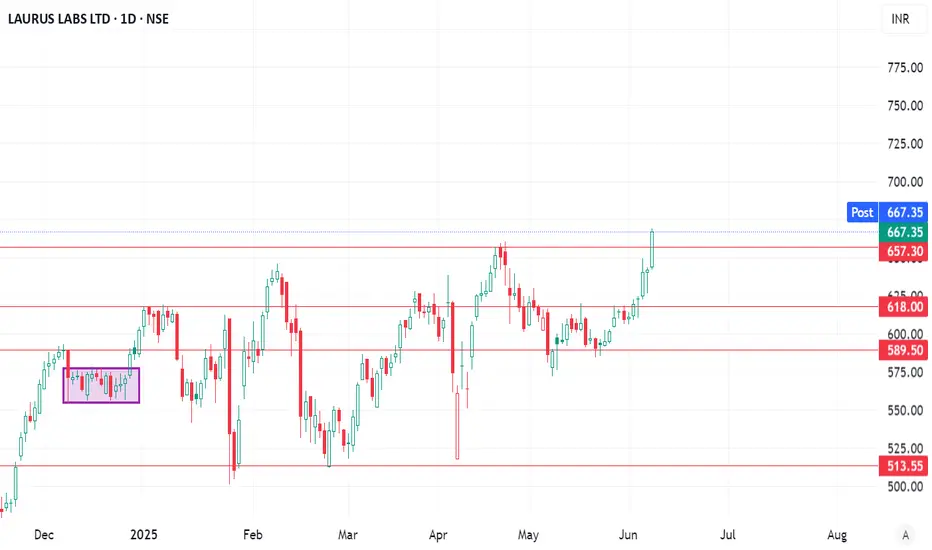
Positional Setup for Laurus LabsCMP: ₹667.35
Breakout Level: ₹657–660 (now turned support)
Support Zones: ₹657, ₹618
Resistance Levels (next targets): ₹705–710, ₹735
Indicators:
Supertrend: ✅ Bullish
TEMA 5-9-20: ✅ Trending up
Volume/Price Action: Strong bullish candle post consolidation
📈 Technical View (Positional)
Laurus Labs has broken out above ₹657 resistance with strong momentum, closing near day’s high.
The chart shows a previous consolidation box (highlighted) followed by trend continuation—classic breakout setup.
Positional structure is bullish, with price holding above key moving averages.
🚀 Positional Targets:
Target 1: ₹705
Target 2: ₹735
SL (Closing Basis): ₹638
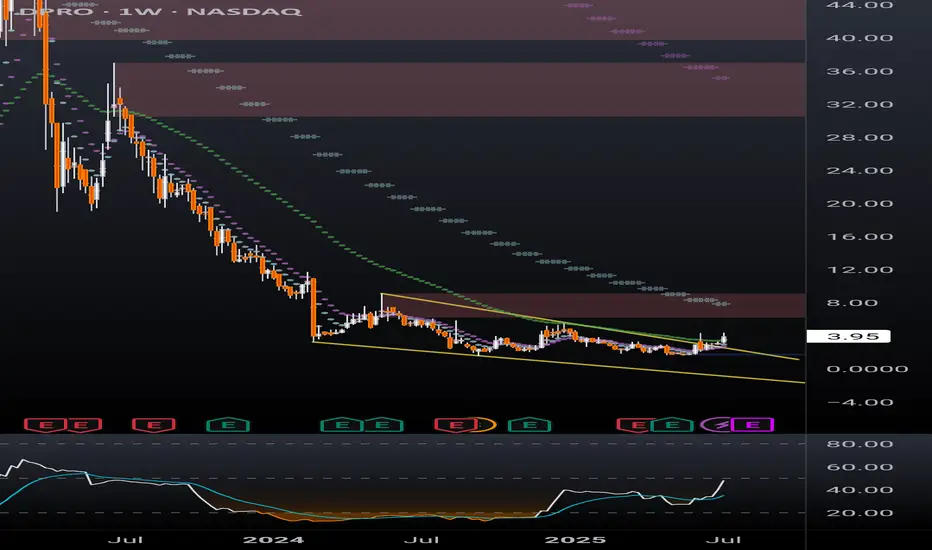
DPRO falling wedge breakoutDPRO has broken out of a falling wedge on the weekly. Ticker will respond well to Trump's "Big Beautiful Bill" which includes over $30 billion for defense/military spending. The drone company is already making progress with US military projects and is setting up for a strong rally.
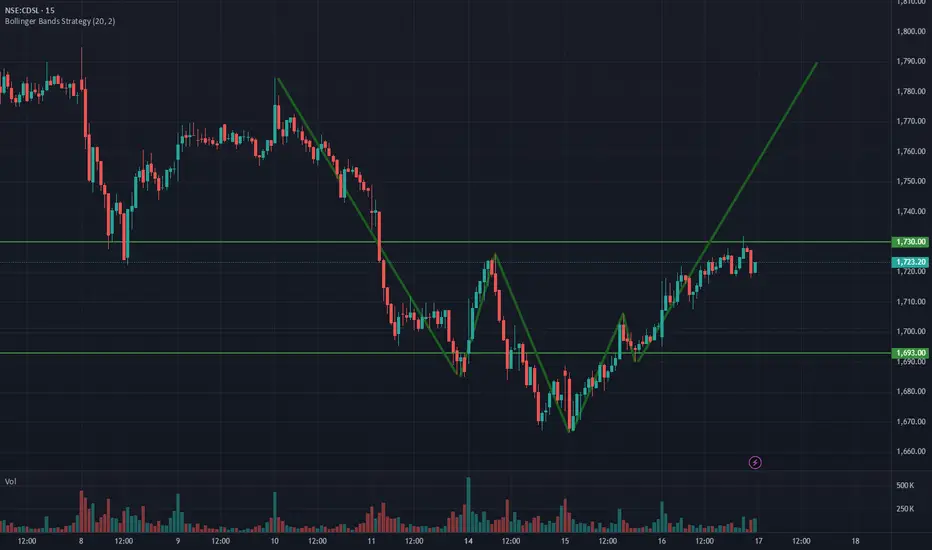
CDSL makes an Inverted H&S : A short term opportunityHi People
One of the most overhyped and a monopoly scrip just made a an Inverted Head and Shoulder pattern on 15 mins, which is an Bullish reversal pattern. The Stock broke the neck of the pattern and now resting on a crucial level of 1730 Rs.
Do understand that this is not a long term investment opportunity and just an short term trade as the stock is currently trading and an inflated PE ratio.
Breakout at 1730 level could fuel further movement in the stock and gives a swing trade/ intraday trade opportunity.
Disclaimer:- This analysis is just for educational purpose and doesn't guarantee profits. Do consult your financial adviser befor investing
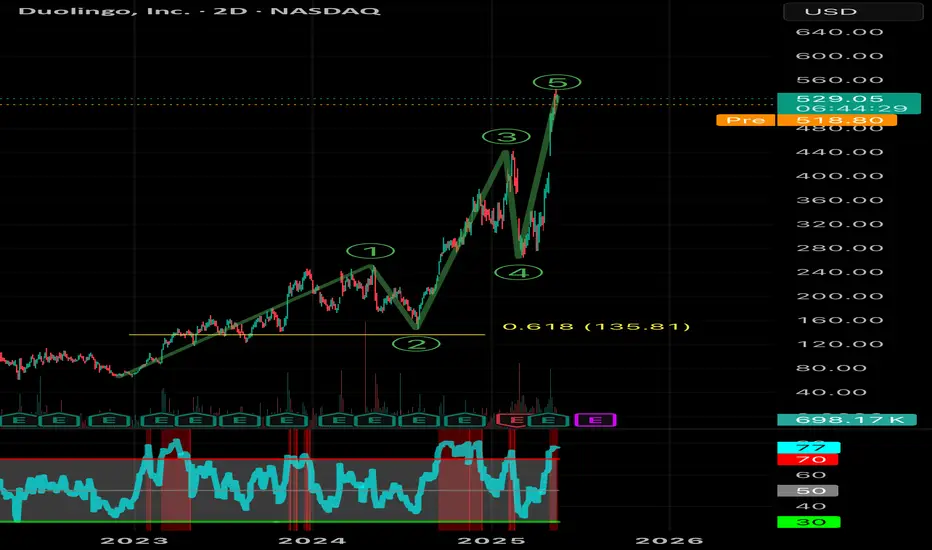
Blow off top?This is looking like the final leg up of Wave 5. I initiated a short position with a tight stop loss just above all time highs. This entire move looks extremely overextended and Duo Lingo is extremely overvalued.
Not financial advice, do what’s best for you.
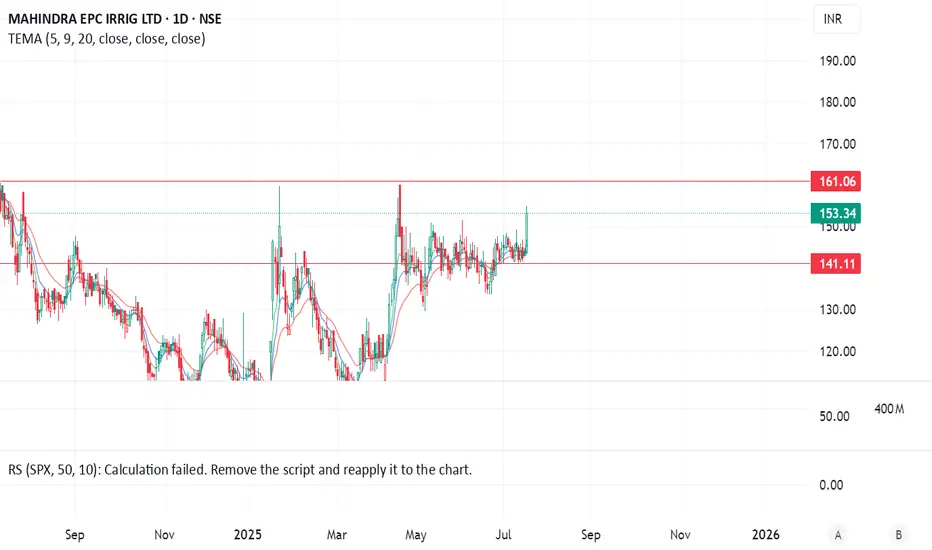
Positional setup for Mahindra EPC Irrigation Ltd (NSE: MAHEPC)Technical Analysis (Daily Chart)
CMP: ~₹153
Key Levels:
Resistance around ₹155–161 (tested multiple times).
Support at ₹141.
EMA 5‑9‑20 stack is bullish and rising (~144–146 zone).
Price Action: Clean breakout above ₹153–155 signals strength.
Volume: Volume surged on the latest breakout—strong buying.
Momentum: Short-term RSI turning positive (invisible but suggested).
📌 Trade Plan
Entry: ₹156–158 on a clean breakout above resistance
Stop: ₹141 (below recent support)
Targets: ₹175 → ₹195
RR: ~1:2+, favorable for positional trade
Nike - This is the bottom!💉Nike ( NYSE:NKE ) creates the bottom now:
🔎Analysis summary:
More than four years ago, Nike created its previous all time high. We have been witnessing a downtrend ever since and a correction of about -70%. But with the recent retest of an important horizontal structure and bullish confirmation, Nike is about to create a potential bottom.
📝Levels to watch:
$65, $80
🙏🏻#LONGTERMVISION
Philip - Swing Trader

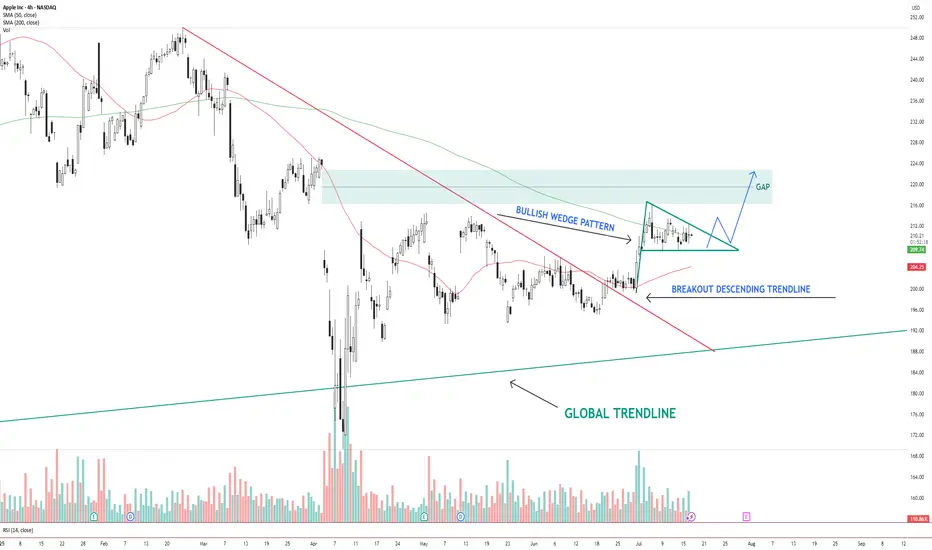
AAPL – Bullish Wedge Breakout Setup Toward Gap FillAAPL NASDAQ:AAPL has broken out of a descending trendline and is now consolidating inside a bullish wedge pattern . Price is holding above the 200 SMA and hovering near the 50 SMA.
The structure suggests a potential breakout above the wedge, with a clear gap area between $216–$224 acting as the next upside target.
Key levels:
Support: $206 (wedge base / 50 SMA)
Resistance: $216–$224 (gap zone)
Trend structure: Bullish consolidation after breakout
A clean breakout from the wedge with volume could trigger a continuation move toward the gap zone.
📌 Watching for confirmation and potential entry on a breakout + retest.
This is not financial advice. Always do your own research.
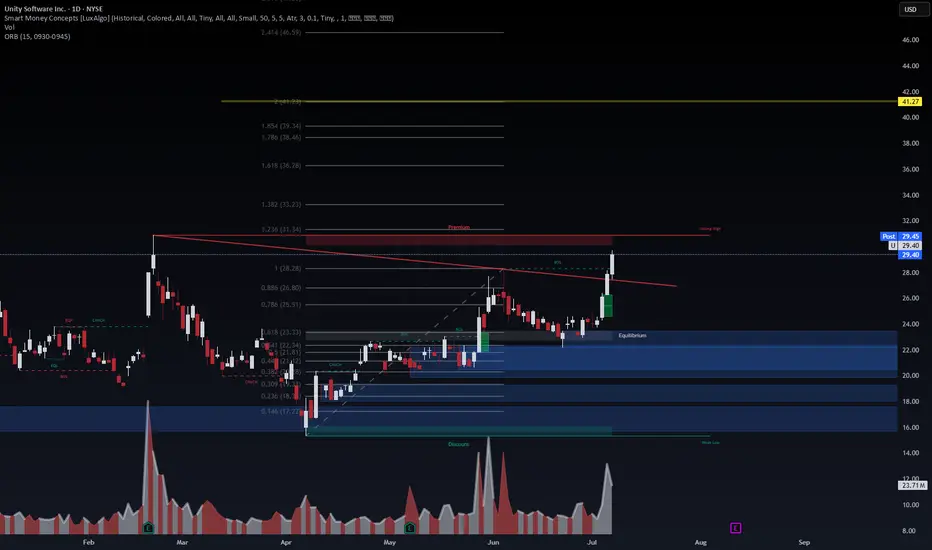
$U (Unity) — Breakout Into Premium Zone 📈 $U (Unity) — Breakout Into Premium Zone 🚀
Timeframe: 1D | Date: July 8, 2025 | Powered by WaverVanir DSS + SMC Framework
Unity ($U) just broke above a multi-month trendline and reclaimed structure with authority. Today's volume-backed candle has propelled price directly into the Premium zone, challenging the $28.28–31.34 range.
🔍 Technical Breakdown
✅ CHoCH + BOS Combo confirmed since late May
📈 Volume Spike (23.7M) → confirms institutional participation
🟥 Premium Zone Target: $31.34 (1.236 Fib)
⚡ Post-market sitting at $29.45 — breaking above trendline resistance
🔵 Equilibrium Zone: $23.50–25.50 (key reload area if pullback)
📍 Major Extension Target: $41.27–42.00 (Fib 2.0+) if continuation sustains
🧠 Macro Context
$U trading at historic lows, high short interest
AI & gaming convergence narrative gaining traction (Unity as infra layer)
Risk appetite rotation into small/mid-cap tech + software infrastructure plays
🧭 Bias: LONG (Momentum-Driven Breakout)
VolanX Signal Score: 79%
Risk Management:
Entry: $28.80–29.50
Stop: Below $26.50
TP1: $31.34
TP2: $39.34
TP3: $41.27
This move could evolve into a mid-term trend reversal, with $U now reclaiming its narrative and structure. Eyes on follow-through above $30. Let price validate.
📛 Not Financial Advice – For Educational Use Only
#Unity #U #BreakoutTrade #SmartMoneyConcepts #Fibonacci #LiquiditySweep #VolanX #WaverVanir #TradingStrategy #SMC #VolumeSpike #TechnicalAnalysis #TradingView
Unusual Volume Surge in $SBET — What’s Going On?NASDAQ:SBET is up 24.11% today, but the accumulation pattern seems... off. Volume looks suspiciously inflated.
Is this just a short-term squeeze or is there something deeper brewing behind the scenes?
Anyone familiar with the fundamentals or insider activity on this name? Drop insights below — curious to see what others are picking up on.
Let me know if you want:
A more technical tone (with indicators like OBV or Acc/Dist)
A follow-up chart analysis

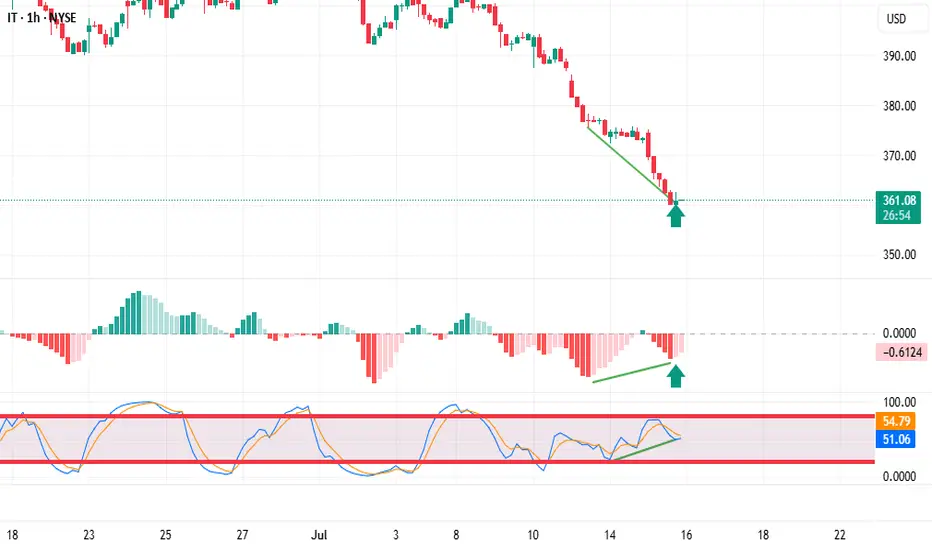
Trading stocks using Dr. Elder's "Three Screen Method"On the Weekly chart I see excellent price divergence to the MACD indicator
On the daily chart there is also an excellent price divergence towards the indicator.
The hourly chart confirms the analysis; there is also a price divergence to the indicator.
The signal for me to enter a trade is that the histogram has stopped decreasing and changed the color of the bar from red to light pink
I placed a pending order above the bar marked with an arrow, and a stop loss below it.
NYSE:IT
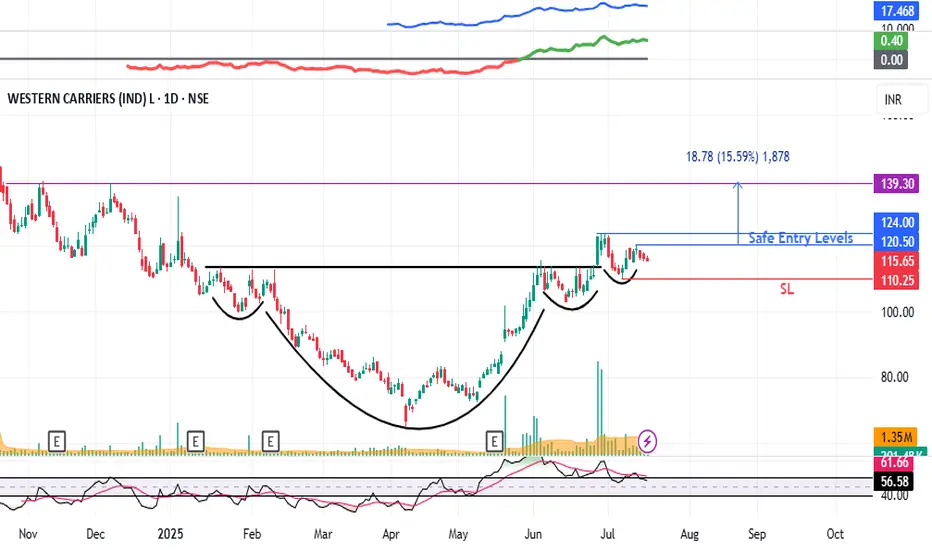
Western Carriers (WCIL) : Breakout Candidate#WCIL #patterntrading #breakout #breakoutstock #inverseheadandshoulder #swingtrading
WCIL : Swing Trade
>> Low PE Stock
>> Inverse Head & Shoulder pattern visible
>> Breakout & Retest Done
>> Ready for New Highs
>> Low Risk High Reward Trade
Swing Traders can lock profits at 10% & Keep Trailing
Pls Comment , Boost and Follow for more such Analysis
Disc : Charts shared are for Learning Purpose and not a Trade recommendation, Consult your Financial afvisor or a SEBI Registered Advisor before taking postion in it.
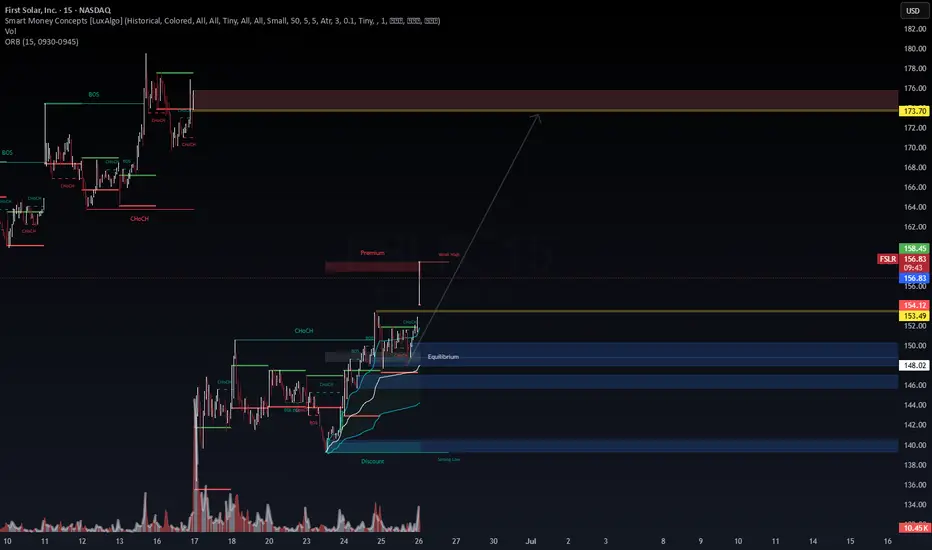
First Solar (FSLR) • 15‑min Intraday Insight | SMC + Equilibrium📊 Current price: $156.36 intraday (range: $152.58–$158.22)
🔹 Volume: Moderate–high—confirming institutional interest
🔍 Setup Overview
Structure: Multiple BOS & CHoCH transitions marking bullish structure
Equilibrium Zone📊 Current price: $156.36 intraday (range: $152.58–$158.22)
🔹 Volume: Moderate–high—confirming institutional interest
🔍 Setup Overview
Structure: Multiple BOS & CHoCH transitions marking bullish structure
Equilibrium Zone: Consolidation between ~$148–150 offering a clear base
Premium/Weak‑High: $173.70 zoned as next supply zone resistance
💡 Execution Rationale
Price broke equilibrium, now buyers hugging structure
Entry set on BOS above short-term swing (~$154 range)
Stops below equilibrium low (~$148)
Targeting supply zone at $173.70 (+11%)
🎯 Trade Plan
Long Entry: On break above consolidation high (~$158+)
Stop Loss: Below equilibrium (~$148)
Target: $173.70 (first reaction zone)
Risk/Reward: Approximately 1:2.5
Summary: First Solar is building clean intraday structure with institutional volume support. If price continues upward momentum, a move into the $173–174 premium zone seems probable.
#FSLR #Intraday #SMC #Equilibrium #SwingTrade #TradingView #VolProfile
: Consolidation between ~$148–150 offering a clear base
Premium/Weak‑High: $173.70 zoned as next supply zone resistance
💡 Execution Rationale
Price broke equilibrium, now buyers hugging structure
Entry set on BOS above short-term swing (~$154 range)
Stops below equilibrium low (~$148)
Targeting supply zone at $173.70 (+11%)
🎯 Trade Plan
Long Entry: On break above consolidation high (~$158+)
Stop Loss: Below equilibrium (~$148)
Target: $173.70 (first reaction zone)
Risk/Reward: Approximately 1:2.5
Summary: First Solar is building clean intraday structure with institutional volume support. If price continues upward momentum, a move into the $173–174 premium zone seems probable.
#FSLR #Intraday #SMC #Equilibrium #SwingTrade #TradingView #VolProfile
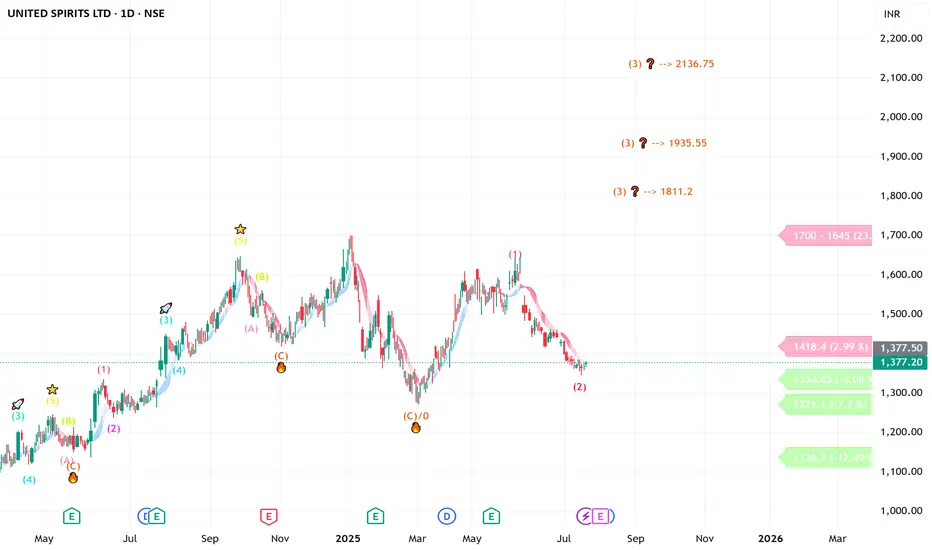
UNITED SPIRITS looking good ( short to long investment)Daily counts indicate Excellent bullish wave structure
Both appear to be optimistic and this stock invalidation number (S L) wave 2 low
target short / long term are already shared as per charts
we assume correction wave leg seems completed
Investing in declines is a smart move for short/ long-term players.
Buy in DIPS recommended
Long-term investors prepare for strong returns over the next two to five years.
one of best counter
Every graphic used to comprehend & LEARN & understand the theory of Elliot waves, Harmonic waves, Gann Theory, and Time theory
Every chart is for educational purposes.
We have no accountability for your profit or loss.
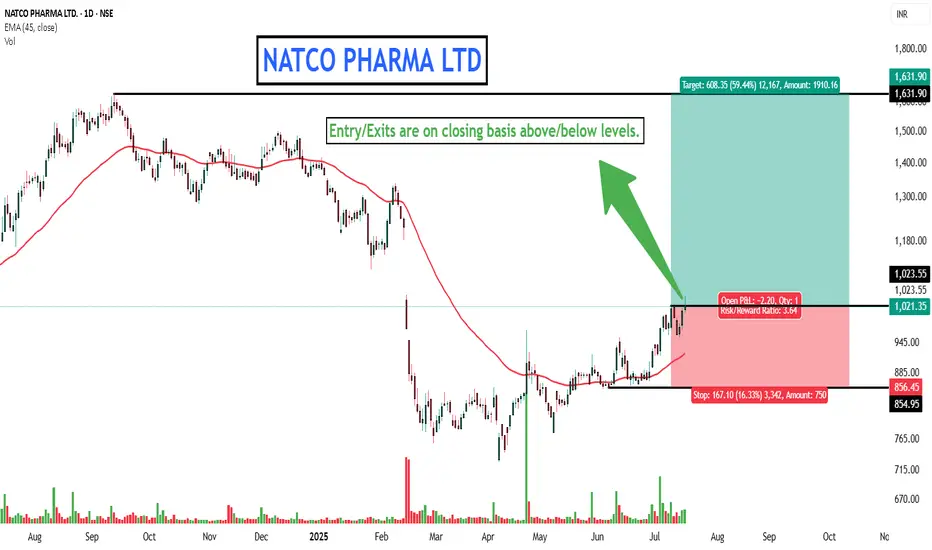
NATCO PHARMA LTD FOR YOU!Everything is pretty much explained in the picture itself.
I am Abhishek Srivastava | SEBI-Certified Research and Equity Derivative Analyst from Delhi with 4+ years of experience.
I focus on simplifying equity markets through technical analysis. On Trading View, I share easy-to-understand insights to help traders and investors make better decisions.
Kindly check my older shared stock results on my profile to make a firm decision to invest in this.
Kindly dm for further assistance it is for free just for this stock.
Thank you and invest wisely.
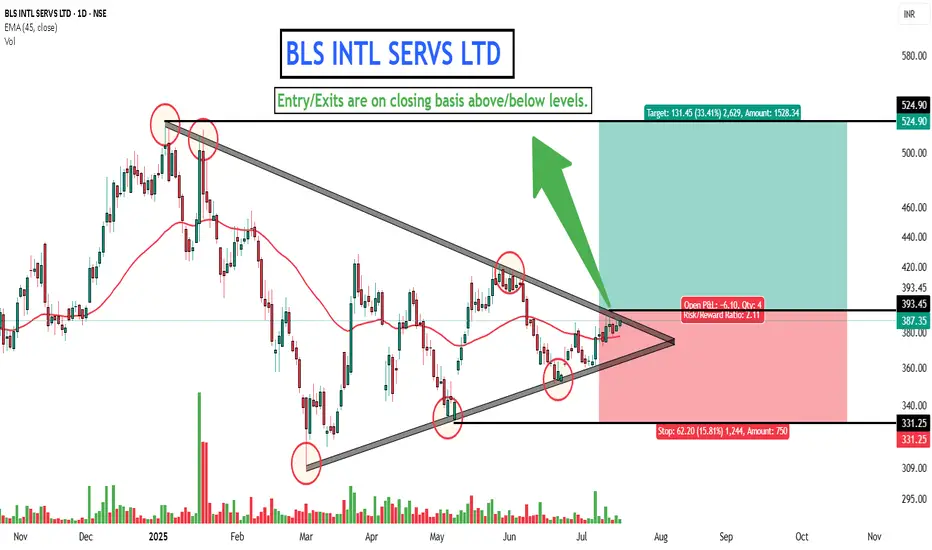
BLS INTL SERVS FOR YOU!Everything is pretty much explained in the picture itself.
I am Abhishek Srivastava | SEBI-Certified Research and Equity Derivative Analyst from Delhi with 4+ years of experience.
I focus on simplifying equity markets through technical analysis. On Trading View, I share easy-to-understand insights to help traders and investors make better decisions.
Kindly check my older shared stock results on my profile to make a firm decision to invest in this.
Kindly dm for further assistance it is for free just for this stock.
Thank you and invest wisely.
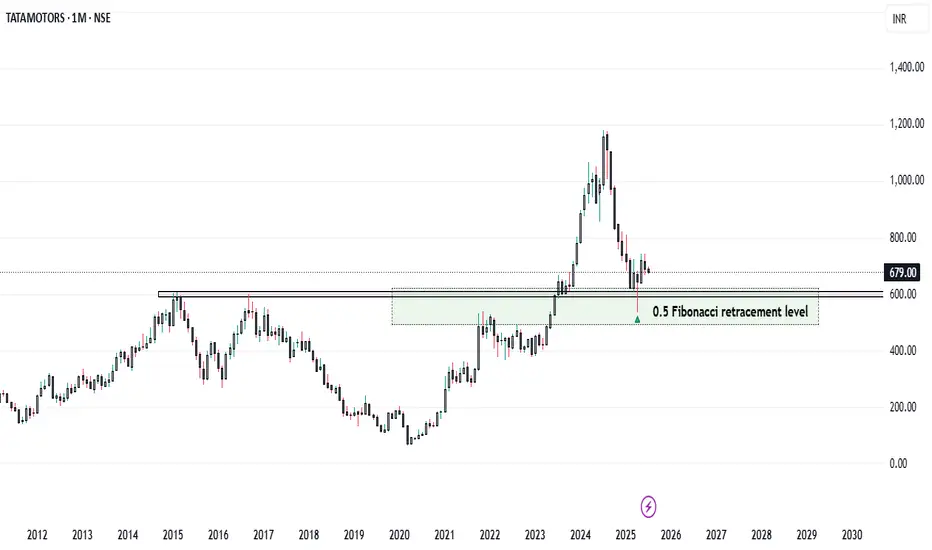
Tata Motors: From Profit Pressure to Growth Potential... Company Overview
* Name: Tata Motors Ltd.
* Industry: Automotive
* Key Segments: Passenger Vehicles (PV), Commercial Vehicles (CV), Electric Vehicles (EV), Jaguar Land Rover (JLR)
* FY25 Milestone: The Automotive business became debt-free
Q4 FY25 Performance Overview
* Net Profit: ₹8,556 crore (Down 51% YoY)
* Reason for Decline:
* High base due to deferred tax benefit in Q4 FY24
* Lower domestic volumes in PV and CV segments
* Reduced operating leverage amid falling demand
* Revenue: Marginal YoY increase (Consolidated revenue at record level for FY25)
* Positive Developments Despite Profit Decline :
* JLR Profitability Improvement
* Profit rose despite slightly lower revenue
* Supported by higher volumes and reduced depreciation
* Debt-Free Automotive Division:
* Major financial milestone for FY25 :
* Record Annual Revenue:
* Highest consolidated revenue in Tata Motors' history
* Future-Focused Investments:
* Capital allocation towards EVs, new product development, and manufacturing capacity
Strategic Growth Drivers – Reasons for Optimism
1. Electric Vehicle (EV) Leadership
* Tata Motors holds a dominant position in India’s EV market
* Plans to launch 10 EV models by 2026
* Battery Gigafactory is expected to begin production in 2026
* Strong alignment with India’s clean mobility goals
2. Expanding Product Portfolio
* Focused on SUV and ₹10–20 lakh price segments
* Upcoming launches:
* Curvv EV
* Harrier EV
* Sierra EV
* Strategy to cater to diverse customer preferences
3. Improving Financial Health
* Targeting 10% EBITDA across PV and EV divisions
* Demerger of CV and PV businesses to streamline operations and unlock value
4. Strong Base in Commercial Vehicles
* Market leader with 37.83% share in EV segment
* CV recovery is expected with infrastructure and rural demand growth
5. Supportive Macroeconomic and Policy Environment
* Government incentives: FAME II, PLI scheme
* EV-friendly policies encouraging domestic manufacturing
* Economic tailwinds: rising disposable income, urbanization, rural penetration
Risks and Challenges Ahead
* Intensifying Competition:
* Pressure from Maruti Suzuki, Hyundai, and new players
* Global Geopolitical and Trade Risks:
* US tariffs, material shortages (e.g., rare earths for EVs)
* Domestic Demand Slowdown:
* Inflation and high interest rates are affecting affordability
* Jaguar Land Rover’s Transition Challenges:
* EV transformation complexity
* Global demand volatility
* Production ramp-up hurdles
Conclusion
Tata Motors is at a pivotal juncture. While short-term profitability has taken a hit due to exceptional prior-year gains and cyclical volume pressures, the company’s fundamentals remain strong. Its leadership in EVs, ambitious expansion plans, and a now debt-free automotive business position it for long-term success.
However, realizing this potential depends on:
* Execution of its EV roadmap
* Sustained domestic demand
* Managing global uncertainties
* Staying competitive in an evolving auto landscape
Strategic Verdict:
Short-term caution, long-term confidence.
Tata Motors appears well-poised for a resilient comeback, driven by structural transformation and market-aligned growth strategies.
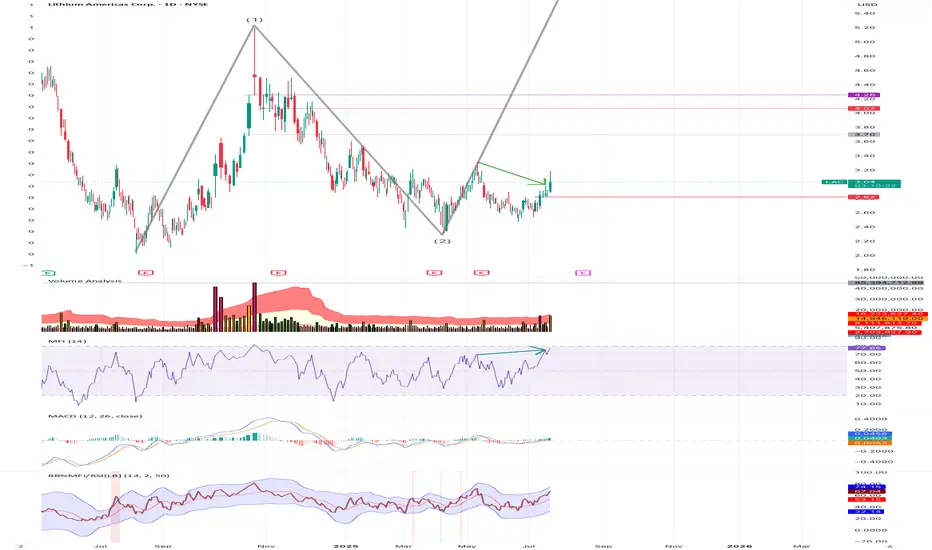
$LAC up from here: support, elliot wave, price actionI believe LAC may have begun its 3rd elliot wave, with a bottom at $2.33. There also appears to be nice recent strong base support around $2.80. In addition, there appears to be a deviation between price and money flow, as shown with the green arrows - with a potential correction available to push price beyond $3.30 very soon.
I have entered and will watch its daily action and volume with an upside expectation limit around $9-10, then a 4th wave down, etc. Of course, I am not a financial advisor and I have been wrong before and will be wrong again. I trade within this reality and control my risk.
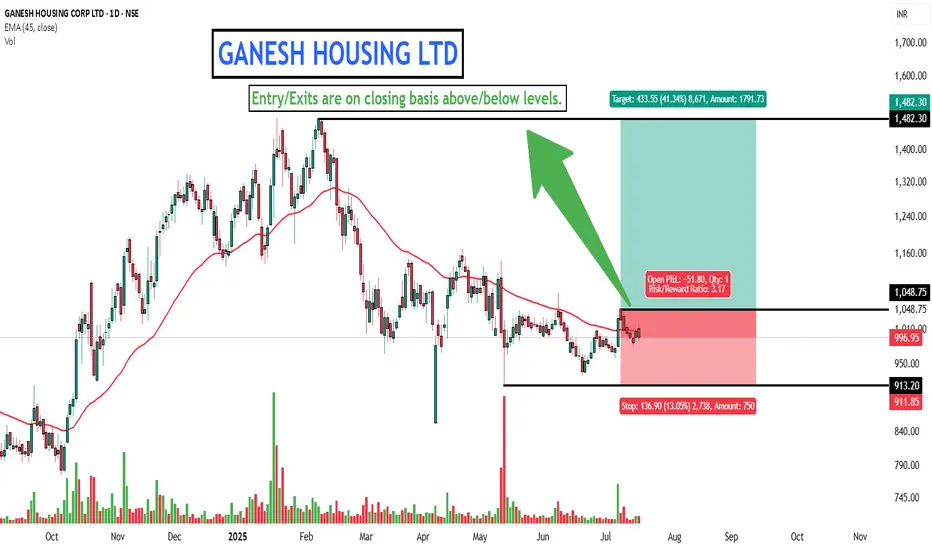
GANESH HOUSING - DON'T MISSEverything is pretty much explained in the picture itself.
I am Abhishek Srivastava | SEBI-Certified Research and Equity Derivative Analyst from Delhi with 4+ years of experience.
I focus on simplifying equity markets through technical analysis. On Trading View, I share easy-to-understand insights to help traders and investors make better decisions.
Kindly check my older shared stock results on my profile to make a firm decision to invest in this.
Kindly dm for further assistance it is for free just for this stock.
Thank you and invest wisely.