FFC Share Buying StrategyFFC Share Buying Strategy
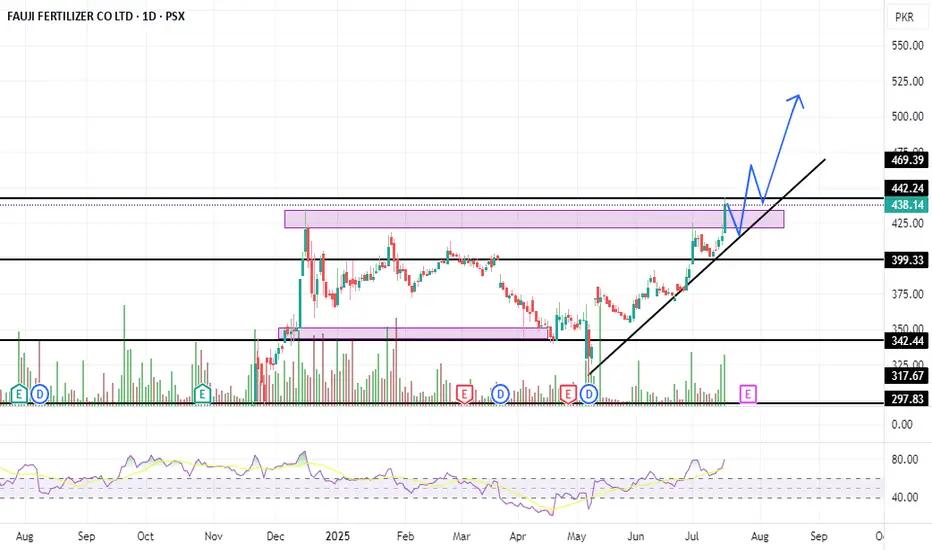
Key Buying Zone:
📍 Buy between PKR 438 – 416
Note: if tomorrow open above 442 then buy don't wait for dip
Stop Loss:
🚫 Place stop loss at PKR 399
Targets:
🎯 Target 1: PKR 464
🎯 Target 2: PKR 500
Extended Strategy:
🔒 If price sustains above PKR 500, hold the position and apply a trailing stop loss to protect profits.
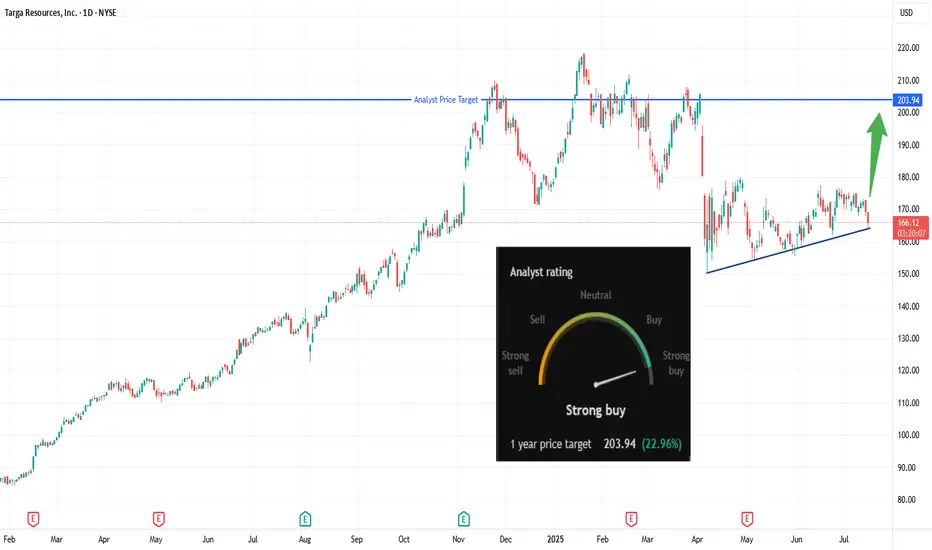
Breakout Brewing: Is TRGP About to Explode?🔹 Trade Summary
Setup:
Ascending triangle forming over several months
Price consolidating near major resistance
Strong analyst buy rating with 1-year target at $203.94
Entry:
Buy on daily close above $169.42 (breakout trigger)
Stop-loss:
Below $159 (invalidate the setup)
Targets:
$203.94 (analyst target / recent highs)
Risk/Reward:
Approx. 1:3.5 (risking ~$10 for ~$34 gain)
🔹 Technical Rationale
🔹 Ascending triangle pattern suggests bullish continuation
🔹 Flat resistance at $169.42 now being challenged
🔹 Daily timeframe, recent higher lows showing building pressure
🔹 Catalysts & Context
🚦 Analyst “Strong Buy” rating with 1-year upside potential of +22.96%
🛢️ Energy sector momentum, especially in midstream & LNG plays
📰 Potential earnings/corporate updates could drive breakout
🔹 Trade Management Plan
Entry: Buy only on daily close above $169.42
Stop-loss: Below $159 — trail up if price closes above $180
Scaling: Take partial profits at $185, remainder at $203.94 (target)
What’s your view? Are you watching NYSE:TRGP ? Comment below or vote:
🔼 Bullish
🔽 Bearish
🔄 Waiting for confirmation
🔹 Disclaimer
Not financial advice. Trade at your own risk.
*** Don't forget to follow us for more trade setups ***
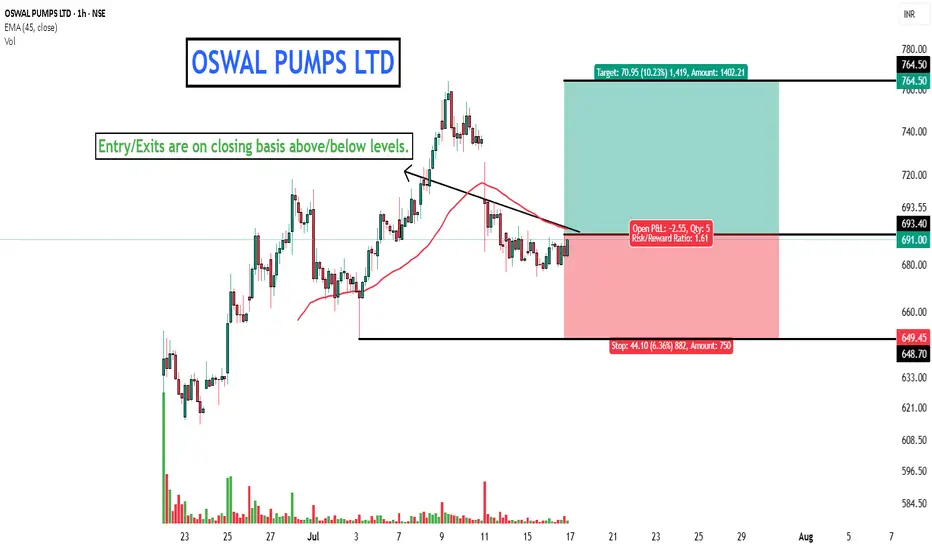
OSWAL PUMP LTD - DON'T MISS THE UPCOMING PUMPEverything is pretty much explained in the picture itself.
I am Abhishek Srivastava | SEBI-Certified Research and Equity Derivative Analyst from Delhi with 4+ years of experience.
I focus on simplifying equity markets through technical analysis. On Trading View, I share easy-to-understand insights to help traders and investors make better decisions.
Kindly check my older shared stock results on my profile to make a firm decision to invest in this.
Kindly dm for further assistance it is for free just for this stock.
Thank you and invest wisely.
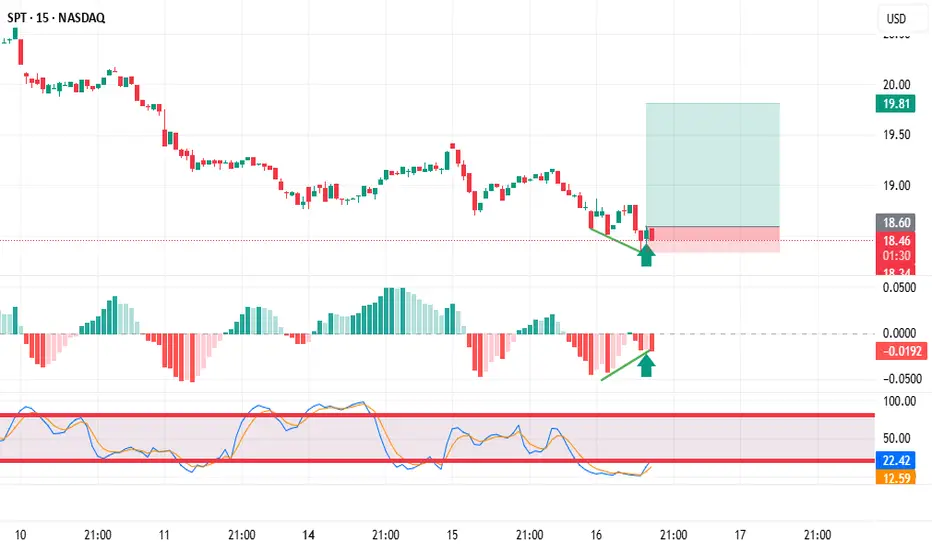
Trading stocks using Dr. Elder's "Three Screens" methodI found a great divergence on the weekly chart
Then I looked at the daily chart of this stock, and here I also found divergence.
Then I looked at the hourly chart of this stock, and here I also found divergence.
And even on the 15-minute chart I saw price divergence towards the indicators. This will be an excellent entry into a long position.
Review and plan for 17th July 2025 Nifty future and banknifty future analysis and intraday plan.
This video is for information/education purpose only. you are 100% responsible for any actions you take by reading/viewing this post.
please consult your financial advisor before taking any action.
----Vinaykumar hiremath, CMT

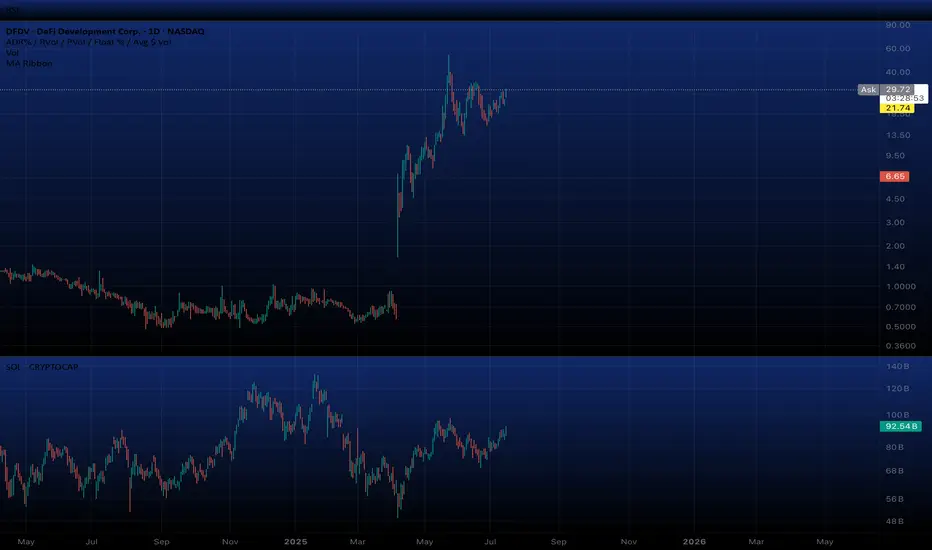
Roblox to $110I don't know much about Roblox except that my nieces play it and their gross profits are insane. Should be a pretty likely move to $110. It's currently trading at 12X revenue. My best guess is Hindenburg did a number on keeping this stock down.
Good luck if you take this trade!

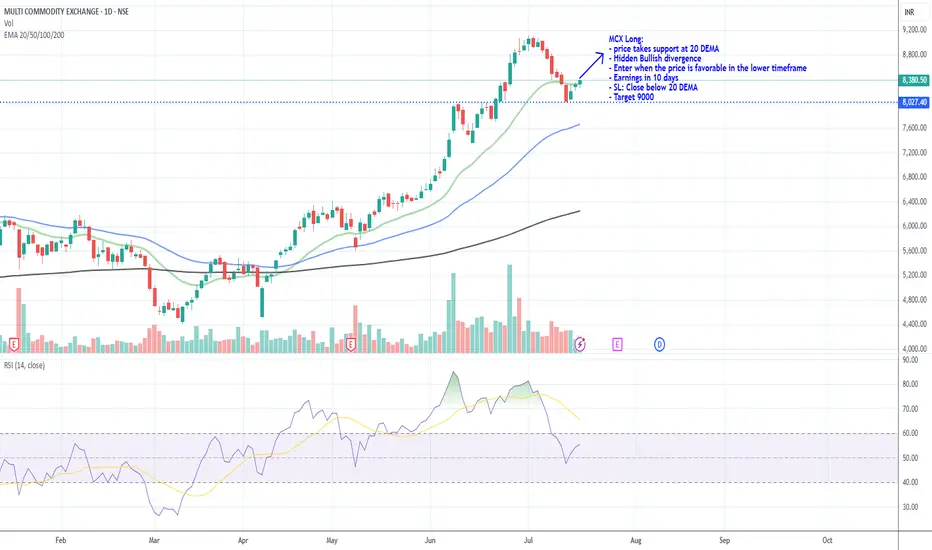
MCX Long_Support @ 20 DEMAMCX Long:
- price takes support at 20 DEMA
- Hidden Bullish divergence
- Enter when the price is favorable in the lower timeframe
- Earnings in 10 days
- SL: Close below 20 DEMA
- Target 9000
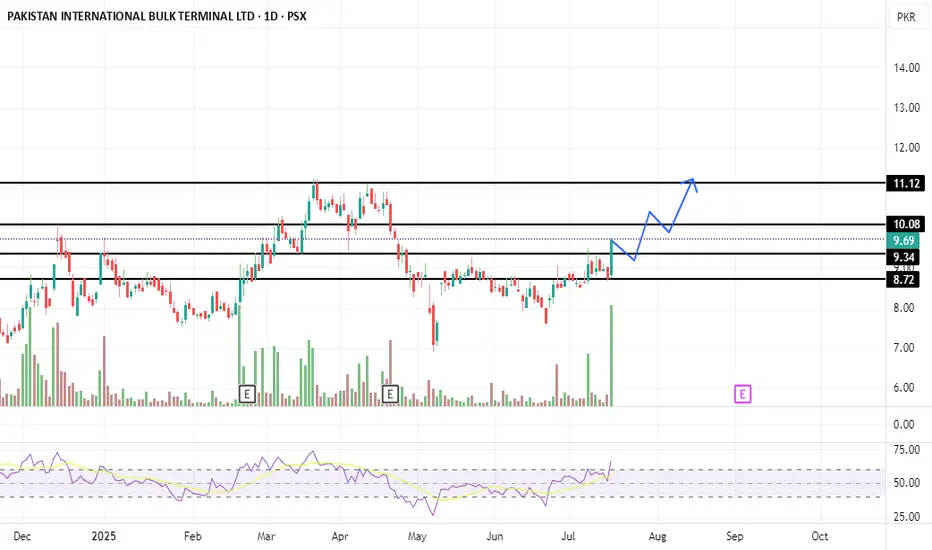
PIBTL Share Buying StrategyPIBTL Share Buying Strategy
🔑 Key Buying Zone:
Buy between PKR 9.69 – 9.34
🛑 Stop Loss:
Set at PKR 8.70
🎯 Targets:
Target 1: PKR 10.08
Target 2: PKR 11.10
📈 Extended Plan:
If price sustains above PKR 11.10, consider holding with a trailing stop loss to capture further upside.
Hidden Support on RIG: Next Big Move?🔹 Trade Summary
Setup:
Price pulling back to ascending trendline support
Testing major support near $2.58
Analyst 1-year target: $3.76
Entry:
Above today's high of $2.64 (on confirmation of bounce from trendline)
Stop-loss:
Below $2.40 (clear break of trendline)
Targets:
$3.76 (analyst price target / major resistance)
Risk/Reward:
Approx. 1:4 (risking ~$0.25 for ~$1.10 gain)
🔹 Technical Rationale
🔹 Ascending trendline holding as key support since April
🔹 Oversold bounce potential at this zone
🔹 Daily timeframe shows structure for a trend reversal if support holds
🔹 Catalysts & Context
🏦 Strong analyst “Buy” rating; 1-year target at $3.76 (+45%)
🛢️ Oil sector volatility—any rally could boost offshore drillers
🌍 Macro: Global energy demand headlines could trigger momentum
🔹 Trade Management Plan
Entry: Wait for daily close above $2.65 to confirm support
Stop-loss: Move to breakeven if price closes above $3.00
Scaling: Trim partial at $3.20, rest at $3.76 (analyst target)
What’s your view? Are you watching NYSE:RIG ? Comment below:
🔼 Bullish
🔽 Bearish
🔄 Waiting for confirmation
🔹 Disclaimer
Not financial advice. Trade at your own risk.
*** Don't forget to follow us for more trade setups ***

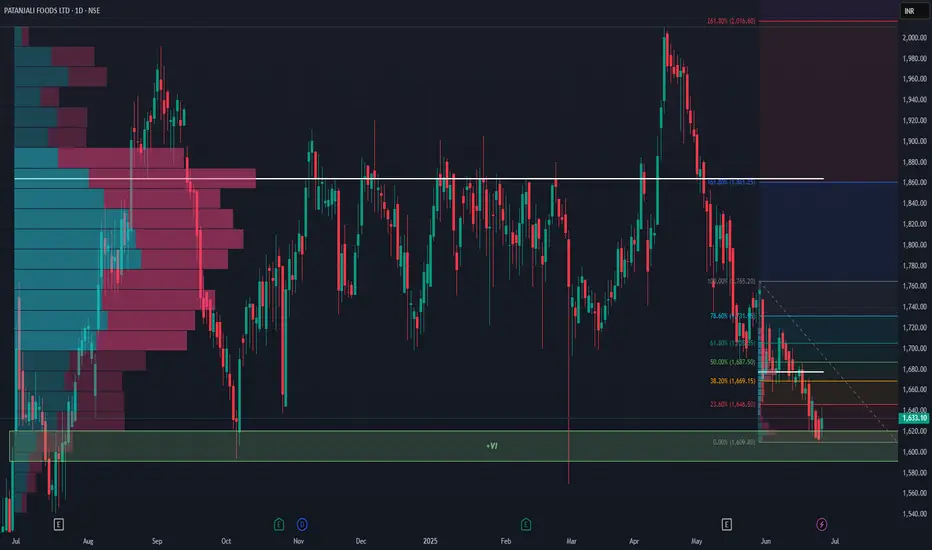
Patanjali Foods: A Potential Reversal Brewing Near Demand Zone?The price has now retraced back into a key value zone between 1,610 - 1,635, which has previously acted as a strong base. This zone also coincides with high volume activity on the visible range volume profile - suggesting accumulation interest.
Technically, the stock is near the 0% Fibonacci extension with multiple confluences of past support and volume, forming a potential base.
If this holds, look for retracement targets:
• First bounce zone: ₹1,687 (50% Fib)
• Further recovery: ₹1,745–₹1,775 (Fib 61.8–78.6%)
Long-term: ₹1,861 (161.8% Fib extension), ₹2,016 (261.8%)
Fundamentals Snapshot:
• Market Cap: ~₹58,000 Cr
• P/E: ~34x | P/B: ~3.8x
• Promoter Holding: 80.82% (No pledging)
• Debt-to-Equity: ~0.25
• ROCE: ~13.2% | ROE: ~10.4%
• FII Holding: 3.6%, DII Holding: 6.3%
Patanjali’s brand strength in edible oils, packaged foods, and growing FMCG integration offers secular demand visibility. The recent correction seems sentiment-driven, not structural.
Keep in Focus:
A decisive close above 1,660 could indicate a short-term reversal.
This chart is for educational use only and not a buy/sell recommendation.
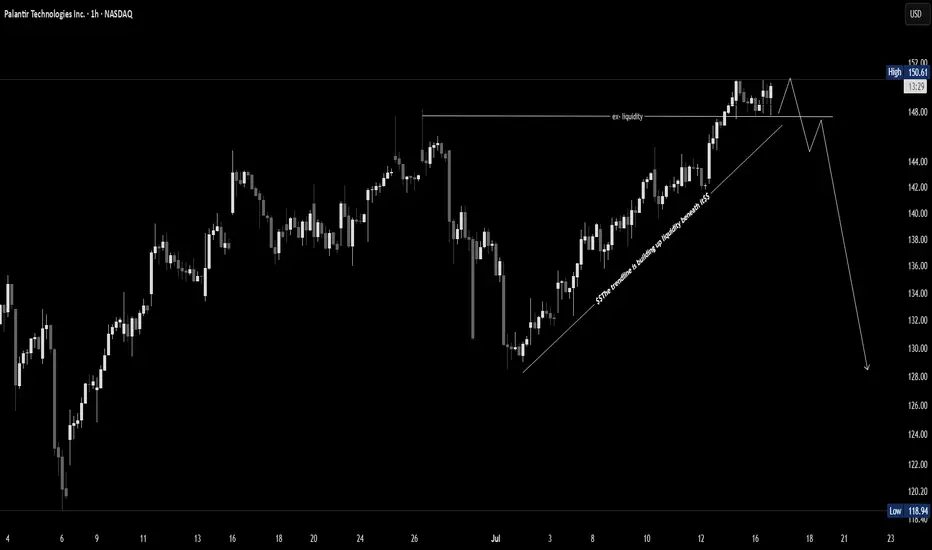
PLTR Just Broke the High - But Don't Get Trapped Palantir just broke its recent high, sparking breakout excitement. But this could be a classic liquidity grab — not a genuine breakout. If price fails to hold and shifts structure, a sharp reversal could follow.
🧠 Wait for confirmation — don’t chase green candles.
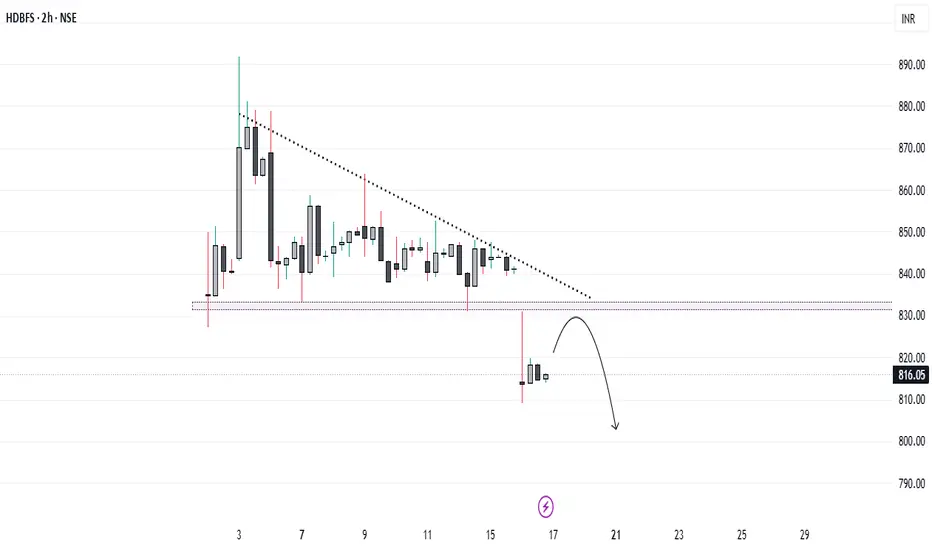
HDB Financial: Strategic Entry Near IPO Price After Breakout...!HDB Financial Services, recently listed at a 12.8% premium over its issue price of ₹740, has shown promising technical movement. After a period of sideways consolidation, the stock has broken out of a descending triangle pattern—an encouraging sign for potential downside momentum.
For long-term investors and swing traders, the ₹740 level presents a strategic entry point. This level, being the IPO issue price, is likely to act as a strong support zone. Investors looking to accumulate quality stocks can consider initiating a position near this level, with a long-term perspective or for a medium-term trade setup, depending on individual risk profiles.
ATRL buying strategyKey Buying Zone:
📍 Buy between PKR 696 – 680
Stop Loss:
🚫 Place stop loss at PKR 670
Targets:
🎯 Target 1: PKR 710
🎯 Target 2: PKR 749
Extended Strategy:
🔒 If price sustains above PKR 750, hold the position and apply a trailing stop loss to protect profits.

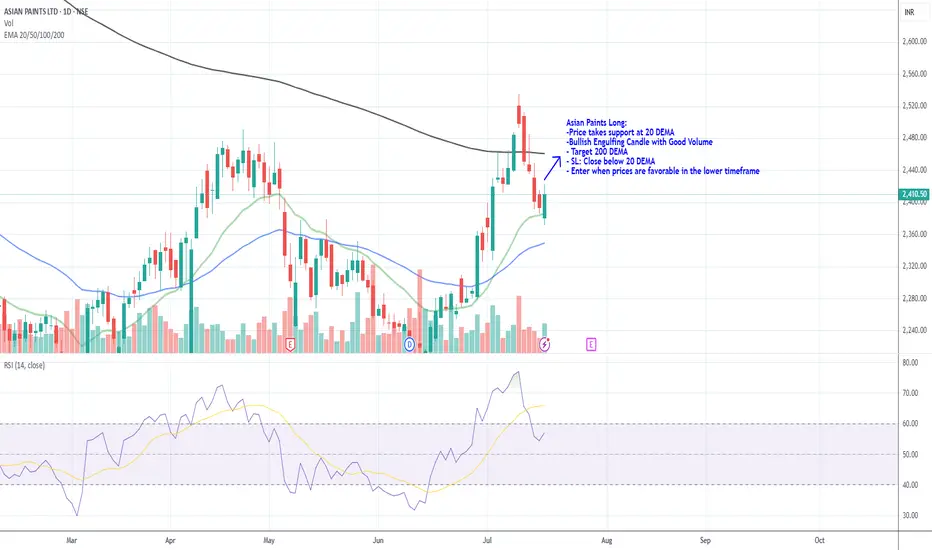
Asian Paint _ LongAsian Paints Long:
-Price takes support at 20 DEMA
-Bullish Engulfing Candle with Good Volume
- Target 200 DEMA
- SL: Close below 20 DEMA
- Enter when prices are favorable in the lower timeframe
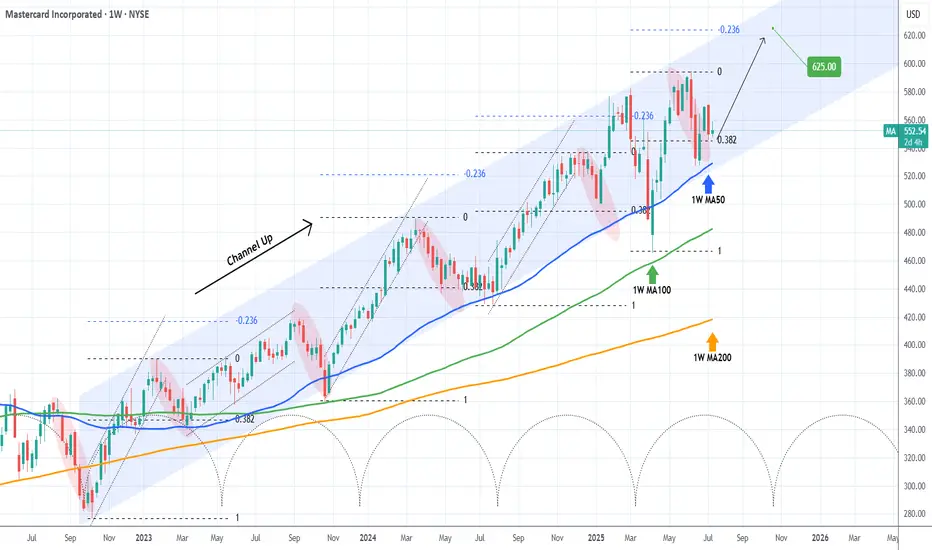
MASTERCARD Best buy entry now. Target $625.Mastercard (MA) has been trading within almost a 3-year Channel Up that only broke (but recovered naturally) during Trump's trade war. Still, the 1W MA100 (green trend-line) contained the downfall, as it always had.
Normally the Bearish Legs of this pattern tend to find Support on the 1W MA50 (blue trend-line), as the latest one did 3 weeks ago. Now that the price is trading still on the 0.382 Fibonacci retracement level, it historically is the best buy opportunity, as per all previous Bullish Legs.
The Channel Up has always priced its Higher High (top) on at least the -0.236 Fibonacci extension. As a result, we are targeting $625.00 before the year ends.
-------------------------------------------------------------------------------
** Please LIKE 👍, FOLLOW ✅, SHARE 🙌 and COMMENT ✍ if you enjoy this idea! Also share your ideas and charts in the comments section below! This is best way to keep it relevant, support us, keep the content here free and allow the idea to reach as many people as possible. **
-------------------------------------------------------------------------------
💸💸💸💸💸💸
👇 👇 👇 👇 👇 👇
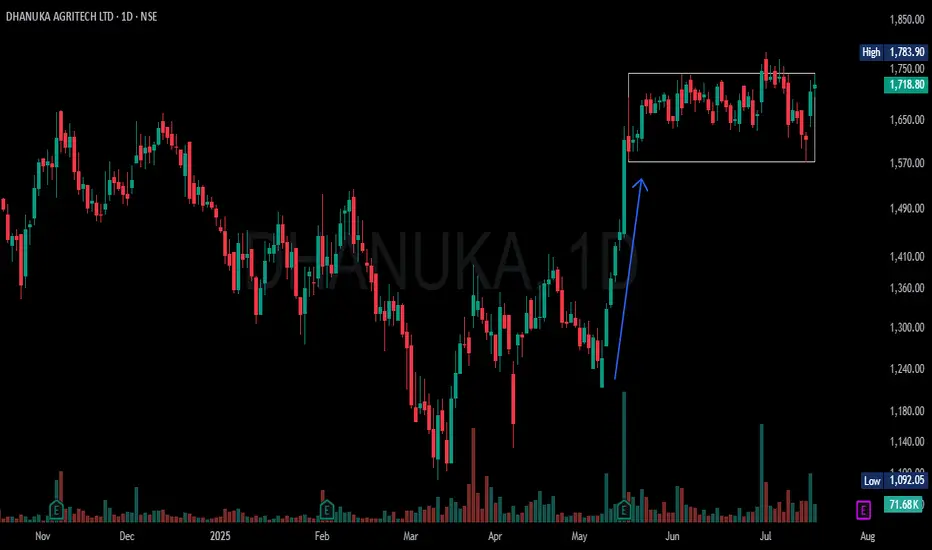
DHANUKA ABOUT TO BREAKOUTDHANUKA had a good buying in recent past and after strong buying weak hands shake off there stocks, on 14th July a rejection candle from bottom shows end of supply now there will be again good rally of buying.
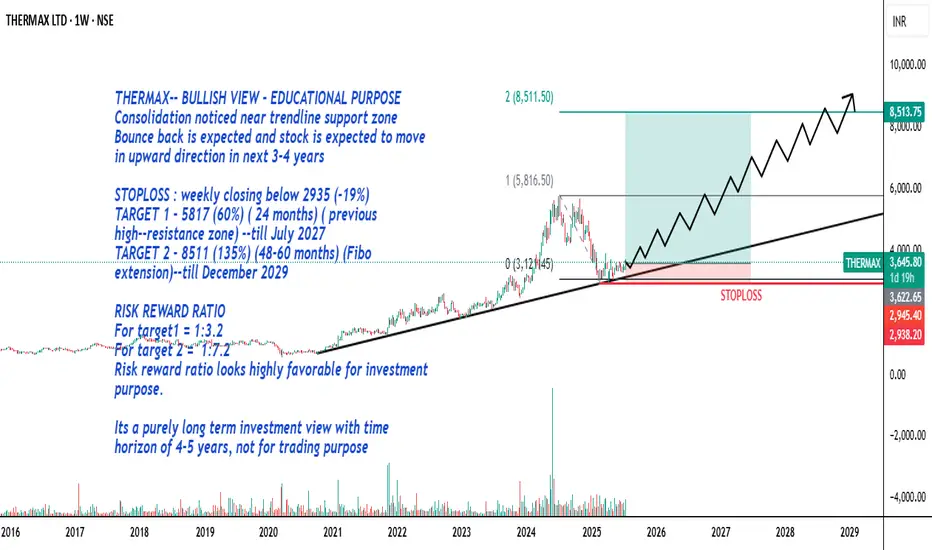
THERMAX-- BULLISH VIEW - EDUCATIONAL PURPOSE
Consolidation noticed near trendline support zone
Bounce back is expected and stock is expected to move in upward direction in next 3-4 years
STOPLOSS : weekly closing below 2935 (-19%)
TARGET 1 - 5817 (60%) ( 24 months) ( previous high--resistance zone) --till July 2027
TARGET 2 - 8511 (135%) (48-60 months) (Fibo extension)--till December 2029
RISK REWARD RATIO
For target1 = 1:3.2
For target 2 = 1:7.2
Risk reward ratio looks highly favorable for investment purpose.
Its a purely long term investment view with time horizon of 4-5 years, not for trading purpose
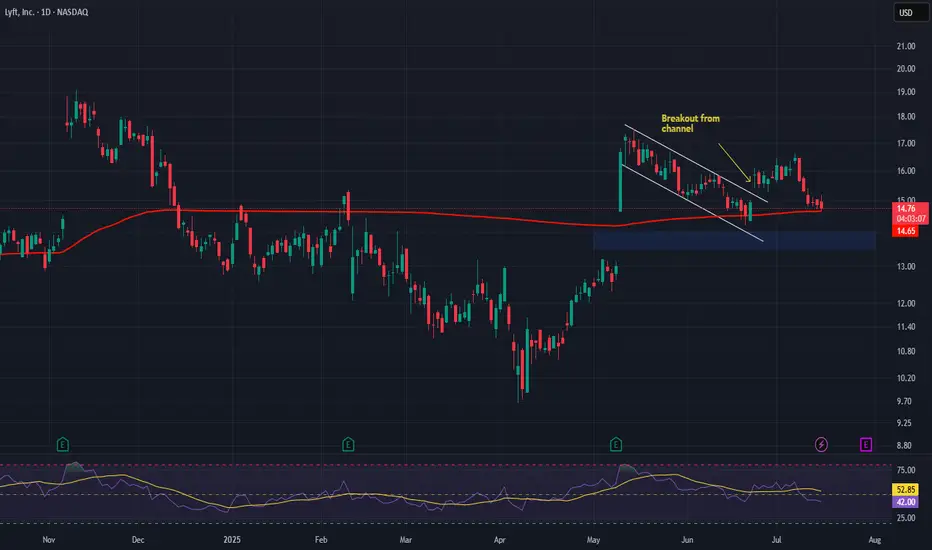
Lyft, Inc. Riding High on Subscription & Urban Mobility Growth Company Snapshot:
Lyft NASDAQ:LYFT is gaining ground with a subscription-led strategy, tech-driven cost efficiency, and a rebound in urban ride demand.
Key Catalysts:
Lyft Pink Momentum & High-Margin Revenue 🎯
The subscription model is paying off—Lyft Pink adoption is rising, improving rider retention and average revenue per user (ARPU), which boosts predictable, high-margin income.
Rebound in Active Riders 🚦
Active riders surged to 23.5M, marking the fastest growth in over two years—a sign of urban mobility normalization and broader consumer engagement.
Enterprise Partnerships & Diversified Income 🤝
New deals with Fortune 500 companies provide recurring revenue streams, diversify exposure, and expand Lyft’s footprint in corporate mobility.
Efficiency Gains & Margin Expansion 💡
Gross margin expanded 300+ bps YoY due to tech upgrades in dispatch and routing, cutting costs and lifting profitability.
Investment Outlook:
Bullish Entry Zone: Above $13.50–$14.00
Upside Target: $19.00–$20.00, fueled by rider growth, subscription traction, and operational leverage.
📊 Lyft is shifting gears from recovery to growth, with improving fundamentals and a clear path to profitability.
#Lyft #LYFT #MobilityStocks #RideSharing #SubscriptionModel #UrbanRecovery #TechEfficiency #GrowthStock #ARPU #TransportationInnovation
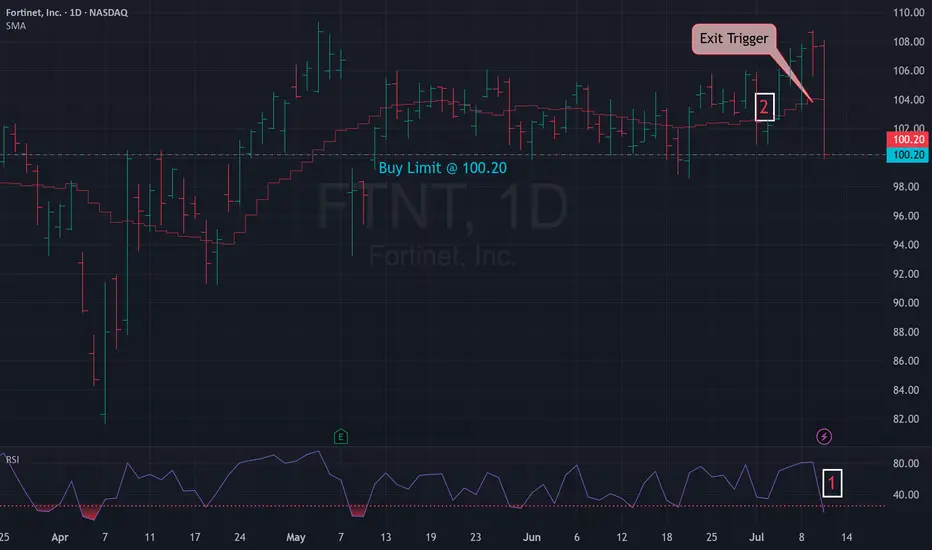
Mean Reversion Trade: FTNT1. RSI in oversold region
2. Price likely to rebound back the the mean
Trade Rules:
Entry Trigger - RSI has cross below oversold region, enter limit buy at close price
Exit Trigger - Close at market when close price cross above exit trigger (Red step line)
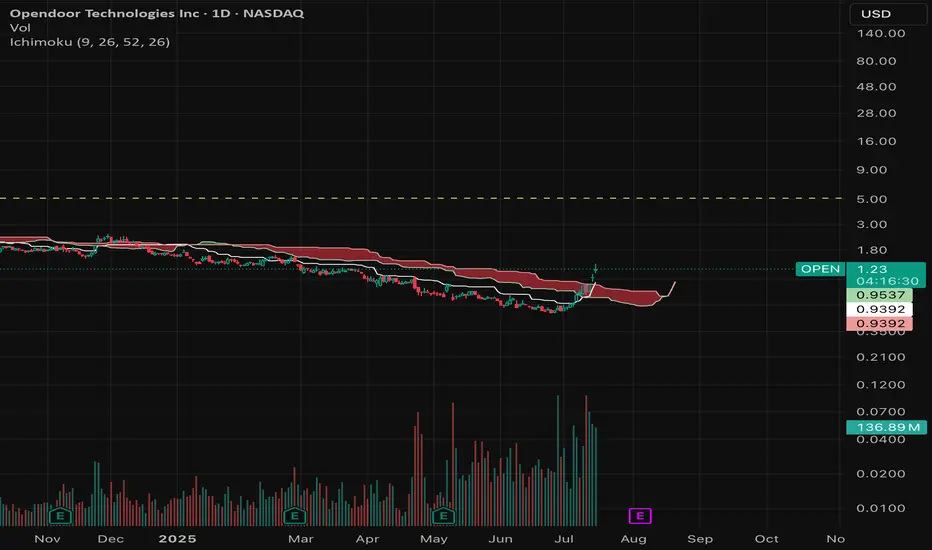
Trump firing Jerome is bullish for $OPEN - Trump firing Jerome is bullish for physical assets like real estate, gold, materials.
- Trump would most likely appoint a FED chair which will lead to lower interest rates.
- Lower Interest rates (Macro tailwinds) + Improving business model (fundamentals) + technical breakout = 🚀
Jef -- possible swing trade opportunityJef -- possible swing trade opportunity based on price action and volume patterns

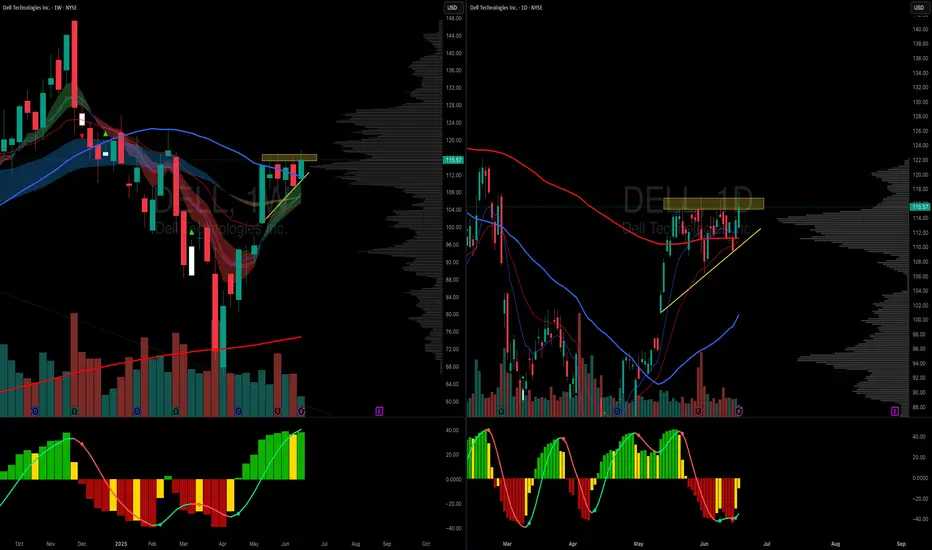
Dell, bullish, ascending triangleNYSE:DELL looks ready to go
4 weeks of tight price action with higher lows
AI infra has been hot and dell is a key player
nuff said