ATEC - NEW 52-WEEK HIGHATEC - CURRENT PRICE : 13.77
ATEC made a new 52-week high last Friday with burst in trading activity. Look at the volume pointed by red arrows. On 31 Oct 2024 there was a significant gap up with high volume, from there the stock continue rises - indicating strong buying interest. Now same scenario happens - gap up with strong volume (hint a strong bullish momentum). Take note also that there is a rising support line - indicating demand is getting higher. There is possibility that the stock may trend higher in near term.
ENTRY PRICE : 13.15 - 13.80
TARGET : 16.50 and 18.70
SUPPORT : 12.75

ARQQ: ARQQ: Pull back!
.
The market is pulling back, ARQQ is pulling back — is it a risk or an opportunity? That depends on you.
.
US STOCKS- WALL STREET DREAM- LET'S THE MARKET SPEAK!

Generational Buying Opportunity?UnitedHealth Group, a complete sh*t show of a company. The CEO gets murdered, public sentiment towards insurance companies remain at an all time low.
Is this business salvageable? Well, we now have the veteran CEO return to his former job, he was already on the board and understands the company and industry well.
Can the experienced CEO save this sinking ship? Or will all the rats on board sink, drowning investors along with it?
Nobody knows, that's the truth. And if they do know, no amount of insider buying will save the stock when the selling occurs. It could end up like Enron. I am watching the chart on this very closely. There is a potential huge reward from a return to normality for this business, that is only if you believe.
They will be able to repice their premiums later this year around September/October. Margins should improve over the long turn, this could be one big panic. It remains to be seen. For now we are in a brutal downtrend, any brave dip buyers may be rewarded only in the long term, at buying at any level between here down to $200 DCA.
Not financial advice, do what's best for you.

LCIDUSDT Ending Diagonal Near Strong DemandLucid Group continues its broader bearish move but now approaches a critical juncture with a well defined ending diagonal formation, often signaling trend exhaustion. Price action is nearing a historically strong demand zone, increasing the probability of a sharp reaction.
The trading plan is clear patiently accumulate within the projected buy zone as outlined on the chart, with focus on tracking price movement along the mapped reversal path. The setup presents a potential high reward-to-risk opportunity targeting the main sell-off resistance area, where major decisions will be reassessed.
Watch price closely as the ending diagonal matures. A strong bullish reaction could mark the start of a mid-term reversal phase.
📍 Drop your stock requests in the comments for quick technical updates only US stock assets will be analyzed under this post.

TSLA: Here is what I see in TSLA"Zoom In. Follow the Sequence."
Just analyzing sequential wave patterns across multiple timeframes.
You can zoom in and see how structure evolves — impulse, correction, then continuation.
Maybe there’s a strategy here that repeats. Maybe not.
But if there is... it’s worth finding.

learn how to read and use Angle of Descent
Angle of Descent is the inverse of Angle of Ascent. However, the downtrend runs faster and steeper than the uptrend. WHY? Because the uptrend builds on uncertainty and doubt from retail groups, while Dark Pools and professional traders buy quietly with the that the stock is at bargain prices and will resume and uptrend. Their buying creates the bottoms and nudges price to the upside. Their activity provides near term price direction for YOU to trade shortly after the Dark Pools have accumulated and when pro traders nudge price upward anticipating and setting up for HFT gap ups and smaller funds VWAPS chasing the HFT gaps.
Angle of Descent will always be faster, steeper and end abruptly as prices for shares fall well below the fundamental levels.
Studying the indicators that professionals use that indicate extreme selling helps you avoid getting into a sell short that whipsaws causing huge losses. When the Dark Pools start to trigger and buy, they are often buying stocks that retail day traders are trying to sell short.
Retail traders often lack an understanding of who controls price.
When a stock falls sufficiently below its fundamental values, Dark Pools will start buying in a slow steady TWAP Time Weighted at Average Price, creating a Buy Zone that can be seen on the stock chart if you know what to look for. That is your warning signal not to try and sell short.

MSTR: Dual Support Test - 200 SMA & Trendline Hold… for NowMSTR (MicroStrategy) is now testing a key technical zone that combines dynamic trendline support and the widely-followed 200-day simple moving average (SMA). These two indicators have provided critical inflection points for the stock over the past year - and we’re back there again.
The current pullback may offer a pivotal bounce opportunity if buyers step in at this technical confluence.
Technical Highlights:
Long-term trendline (from early 2024) continues to hold as support.
200-day SMA has triggered rebounds multiple times, aligning closely with the trendline.
Price action is compressing into a narrowing zone - watch for resolution.
A clean break below may signal deeper correction; holding here keeps the bull case alive.

$TSLA: Branching Effect🏛️ Research Notes
Reaching branching effect through cross-cycle interconnection. Alongside I'll test some elements mentioned below.
Local Progressions
Rhyme and levels derived from apparent cycle compression.
Added channels with darkening gradient that cover bullrun from mid 2019, driven by angle of tops.
In the local scope, as price deepens into denser zone the probability of disproportional reaction gets higher. t would probably complete its intermediate and even longer-term cycles before escaping the boundary.

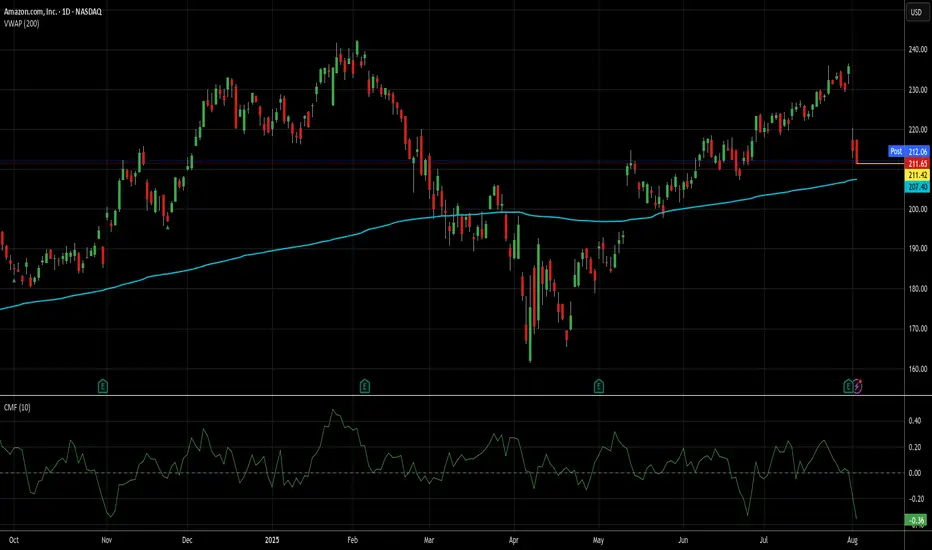
Not a perfect setup, but it's AMZN, so I'm in at 211.65.It may be a touch early to take this trade, but I"d always rather be early than late on AMZN trades. This particular setup isn't exactly like the first 2 ideas I posted about AMZN, but it's been very profitable in general, even if it hasn't done that well on AMZN recently. That said, results of trades tend to mean revert just like stocks usually do (at least mine do).
Since the beginning of 2024, there have been 45 signals for AMZN using the method I'm using today. 43 of those produced wins, while 2 are open and losing (down 12% and 8% respectively). I'm not worried about those 2, because over the long haul, those losers eventually become winners almost 100% of the time, it's just a question of how long it takes.
I just closed a RDDT trade today that's been open since Valentine's Day (see my ideas for details on that) that when tactical DCA and quick closes of them were factored in, made 6x the long term average daily return for stocks while RDDT only went up 3%. AMZN has a longer, better track record of recovery than RDDT, so I'm not even a little worried about my money here.
The average gain and trade length over these last 19 months has been kind of spoiled by those losers and a couple of other lots that took a long time to close and made almost nothing. The average trade here took just under 13 trading days and yielded only about 2.26%. That's not great for me, but a) it's still a daily rate of return (.178%) about 4x the long term average of stocks, and b) 75% of the trades produced an average daily return better than that.
Additionally, AMZN is still above its 200d VWAP and money flow is at its lowest levels since November. While not perfect, low money flow levels in a stock like AMZN does a pretty good job of, if not picking a short/med term bottom, usually getting you closer to it than not.
71% of these trades closed in a week or less, so that is my goal here. If it's longer than that and AMZN throws off another buy signal, I will add accordingly, though additional lots will be exited at the first available profitable close.
As always - this is intended as "edutainment" and my perspective on what I am or would be doing, not a recommendation for you to buy or sell. Act accordingly and invest at your own risk. DYOR and only make investments that make good financial sense for you in your current situation.
RXRX Collapse or Comeback? Watch This Zone
### 🧬 RXRX Options Flow Exploding Ahead of Earnings — \$6 Call Setup Heating Up! 🚀
📅 **Week of August 4, 2025**
📈 **Sentiment:** Moderately **Bullish** (Call/Put Ratio: **8.73**)
💡 **Trade Setup:**
* 🎯 **Buy RXRX \$6.00 Call (08/08 Expiry)**
* 💵 **Entry:** \$0.30
* 🎯 **Profit Target:** \$0.60 (100% return)
* 🛑 **Stop Loss:** \$0.15
* ⚠️ **Confidence:** 65% (Earnings on 08/08 = Binary Risk)
🧠 **Why It’s Viral-Worthy:**
* 🔥 **Insane Call Activity** despite weak volume — institutions positioning early?
* 📉 **Daily RSI:** 48.1 (falling)
* 📈 **Weekly RSI:** 48.7 (rising)
* 📊 **Volume:** Weak (0.6x previous week)
* 🧨 **Gamma Risk:** Moderate with 4DTE
---
### 📌 Strategy Summary:
> **"Big options flow with weak volume is like a loaded spring—wait for the pop or drop."**
> Watch for a clean break over \$6.00 on volume at open. Use tight risk control. 🚦
---
### 🔖 Tags for Reach:
```
#RXRX #OptionsFlow #UnusualOptionsActivity #BiotechStocks
#TradingView #CallOptions #SwingTrade #GammaSqueeze
#EarningsPlay #MomentumTrade #HighRiskHighReward
```
---
💬 *What’s your take? Will RXRX run before earnings or stall on weak volume?*
📊 Drop your chart in the comments ⬇️

NVTS Tight Coil Before Earnings## ⚡️ \ NASDAQ:NVTS WEEKLY TRADE IDEA (AUG 5–9)
**🔥 STRONG BULLISH FLOW | CALL/PUT: 5.24 | EARNINGS INCOMING**
---
### 🔍 SENTIMENT SNAPSHOT
* 📈 **Daily RSI**: 59.2 — Bullish
* 📅 **Weekly RSI**: 71.4 — Strong momentum
* 🔻 **Volume**: 0.7x — Weak institutional follow-through
* 🔔 **Earnings Risk**: HIGH — Earnings expected Aug 5
* 🧠 **Model Consensus**: Bullish, but cautious on binary event
---
### 💡 TRADE SETUP
| 🔹 | Trade Type | Long Call |
| -- | -------------- | --------------- |
| 🎯 | **Strike** | **\$8.50** |
| 📅 | **Expiry** | **Aug 8 (Fri)** |
| 💵 | **Entry** | **\$0.55** |
| 📈 | **Target** | **\$1.50** |
| 🛑 | **Stop** | **\$0.30** |
| 📏 | **Size** | 1 contract |
| ⚖️ | **Confidence** | 70% |
---
### ⚠️ TRADE NOTES
* 🚨 Earnings volatility could create gaps — plan around Aug 5
* 📉 Low volume = reduced follow-through risk
* ⏰ Very short expiry = high gamma exposure
---
### 🧩 STRATEGY CONTEXT
> “Momentum is real, but earnings are the wildcard. Size light. Stay nimble.”
📍 Enter: At market open Monday
🔍 Watch: Post-earnings price action + volume spike
📊 Manage: Tight stop, scale out if it rips pre-earnings
---
💬 Playing NVTS this week?
🔥 Comment “NVTS” if you’re watching this setup
🔁 Repost if you’re riding earnings momentum

TSLA LONGAccumulating tesla shares - $300 is a very interesting area for TSLA, Looks like as long as we hold this area we should see $500 by end of year... much sooner.

HEROMOTOCO | Buy @4444 | Strict SL below 4200 | Target 5400Disclaimer:
This is not financial advice. Please do your own research or consult with a financial advisor before making any investment decisions. Investments in stocks can be risky and may result in loss of capital.

Sydney Sweeney and American EagleWe had an outbreak on the internet.
Jeans or genes?
A seemingly outlandish debate regarding a seemingly insignificant commercial during a time NYSE:AEO is at its historical low in recent years.
Now #Trump is appraising #Sydney after he learned that she is a registered Republican.
Coincidence? I think not.
Here is what I think how it happened:
NYSE:AEO management team looked at their stock price, and went "huh. we gotta do something about this. Our company is failing". What's the secret to a success retail store?
Exposure. Attention. Publicity.
What could be better than the cultural slash between Woke movement and its counterpart? NONE.
For whatever backlash it has, it's one of the most successful marketing campaign for retailers this year. Now almost everybody is talking about it. Whether you have visited an NYSE:AEO store or not, now it is the first one on your mind when you think of clothing companies.
And for those up against NYSE:AEO , they don't appear to me as the target audience to $AEO.
Internet fuzz like this cannot be understimated, especially for a company with around $1B market cap.

Hims taking some off here I hope i'm wrong, but i took off about 50% of my position. I'm bearish short term, healthcare stocks just getting wrecked left and right. I'd add back in the green horizontals if tested in the 36-32 range. The Hims position has run up a little too much in size than I'm comfortable with, happy to take some off here. Good luck to everyone playing earnings.

Trend Reversal Confirmed: SEARL Targets 129+SEARL on daily timeframe displays a classic inverse head and shoulders pattern, which is a strong bullish reversal signal. The stock has broken out of the neckline resistance with healthy momentum and is now consolidating above it, indicating strength and potential for a continued uptrend. The breakout also coincides with a falling trendline breach, adding further confirmation to the bullish sentiment. Key resistance levels to watch on the upside are 107.95, 113.30, and 119.00, with the ultimate supply zone target around 129.32. The curved projection suggests a gradual upward move, and any pullback toward the trendline may offer a good re-entry opportunity for long positions.

Warren Buffet and UPSHello I am the Cafe Trader.
There have been some wild days, and it's not over. Amidst all the stormy seas, and the major successes, I wanted to bring to your attention a stock that I think is becoming of great value.
UPS has been getting beat down for over three years, why?
Beatdown
- Trump Tariffs contributing to China slowdown. (35% of deliveries comes from China).
- Guidance downgraded due to uncertainties with the macroglobal scale, "spooking investors".
- UPS cutback dealings with amazon to increase profitablity (but also reducing volume and revenue.)
Just to name a few...
If such bad news, why buy?
Fundamentally their business model is strong, and the dividend is PAYING.
Dividends and Warren Buffett.
Buffett is still known to use a model by his mentor, Benjamin Graham. (if you don't know, take a little youtube shallow dive).
This has been used to build a large portion of how buffet evaluates a stock. Using his formula, the Maximum intrinsic value of UPS is $69.87
As of writing this article, UPS sits roughly 21% higher than that number. If we get close, even the fundamentalists may have a hard time passing this up.
Dividends
At 1.68 Dividend a quarter, that put's UPS at almost 7.91% yield!
So my thought process is; even if you lose 8% from Graham's buy price, you make up on the dividend in a year. (although I would be surprised if it touched that golden zone).
TLDR LONG TERM
Aggressive buy: $88 (we are below that right now)
Great Price: $75.50 - 80.50
Graham's STEAL: $71 or Below.
NOTE: Graham took other things about a stock into consideration as we, as you should as an investor. This article is meant to assist your own DD.
-Since this is charted on a weekly chart I have charted a probable 4-6 month swing. (almost 50% gain).
-It really does depend on where this bounces, we have already broke through some major levels.
-I have a feeling UPS drivers might be cashing out their 401k and panic selling.
That's all for UPS!
I hope you enjoyed the article, thank you for your time.
If you enjoyed please consider a follow and a boost!
@thecafetrader

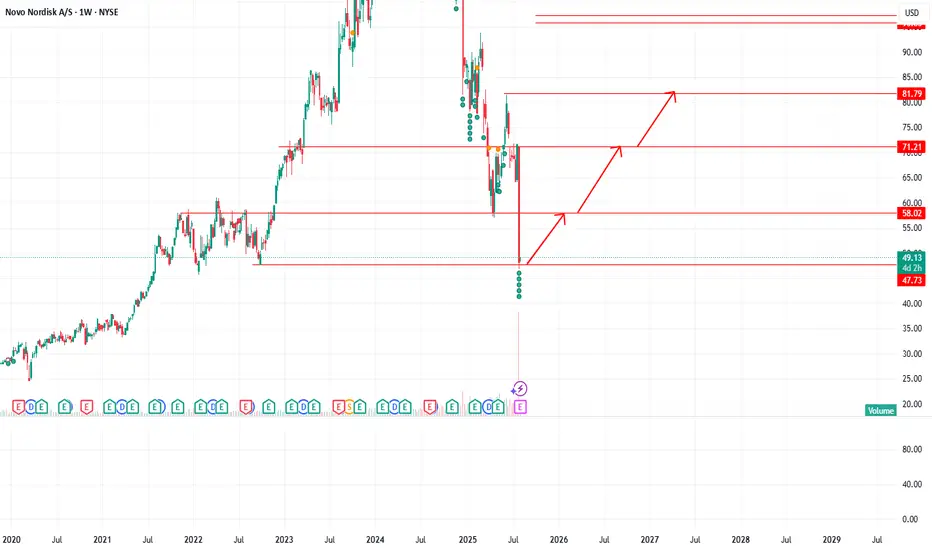
NVO Weekly Chart AnalysisNovo Nordisk (NVO) recently saw a sharp drop with heavy volume, signaling strong selling pressure. The chart shows a potential recovery path if the stock holds support near $47.
🔄 Possible rebound levels:
First target: $58
Mid target: $71
Final target: $82
📊 Options flow shows strong call activity (bullish bets), with a low put/call ratio, suggesting some traders expect a bounce. However, momentum is still weak, and if $47 fails, further downside toward $36 or lower is possible.
AMD and NVDA: First week of August My thoughts and opinions!
Hope you find it informative and as always, safe trades!

AMD eyes on $178: Serious Resistance zone that may give a DIPAMD bouncing back from market wide dump last week.
Approaching a significant resistance at $177.79-178.59
Look for a Dip-to-Fib ideally to green at $163.30-163.61

MLM heads up at $613.37: Golden Genesis fib may STOP the SurgeMLM had news of acquisition and a partnerhip.
It has just hit a Golden Genesis fib at $613.37
Look for a Dip-to-Fib or Break-n-Retest to join.
Previous Analysis that caught the BREAK OUT up to this fib:
Hit BOOST and FOLLOW for more such a PRECISE and TIMELY charts.
==========================================================
.

I'm ready to size up TTDIf you've been following me you know i've got TTD at a good price. I'm ready to size up position if we get a sell off in the next few weeks. The 9 take profit is coming up, sell could come sooner, but i'm looking for a test of previous levels (green horizontals) before the next leg up. I also continue to passively DCA into this.

Bearish Pennant & Long Term Bearish DivergenceBearish pennant formed and sharp bearish divergence on the RSI, Elon personally receiving billions from the pockets of the company. This alludes to possible instability on the inside, despite being up a significant amount this year. Companies are like icebergs, cracks on the surface run deep, negative information is repressed.
In my opinion, a drawdown of over 25% seems in order
