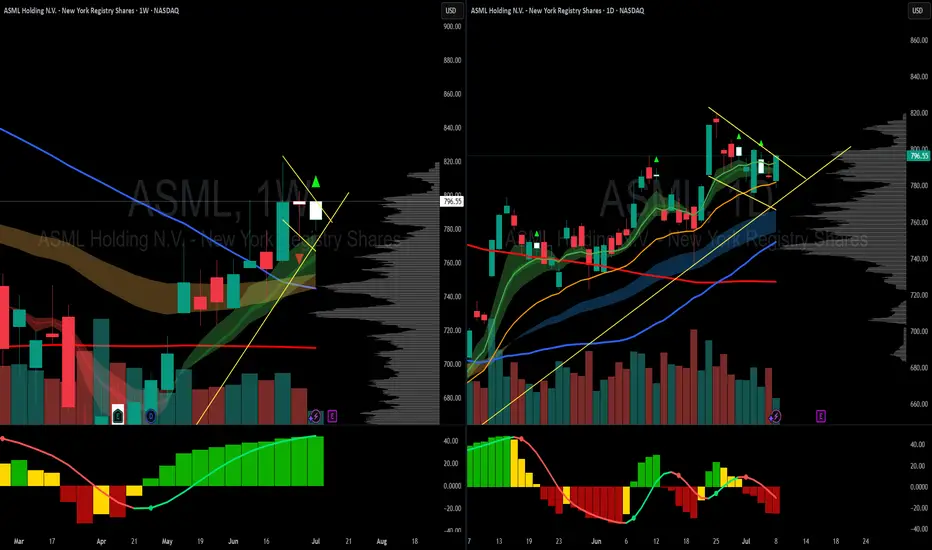
ASML looks readyNASDAQ:ASML looks ready to go with a bull flag and a double inside week, semis are strong as a sector and it is a monopoly business... pretty good long term hold also
Tesla earnings setup favours upsideTesla is scheduled to report its second-quarter results on Wednesday 23 July, after the New York close of trading. The company is forecast to report revenue of $22.8bn, representing a 10.5% year-on-year decline, with earnings expected to decrease 19% to $0.34 per share. Gross profit margins are also anticipated to contract by 2.3 percentage points to 16.4%, down from 18.7% last year.
Tesla does not provide traditional guidance but instead offers a business outlook. In its first-quarter release, the company noted difficulties in assessing the impact of shifting global trade policies and stated it would revisit its 2025 guidance during the second-quarter update. Consequently, investors will undoubtedly be focused on any insights regarding 2025 delivery forecasts, especially given the weak performance in the first half of 2025.
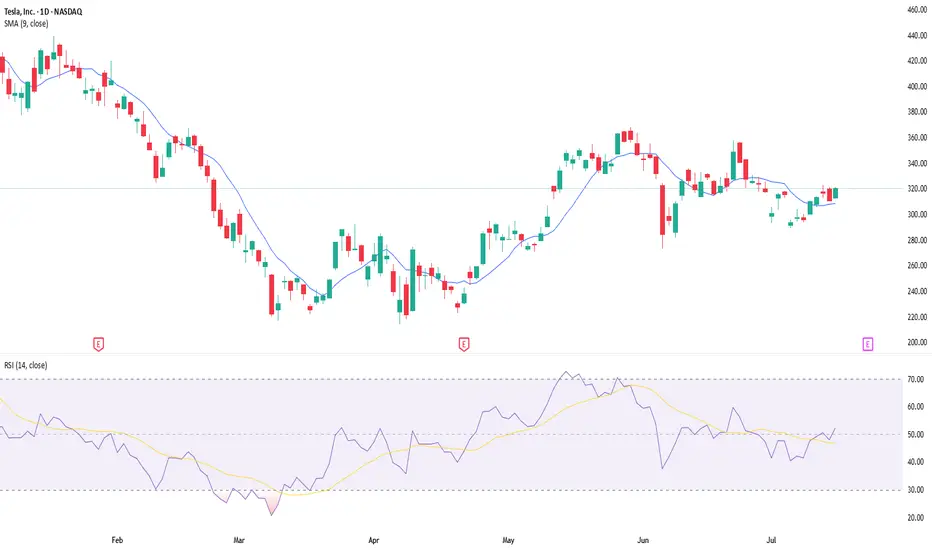
Given the current uncertainty, the market is pricing in a 7.5% rise or fall in the shares following the earnings release. Options positioning is relatively neutral, with only a slight bullish bias. However, there is significant support for the stock between $280 and $300, marked by substantial put gamma levels. Conversely, resistance from call gamma exists between $325 and $330. This setup suggests that it could be easier for the stock to rise rather than fall following the results.
The technical chart clearly illustrates this scenario, highlighting strong support around $290 that dates back to March. More recently, the shares have encountered resistance around the $330 mark. If Tesla can successfully break above this resistance, the stock could move towards approximately $360, while downside seems limited to around $290 to $300.
Written by Michael J. Kramer, founder of Mott Capital Management.
Disclaimer: CMC Markets is an execution-only service provider. The material (whether or not it states any opinions) is for general information purposes only and does not take into account your personal circumstances or objectives. Nothing in this material is (or should be considered to be) financial, investment or other advice on which reliance should be placed.
No opinion given in the material constitutes a recommendation by CMC Markets or the author that any particular investment, security, transaction, or investment strategy is suitable for any specific person. The material has not been prepared in accordance with legal requirements designed to promote the independence of investment research. Although we are not specifically prevented from dealing before providing this material, we do not seek to take advantage of the material prior to its dissemination.
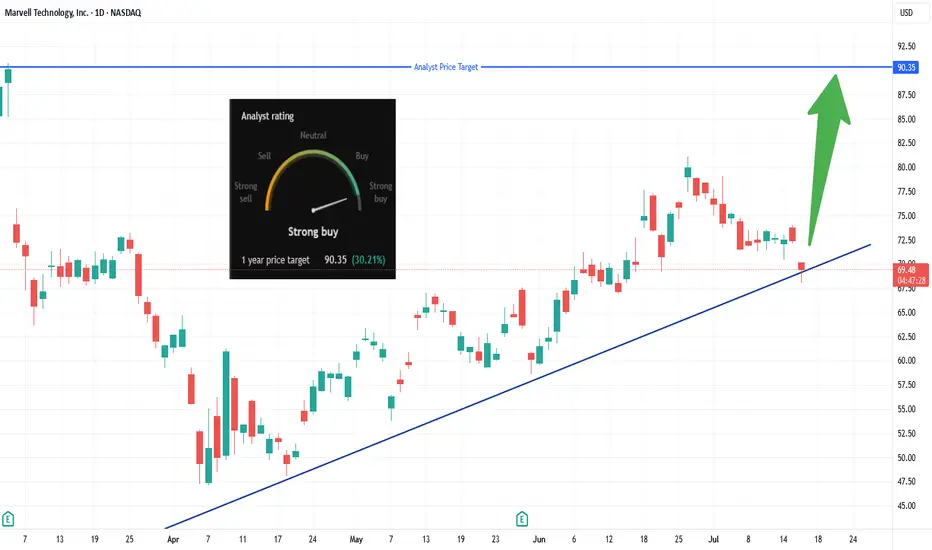
MRVL Long Breakout Setup, Eyes $90 Target!Looking to enter long on a clear breakout above $70.13 (today’s high).
• Entry: Above $70.13
• Stop-Loss: Below today’s low (~$68.50) to protect capital
• Target: $90.35 – per analyst consensus (~+30%)
✅ Why:
📈 Trendline bounce & momentum: Price holding strong above an ascending trendline from April suggests buyers are stepping in.
🏢 AI-chip catalyst: Marvell’s custom ASICs are gaining traction with Amazon, Microsoft, and Google—data-center demand is surging.
💰 Analyst confidence: Consensus is “Strong Buy” with average targets between $90–$94 (some as high as $133).
🧩 Market & Sector Tailwinds: AI chip stocks rallying; Marvell poised as lower-cost custom-chip alternative to Nvidia—and undervalued vs peers.
*** Be sure to follow us for more trade setups! ***
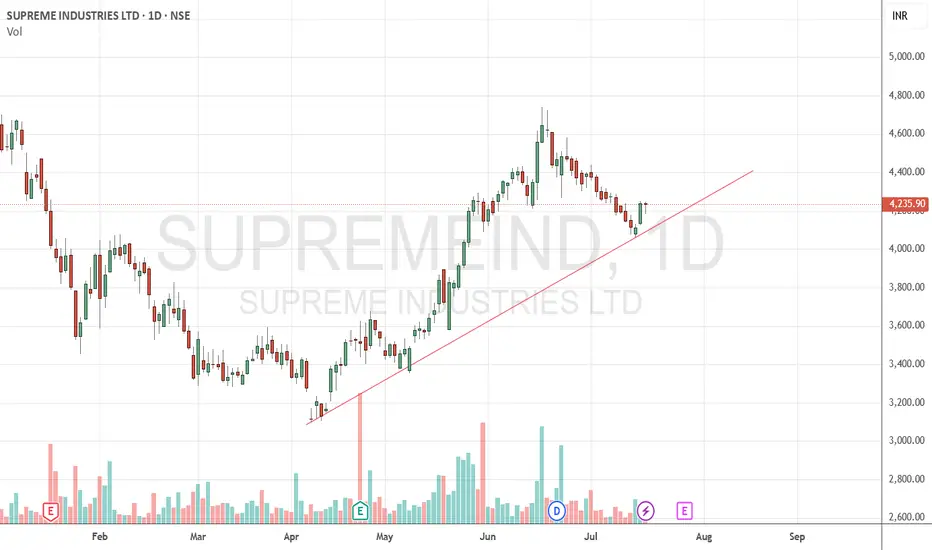
Supreme Industries BuySupreme Industries seems to take support from trend line. Buy @CMP (4236) with SL of 4060 and Target of 4400, 4700 & 5150
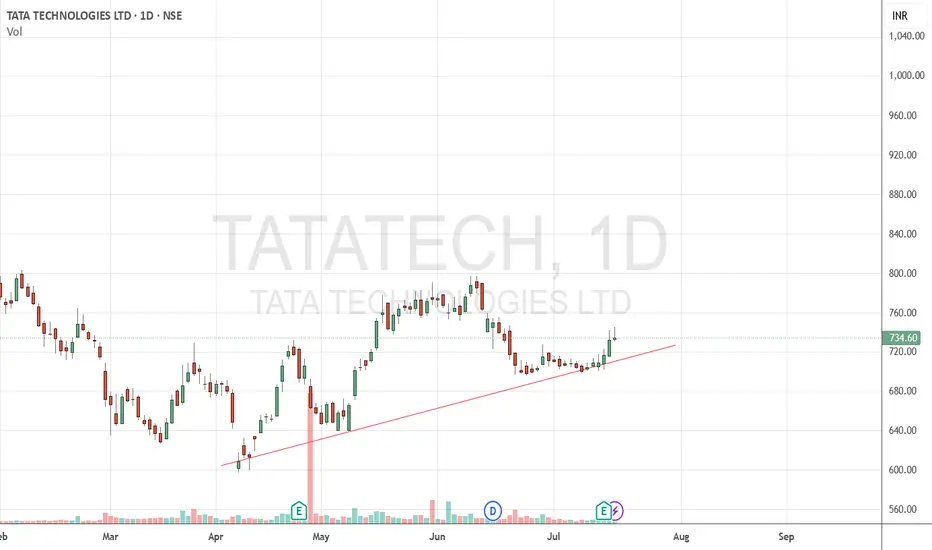
Tata Technologies BuyTata Technologies seems to take support from trend line. Buy @CMP (735) with SL of 698 and target of 785 & 800
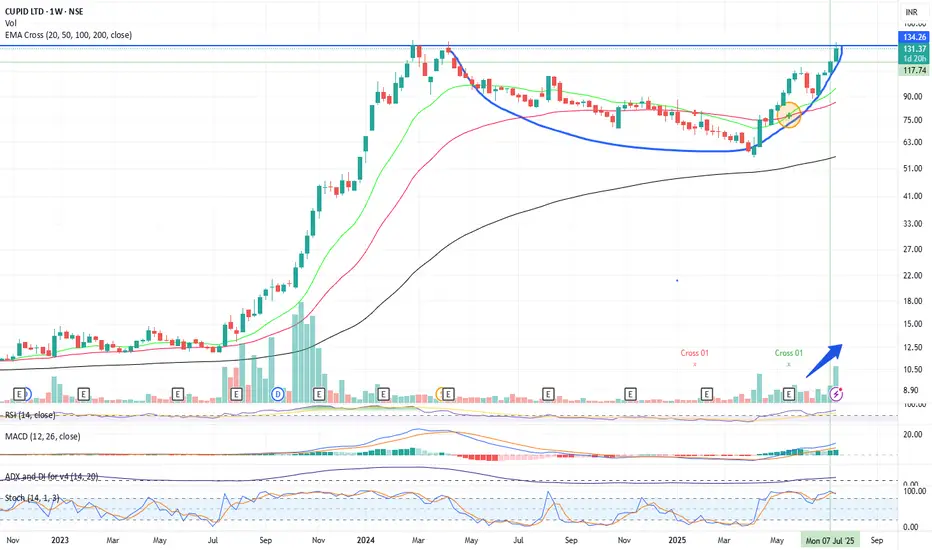
Ye Chart Kuch Kehta Hai - Cupid LtdTactical (Short-Mid Term): Wait for a confirmed breakout above ₹134–135 on strong volume before initiating new positions. With high RSI and Stochastic, expect potential short-term pullbacks.
Strategic (Long Term): If the fundamental growth and profitability remain intact, Cupid Ltd. remains a compelling long-term hold. Consider accumulating on dips or after consolidation phases for better risk-adjusted returns.
Technical Analysis (Chart Insights)
Cup and Handle Breakout: Cupid Ltd.'s weekly chart reveals a classic "cup and handle" pattern, typically signaling bullish continuation if broken with strong volume.
Resistance Level: The price is testing a major resistance around ₹134–135. A successful close above this level with heavy volume may open further upside.
Moving Averages: The stock is trading well above key EMAs (21, 50, 100, 200), indicating a strong uptrend.
Volume Spike: Noticeable increase in volume supports the recent upward movement, suggesting institutional interest.
Momentum Indicators:
RSI: Around 75, in overbought territory, which can lead to short-term pullbacks but also indicates strong momentum.
MACD: Shows bullish crossover and positive momentum.
Stochastic: Also overbought (>90), further reinforcing short-term caution.
ADX: Above 35, confirming a strong trend.
Fundamental Analysis Overview
(You requested fundamentals alongside technicals. Here’s a concise evaluation based on typically available metrics for Cupid Ltd:)
Business: Major Indian player in condom and lubricant manufacturing, catering to both domestic and export markets.
Profitability: Historically strong EBITDA margins, healthy net profits, and consistent dividend payouts.
Growth: Steady revenue and profit growth over recent years, supported by both government contracts and retail expansion.
Financial Health:
Minimal to no long-term debt; strong cash reserves.
Good return ratios (ROE, ROCE), suggesting efficient capital usage.
Valuation: As of recent data, the stock trades at a premium to sector peers on PE and PB, justified only if growth continues to accelerate.
Strengths
Market Leadership: Niche player in a high-barrier industry.
Exports: Significant export revenue implies diversification beyond India.
Financial Stability: Debt-free, good cash flows, and payouts to shareholders.
Risks
High RSI/Stochastic: Stock is technically overbought, susceptible to corrections.
Sectoral Constraints: Dependent on public sector/government orders, making earnings lumpy.
Valuation Premium: Sustained high valuation requires continuous growth execution.
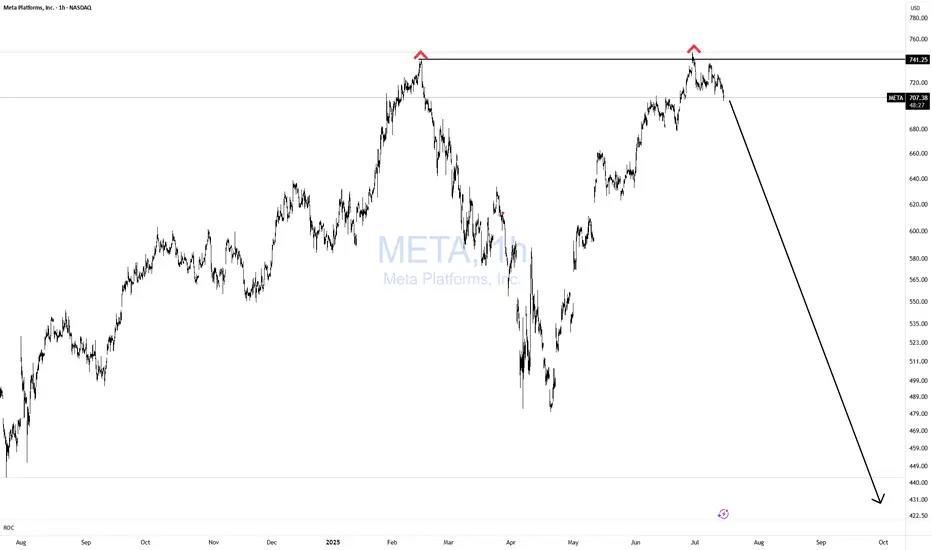
META Double Topping!Does it get any easier than this? NOPE!
If you can't spot this pattern from 1000 miles away, then you need a lot more time in the seat, training yourself in TA.
Simple with great risk reward!
Bulls GTFO!
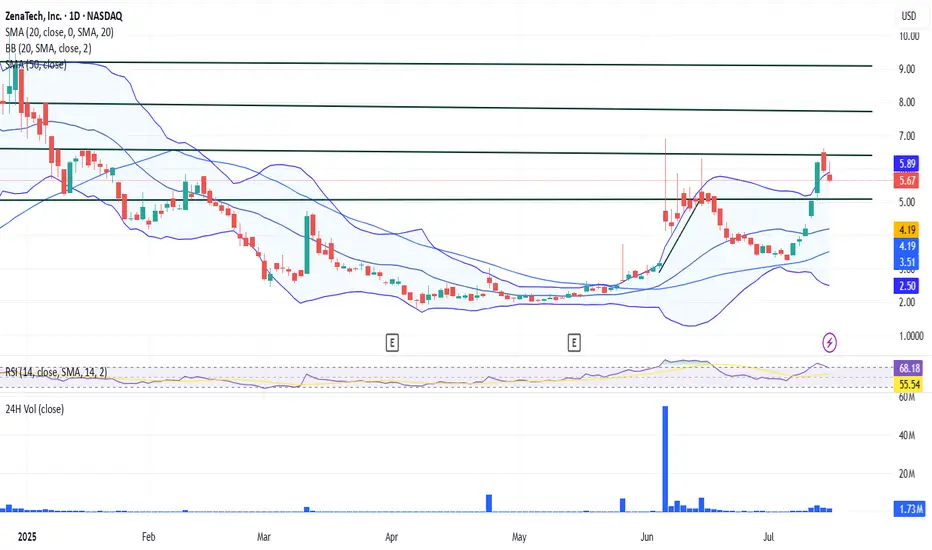
$ZENA Updated Support/Resistance LinesPerfect spot for a pullback to support above $5, before retest of the $6 and higher.
I'm scared of this stock and I'm buyingWall St. has already written the obituary on NASDAQ:SRPT —but that’s exactly why I’m stepping in.
Back in 2020 (link below) I traded a setup from a Spike at 50% Retracement up to its prior ATH near $170, cashed out, dodged the drug-trial IV grenade. I saw 50% of market cap evaporate in a gap. Scared me, made me even more appreciative of risk.
This year alone? Three separate -27% to -50% drawdowns. Yikes is right… and capitulation smells like opportunity.
Risk management: I’m sizing the trade as if it can drop another -50%. If I’m wrong, pain is survivable. If the market over-shot, upside is asymmetric. Whoever’s left is either hedged or numb—perfect soil for a rebound.
Process: 🗑️ Find the trash → Measure the multi-year Volume Profile → Size for worst case → Buy when everyone tells you it's wrong → Hold for return to form

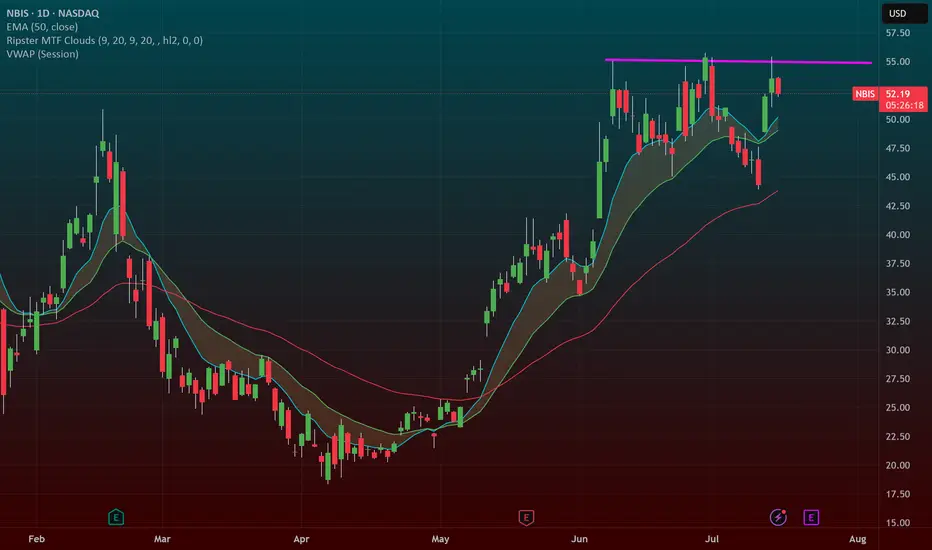
NBIS 55 BREAKOUT in the works!NBIS is an AI darling and a big momentum stock. When it goes it goes! it has been testing this 55 level for some time now.
We recently had a big GS upgrade that "woke" it up. A rest day here and another one will let the 9ema catch up to it and allow for a big breakout. If we take out this trendline at 55 ill put the stop 9ema and swing this.
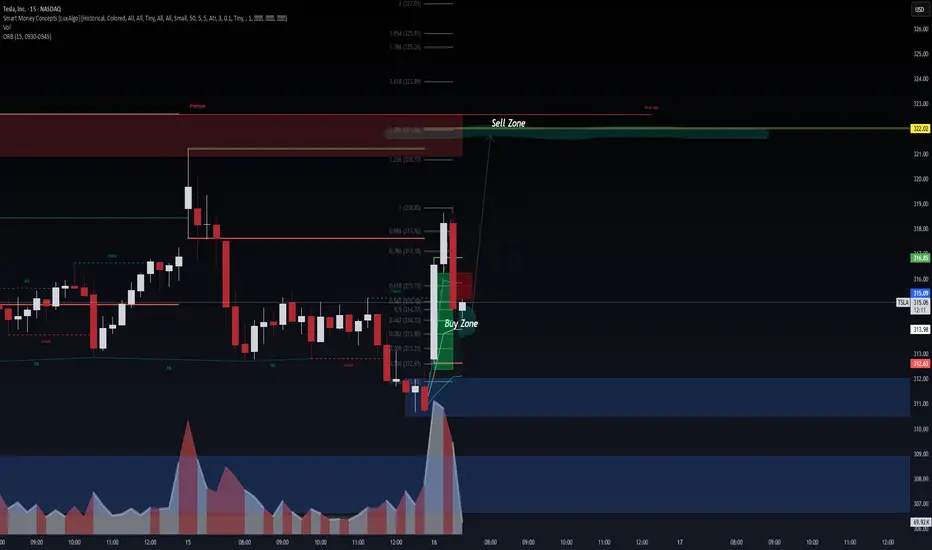
TSLA: DT 7/16/2025Took a trade at the fair value gap 15 min TF, If the market is going to reverse it is either going to be from .50 or .382.
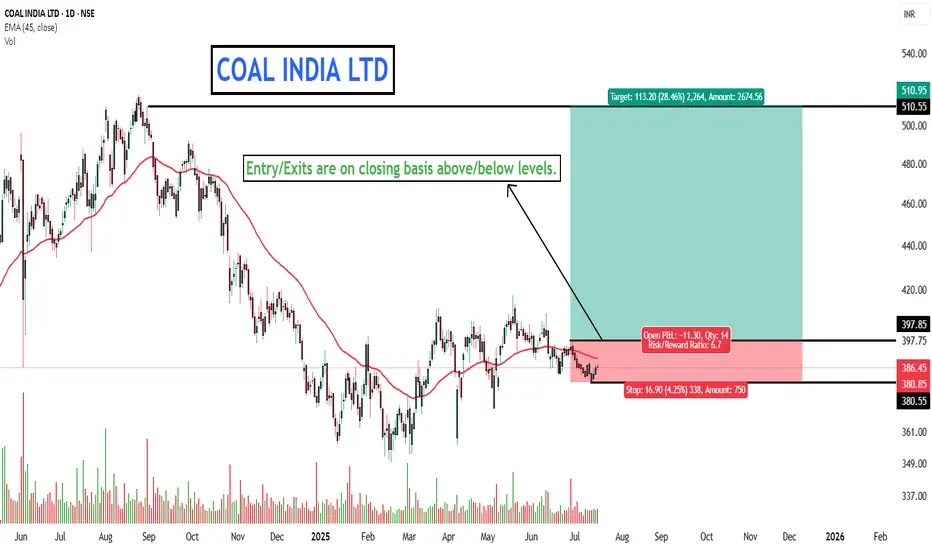
COAL INDIA LTD - DON'T MISS.Everything is pretty much explained in the picture itself.
I am Abhishek Srivastava | SEBI-Certified Research and Equity Derivative Analyst from Delhi with 4+ years of experience.
I focus on simplifying equity markets through technical analysis. On Trading View, I share easy-to-understand insights to help traders and investors make better decisions.
Kindly check my older shared stock results on my profile to make a firm decision to invest in this.
Kindly dm for further assistance it is for free just for this stock.
Thank you and invest wisely.
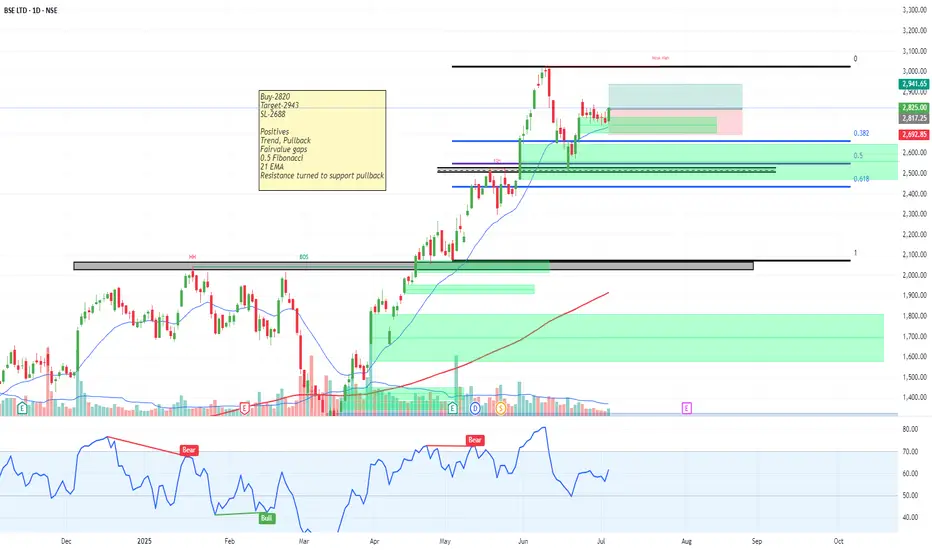
BSE-Swing trade-Very bullish-Is profit booking over?
Buy-2820
Target-2943
SL-2688
Buy-2820
Target-2943
SL-2688
Positives
Trend, Pullback
Fairvalue gaps
0.5 Fibonacci
21 EMA
Resistance turned to support pullback
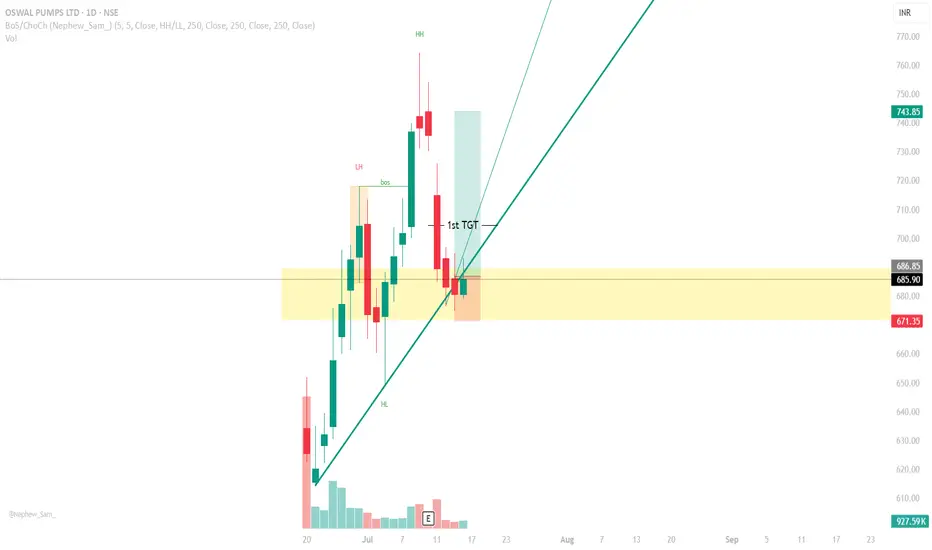
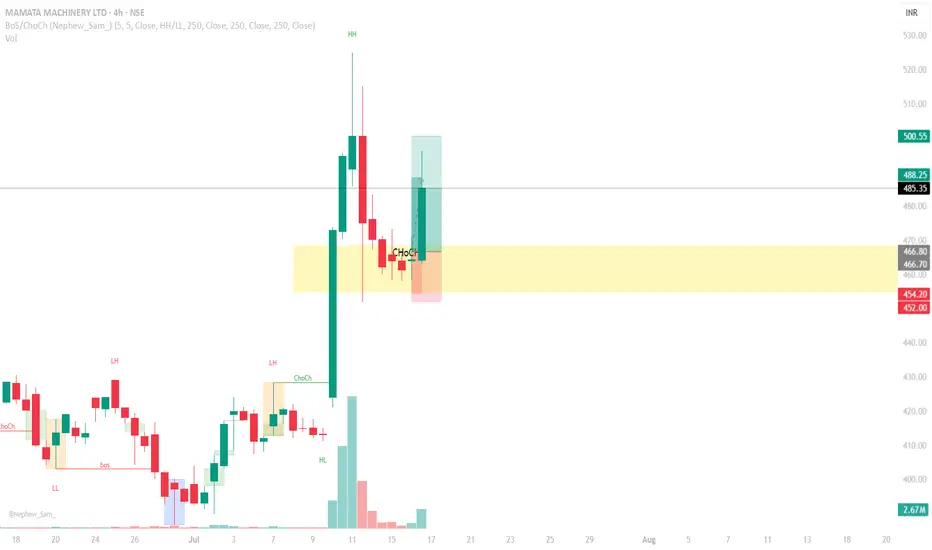
OSWAL PUMPS Long CallIf you have seen my strategy that I used to capture a 1:1.7 RR trade in Mamata Machinery,
Used the same strategy here, but drew fib retracement from low to high,
Currently the price is ranging in the golden zone, and i have entered the trade
SL below the Golden Zone.
Again, this is just my analysis, not a recommendation
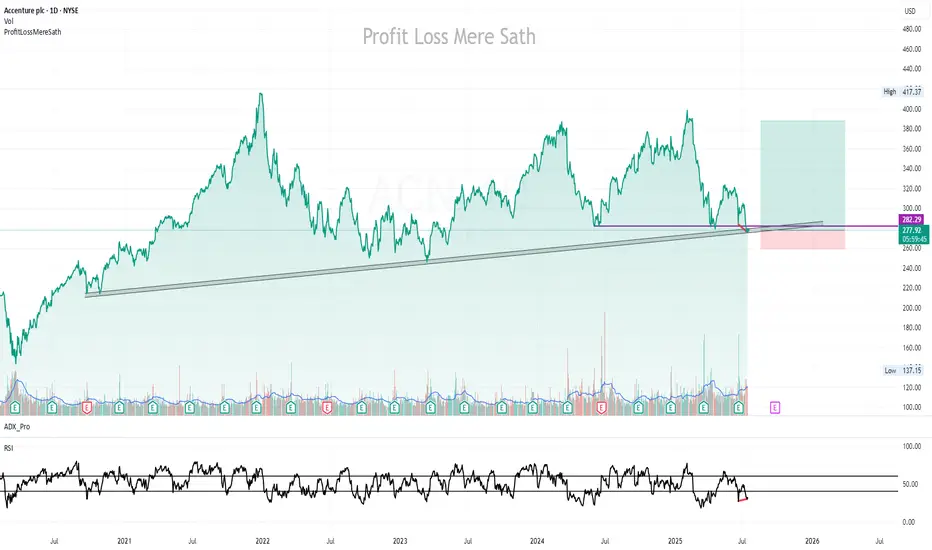
ACN | Buy @LTP | SL below 260 on closing basis | Target 385Disclaimer:
This is not financial advice. Please do your own research or consult with a financial advisor before making any investment decisions. Investments in stocks can be risky and may result in loss of capital.
MAMATA MACHINERY LONG CALLDrew a Fibonacci Retracement from swing low to swing high, marked the golden zone.
Waited for the price to tap into the golden zone and show some sign of upward movement
Captured a 1:1.7 RR trade, could have held till 500, but they say greed kills a man.
And hence, booked my profit.
Also, captured this trade in just 2 Days!!
GNFC On the wayThis is only for educational purpose , This is not for buy/sell recommendation .
I am not SEBI Registered.
looking good above 600
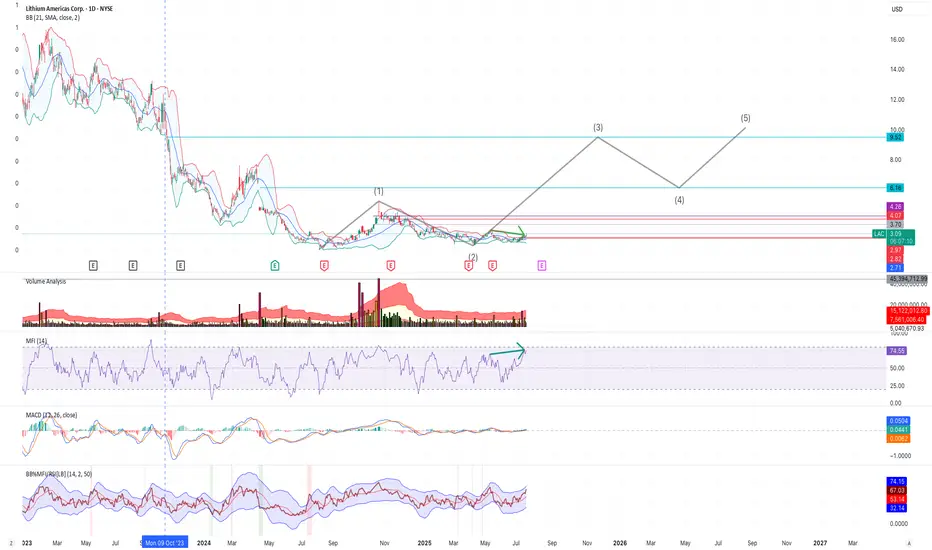
The 3rd Nevada Lithium Elliot WaveI believe LAC may have begun its 3rd elliot wave, with a bottom at $2.33. There also appears to be nice recent strong base support around $2.80. In addition, there appears to be a deviation between price and money flow, as shown with the green arrows - with a potential correction available to push price beyond $3.30 very soon.
I have entered and will watch its daily action and volume with an upside expectation limit around $9-10, then a 4th wave down, etc. Of course, I am not a financial advisor and I have been wrong before and will be wrong again. I trade within this reality and control my risk.
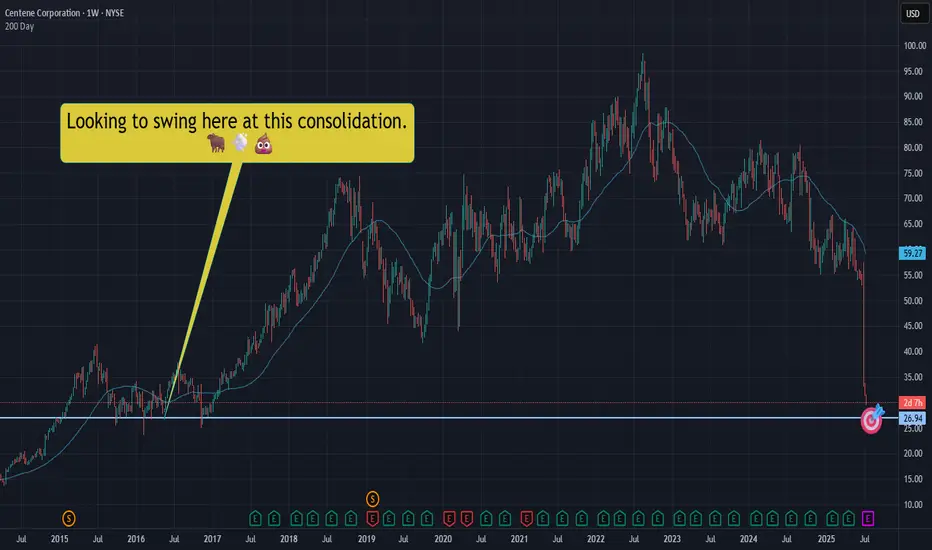
CNC|Let's take a swing at a falling dagger! NYSE:CNC slicing through the void, well.... like a falling dagger through a void.
Not trying to catch this bad boi, but we should expect a bounce at some point. Let's swing for a bounce in that $26.90ish area.
This is NOT a YOLO and I hope it's not an "oh no!" Let's keep our wits about us - starter position only. We can add if we need to, but let's just hope we sell and make some quick Christmas money.
THANK YOU FOR YOUR ATTENTION ON THIS MATTER
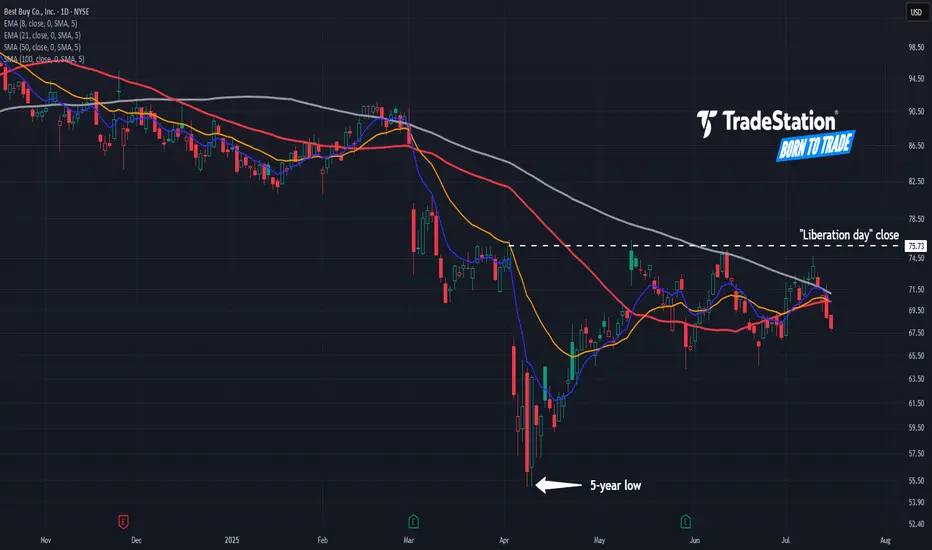
Best Buy’s Lower HighsBest Buy fell sharply on “Liberation Day.” Now, after a modest rebound, some traders may see further downside risk.
The first pattern on today’s chart is July 10’s peak of $74.75. That was below the June high, which in turn was under May’s high. Such a succession of lower highs could indicate a bearish trend.
The potential topping behavior is also happening below the close on April 2, immediately before President Trump announced aggressive tariffs.
Third, prices are stalling near the 50- and 100-day simple moving averages. That may reflect a bearish long-term trend.
Finally, the retailer has returned below its 8- and 21-day exponential moving averages. That may suggest short-term trends have gotten more bearish as well.
TradeStation has, for decades, advanced the trading industry, providing access to stocks, options and futures. If you're born to trade, we could be for you. See our Overview for more.
Past performance, whether actual or indicated by historical tests of strategies, is no guarantee of future performance or success. There is a possibility that you may sustain a loss equal to or greater than your entire investment regardless of which asset class you trade (equities, options or futures); therefore, you should not invest or risk money that you cannot afford to lose. Online trading is not suitable for all investors. View the document titled Characteristics and Risks of Standardized Options at www.TradeStation.com . Before trading any asset class, customers must read the relevant risk disclosure statements on www.TradeStation.com . System access and trade placement and execution may be delayed or fail due to market volatility and volume, quote delays, system and software errors, Internet traffic, outages and other factors.
Securities and futures trading is offered to self-directed customers by TradeStation Securities, Inc., a broker-dealer registered with the Securities and Exchange Commission and a futures commission merchant licensed with the Commodity Futures Trading Commission). TradeStation Securities is a member of the Financial Industry Regulatory Authority, the National Futures Association, and a number of exchanges.
TradeStation Securities, Inc. and TradeStation Technologies, Inc. are each wholly owned subsidiaries of TradeStation Group, Inc., both operating, and providing products and services, under the TradeStation brand and trademark. When applying for, or purchasing, accounts, subscriptions, products and services, it is important that you know which company you will be dealing with. Visit www.TradeStation.com for further important information explaining what this means.
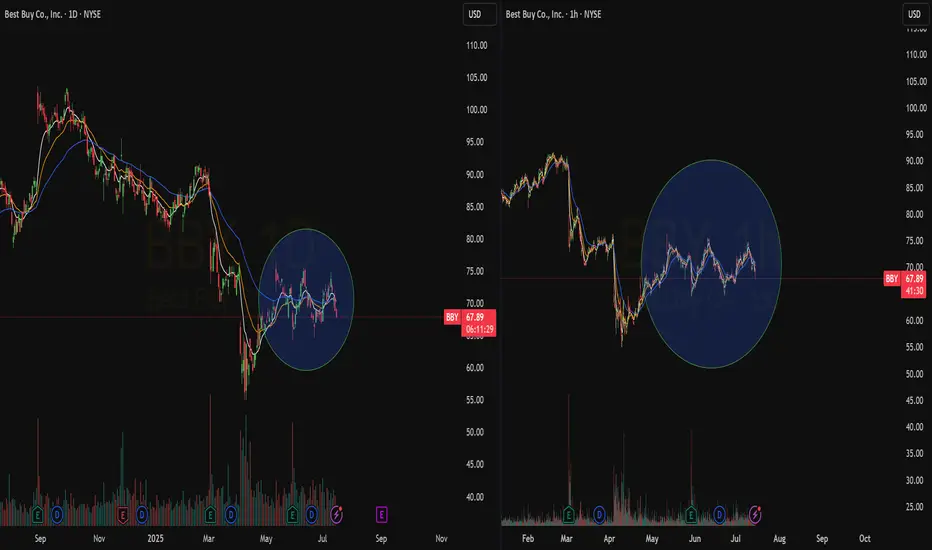
Quick View: $BBY- Both the TF are showing a strong consolidation area after a deep pullback. Volume is still there.
Ready to catch the action.
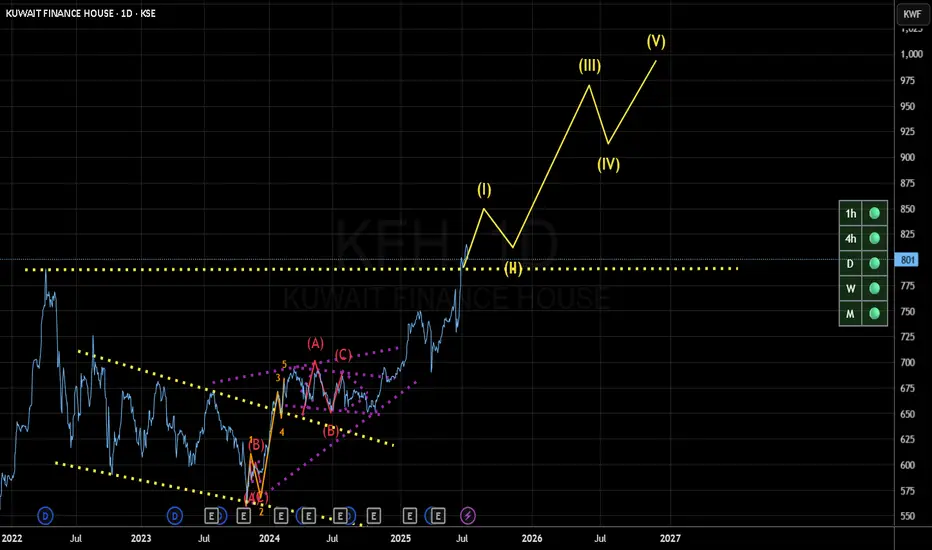
KFH BAITEK UPDATE lliott Wave Patterns, based on the 39.9 cycle and the 69.3 cycle, are a correction until tomorrow, and the next few weeks will be an upward trend.