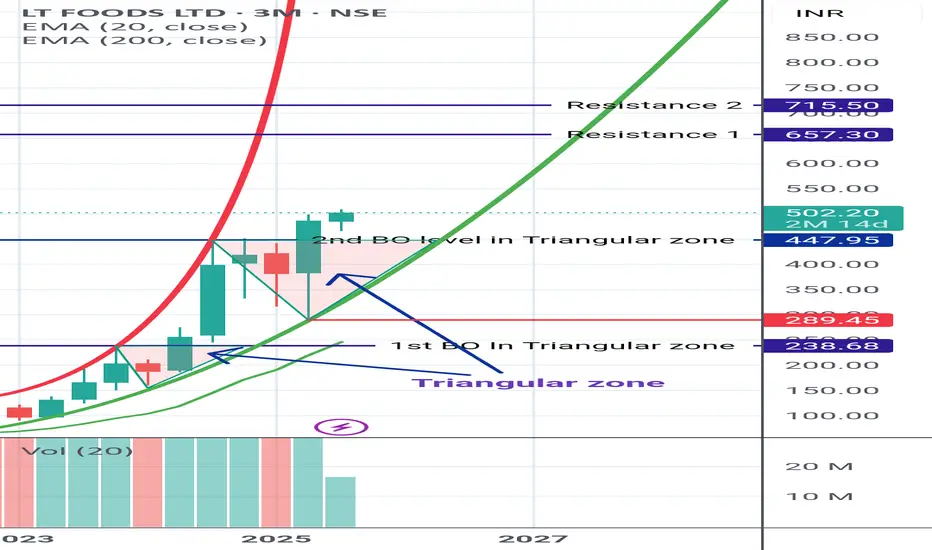
LT FOODS LT FOODS
Moving in Parabolic uptrend pattern & given Triangular zone BO Second time. Making the rally strong.
Shared it for Reference purpose based on chart pattern and My STUDY 🙏
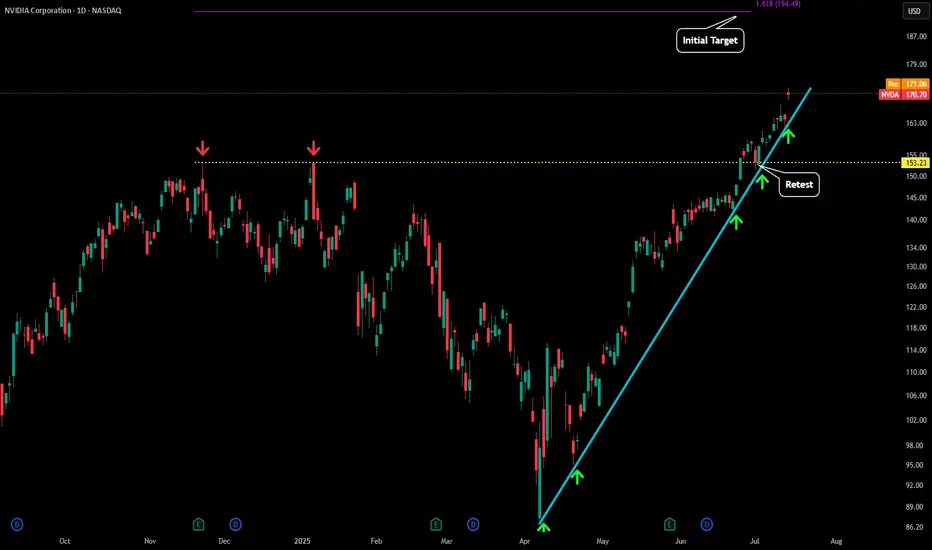
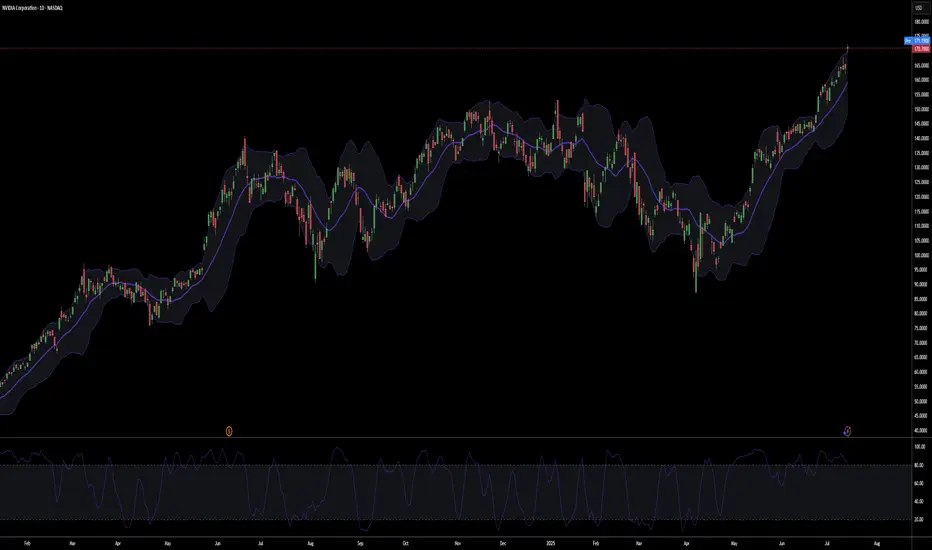
NVDA - Going VerticalNVDA has continue to see our near vertical trajectory to the upside.
After yesterday's test of our blue trendline on the daily at $160 price bounced and has now moved up to $170.
Due to the angle of this trend we will break to the downside very soon, but most likely not before some sort of blow off top move towards the $200 level. It is possible we continue to go vertical but just below $200 seems to be where the major level is to see some take profit start occurring.
Also market structure has been super strong which you can see by the retest and hold of the $153 level (yellow dotted line). This was the previous ATH that NVDA recently created as a new level of support with that retest.
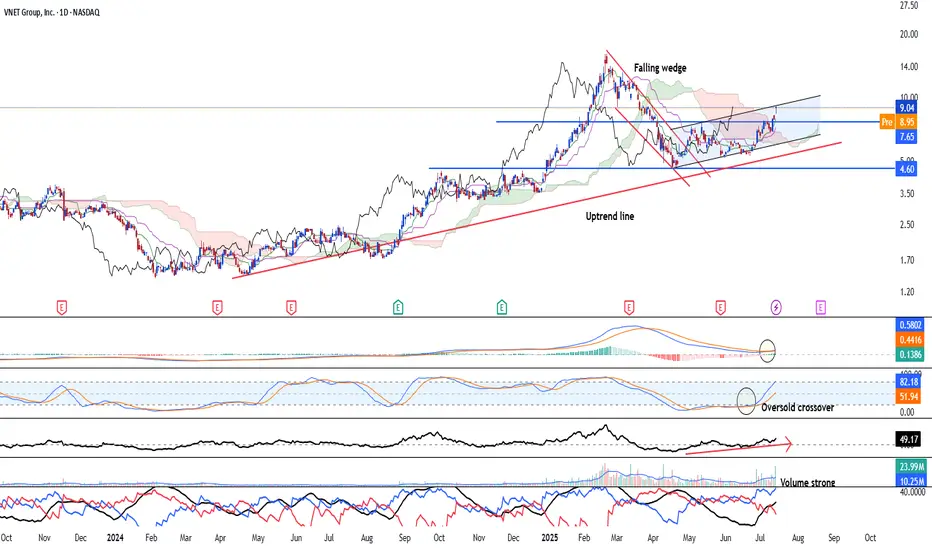
Vnet Group - Bullish trend in an early stage NASDAQ:VNET is looking at an early bullish trend continuation after the stock has broken out of the falling wedge and forms a pair of higher high and higher low. Uptrend remain intact since April 2024. Stock is likely to see strong upside going forward.
Long-term MACD just see a crossover. and histogram is positive. Stochastic oscillator has risen after confirming the oversold crossover and 23-period ROC is positive.
Volume is strong along with the uptrend and directional movement index is strongly bullish.
We see the target able to reach US$20.00. support will be at 7.65 and 6.27
Weekly Equities Trade Idea: CRCL Puts (Update)Hello Traders!
I'm providing an update to the CRCL trade idea from Monday July 14th. Here's what I'm watching:
- Price to open within the range from Tuesday July 15th
- Potential imbalance resolve from Monday July 14th at $204.70
- If price breaks Friday July 11th's high at $206.80 the trade is invalidated
Cheers,
DTD

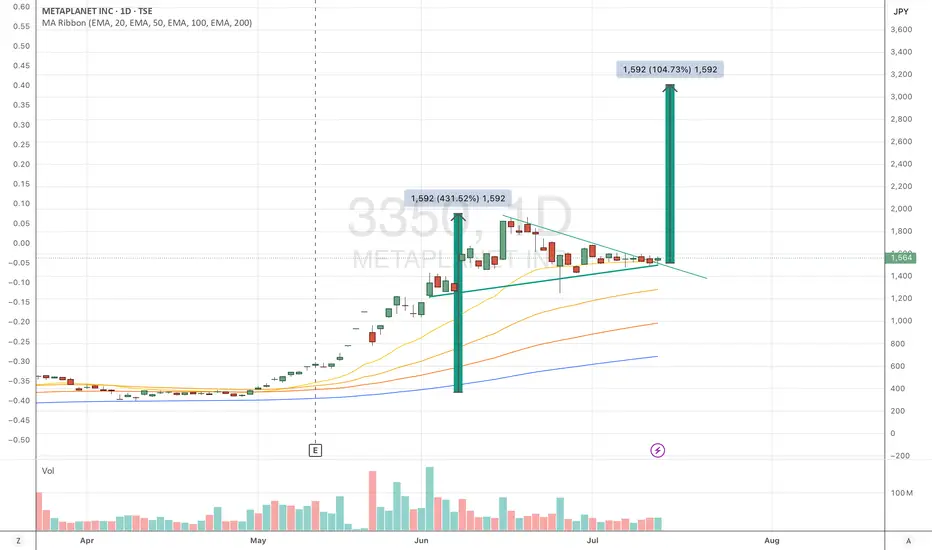
MTPLF, DN3, 3350 : End of week breakoutnice little pennant with a 3200 target this summer. without taking coming bitcoin surge into account.
New normal for FCXWhen gold and silver are high and copper is in high demand as well as other metal, FCX goes balistic

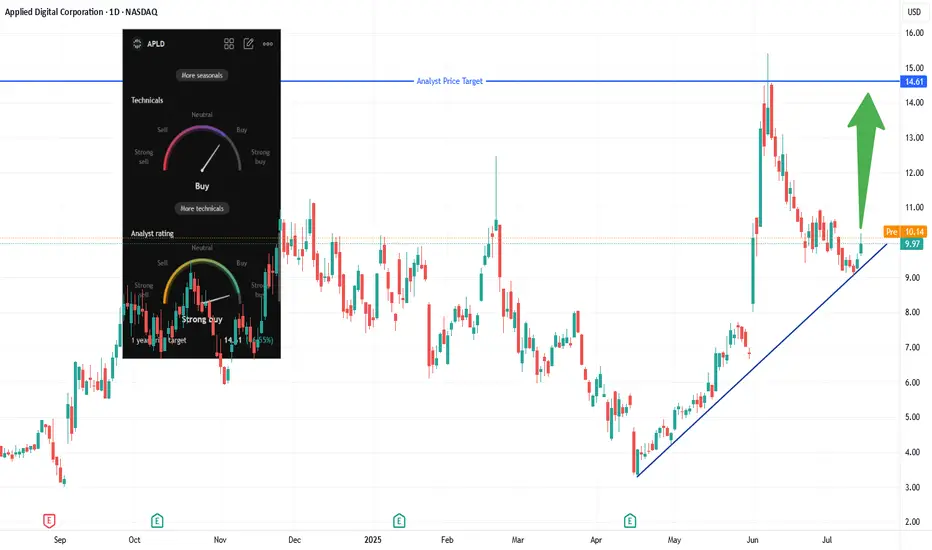
APLD Long: Trendline Bounce + CoreWeave AI Lease🎯 Trade Setup Overview
Entry: Market at Open
Stop‑Loss: Below the trendline at ~$9.00
Primary Target: $14.60–$15.50 (analyst zone + historical highs)
Reward/Risk: ~50–60% upside vs ~7–10% downside = solid R:R ~5:1
📈 Technical Rationale
The stock recently bounced off a long‑term ascending trendline, confirming it as key support. A breakout above ~$10.40 would challenge the analyst consensus target zone ($14–15), projecting a favorable conviction trade.
The setup aligns with classic trend‑continuation patterns—lower risk entry at support with clear upside objective.
🤖 Fundamental/Bull Catalysts
Landmark CoreWeave Lease: APLD signed two 15-year leases (250 MW, + optional 150 MW) with Nvidia-backed CoreWeave, expected to generate ~$7 billion in revenue over the term.
Strong Sector Tailwinds: AI infrastructure is surging. CoreWeave is investing billions in new data centers (e.g., 100 MW→300 MW in Pennsylvania). APLD rides this wave as a data-center REIT pivot.
Analyst & Options Sentiment: Analysts target $12.70–13.40; unusual options flow shows heavy interest in calls up to $15 strikes.
📊 Volume & Momentum Metrics
The recent bounce was accompanied by increased volume—a signal of institutional demand and trend continuation.
Technical indicators confirm bullish momentum building.
📝 Trade Plan
Initiate long position around $10.00.
Place stop-loss just under trendline (~$9.00) to limit downside.
Scale out partial at $14.60 (analyst target) and consider holding a tranche toward $15.40 (historic high).
🛠 Risk Considerations
Trend support could fail—if trend breaks below $9.00, cut losses quickly.
Broader tech pullback or AI sector rotation could pressure price—always trail stops accordingly.
Rising into big selling volumeIf it holds .60 seems bullish due to selling be absorbed, otherwise looking for it to dip to high volume node at .40 and rise on fundamentals.

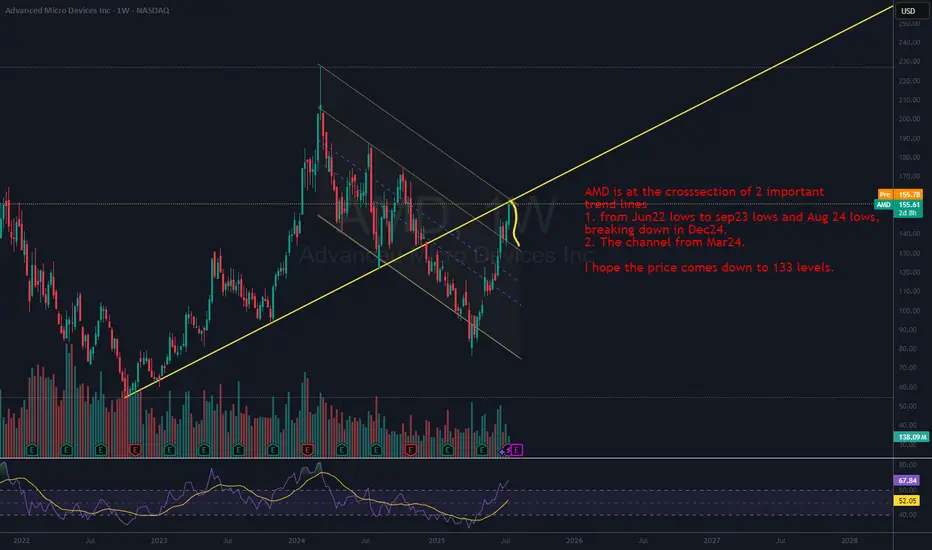
AMD in cross section of 2 important levelsAMD is at the crosssection of 2 important
trend lines
1. from Jun22 lows to sep23 lows and Aug 24 lows,
breaking down in Dec24.
2. The channel from Mar24.
I hope the price comes down to 133 levels.
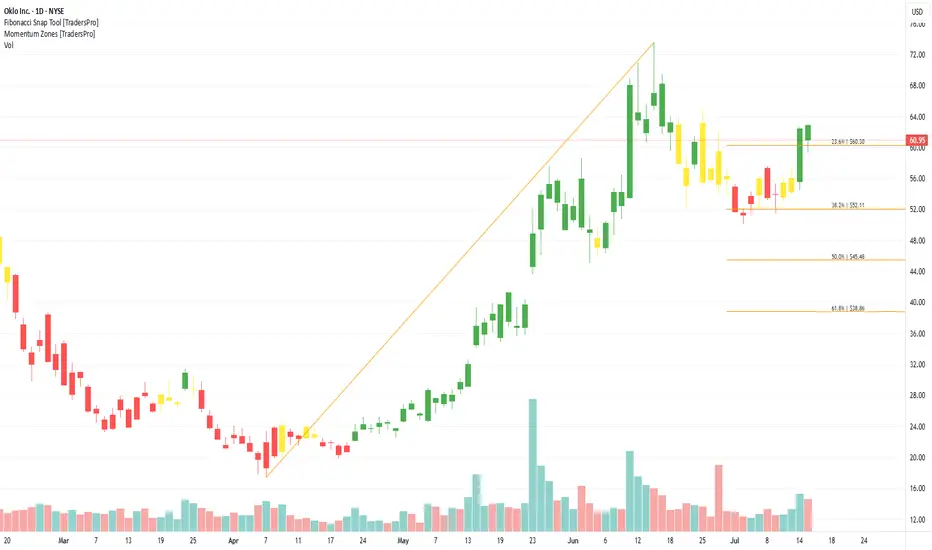
Oklo Inc. (OKLO) Builds the Future of Nuclear EnergyOklo Inc. (OKLO) is a nuclear energy company developing compact, advanced fission power plants designed to deliver clean, reliable energy with minimal waste. Its flagship design, the Aurora powerhouse, aims to provide scalable power solutions for remote locations, data centers, and industrial applications. Oklo’s growth is driven by the global push for zero-carbon energy, innovation in small modular reactors, and rising interest in alternative baseload power sources.
On the chart, a confirmation bar with rising volume signals strong buying momentum. The price has entered the momentum zone by breaking above the .236 Fibonacci level. A trailing stop can be set just below that level using the Fibonacci snap tool to protect gains while staying exposed to further upside.
NVDA SELL SELL SELLSELL NVDA at any price now, riding it back down to 93.00 to 77.00 as Profit Targets, Stop Loss will be determine later!
If anyone likes long mumbo jumbo garbage analysis, than this is NOT for you.
Also, if you are afraid of risk, failure, and want only a 100% sure thing, than
run as fast as you can from the market, because the market is NOT a sure thing,
so it is definitely NOT for you.
WARNING: This is just opinions of the market and its only for journaling purpose. This information and any publication here are NOT meant to be, and do NOT constitute, financial, investment, trading, or other types of advice or recommendations. Trading any market instrument is a RISKY business, so do your own due diligence, and trade at your own risk. You can loose all of your money and much more.
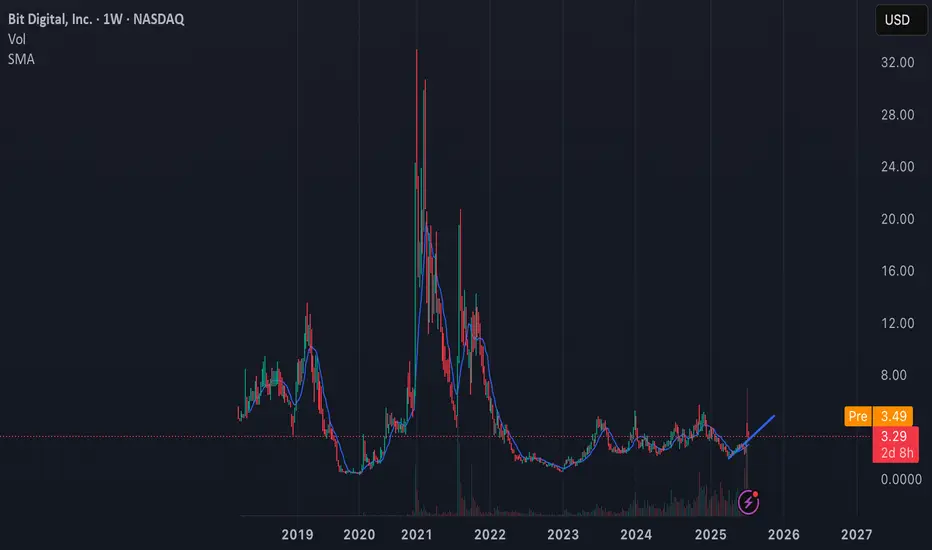
Transitioning to a full Ethereum strategy at the right timeI feel that the ETH/BTC pair has bottomed out, and this company is likely to benefit greatly from Ethereum’s rise (and from staking), as one of the largest ETH holders.
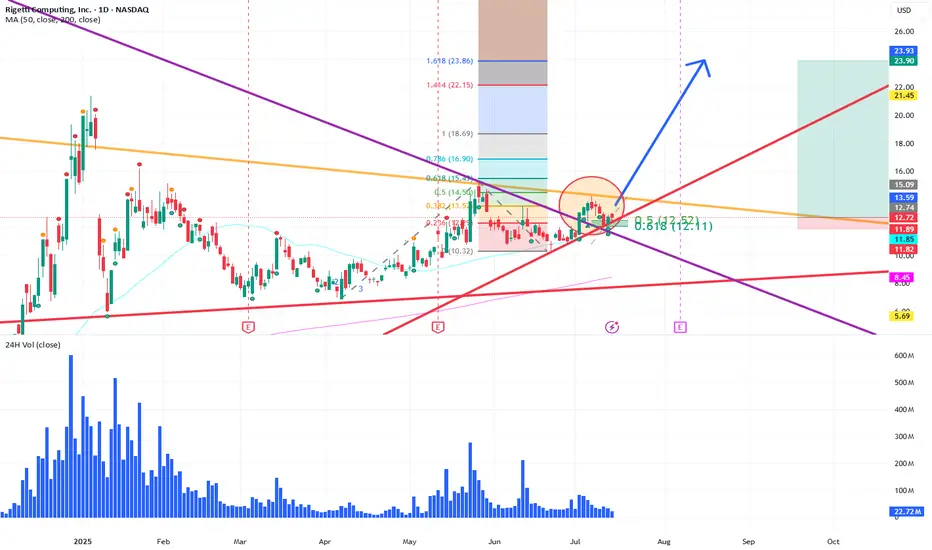
Possible Break-Out Chart Pattern and News RelatedUpdate to Rigetti:
After a retest to the Fibonacci Support-Zone 0,5-0,618, we could see an impulse Movement in Wave 3 to the 1,618 Fibonnacci lvl around 24 $
News relating the new system and low error for their new qubits could launch that wave.
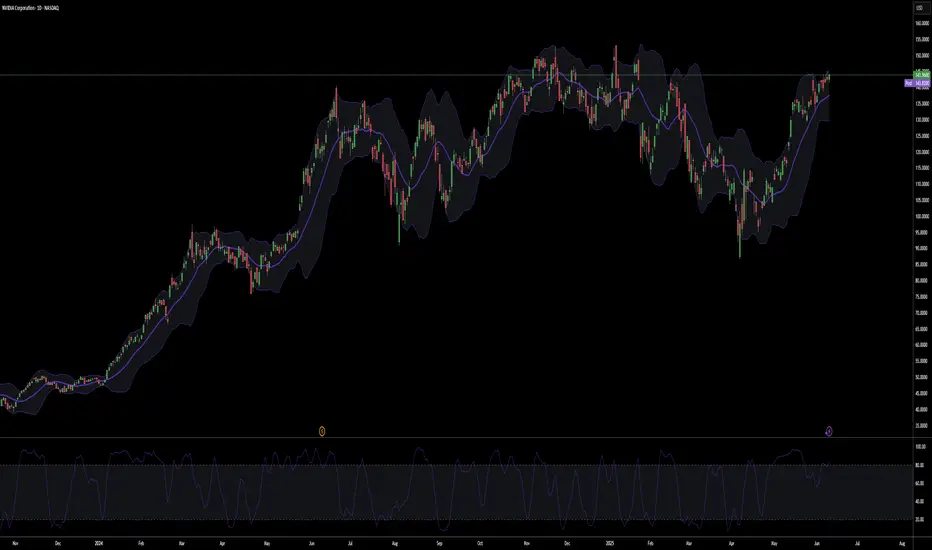
NVDA SELLSELL NVDA at 149.00 to 163.00, riding it back down to 93.00 to 77.00 as Profit Targets, Stop Loss is at 172.00!
If anyone likes long mumbo jumbo garbage analysis, than this is NOT for you.
Also, if you are afraid of risk, failure, and want only a 100% sure thing, than
run as fast as you can from the markets, because the markets are NOT a sure thing,
so it is definitely NOT for you.
WARNING: This is just my opinions of the market and its only for journaling purpose. This information and any publication here are NOT meant to be, and do NOT constitute, financial, investment, trading, or other types of advice or recommendations. Trading any market instrument is a RISKY business, so do your own due diligence, and trade at your own risk. You can loose all of your money and much more.
Dynemic Ltd: Bullish Setup UnfoldingDynemic Products Ltd (NSE: DYNPRO) is a well-established exporter and manufacturer of synthetic food-grade dyes, lake colors, and D&C colors, catering to global markets. As of July 16, 2025, the stock trades at ₹341 and has recently broken out of a prolonged consolidation zone, indicating renewed investor interest.
From a fundamental perspective, the company’s financials show notable improvements:
🔸 Revenue (FY25): ₹214 crore, up 29% YoY
🔸 Net Profit (FY25): ₹15 crore, up 269% YoY
🔸 EPS (TTM): ₹3.65
🔸 P/E Ratio: ~23× – moderately valued
🔸 P/B Ratio: ~1.56× – near fair book value
🔸 ROE: ~7%, showing improving return to shareholders
🔸 ROCE: ~12.7%, indicating decent operational efficiency
🔸 Debt-to-Equity: ~0.43× – financially stable
🔸 Current Ratio: ~0.95× – slightly below ideal liquidity levels
🔸 Operating Cash Flow: ₹28 crore – healthy cash generation
While the company has a stable balance sheet and growing profitability, investors should note that liquidity remains slightly tight, requiring careful monitoring of working capital and short-term obligations. Nonetheless, the financial turnaround and earnings consistency signal strength.
On the technical front, the stock has shown strong bullish action after breaking above a multi-month resistance:
🔹 Breakout Zone Cleared: ₹325–₹330 (previous resistance)
🔹 Current Price: ₹341
🔹 Reversal Zone (Strong Support): ₹292 to ₹304
🔹 R1: ₹392 – short-term resistance
🔹 R2: ₹469 – medium-term target
🔹 R3: ₹615 – long-term upside if momentum sustains
The breakout is confirmed with increased volume and a clear higher-high, higher-low structure, validating bullish sentiment. The price now rides above a rising trendline, suggesting trend continuation unless a breakdown occurs below ₹292.
In summary, Dynemic Products Ltd currently offers a compelling techno-fundamental setup. The financials have improved significantly, valuations remain reasonable, and the technical breakout suggests potential for further upside. Investors can consider accumulating on dips above ₹304, while swing traders may target ₹392 and ₹469 in the short-to-medium term. A close watch on liquidity and cash flows is advised, but the stock presents a strong growth case in the specialty chemicals space.
Disclaimer: lnkd.in

AOTAOT price is now near the support zone of 27-25. If the price cannot break through the 25 baht level, it is expected that the price will rebound. Consider buying in the red zone.
🔥Trading futures, forex, CFDs and stocks carries a risk of loss.
Please consider carefully whether such trading is suitable for you.
>>GooD Luck 😊
❤️ Like and subscribe to never miss a new idea!

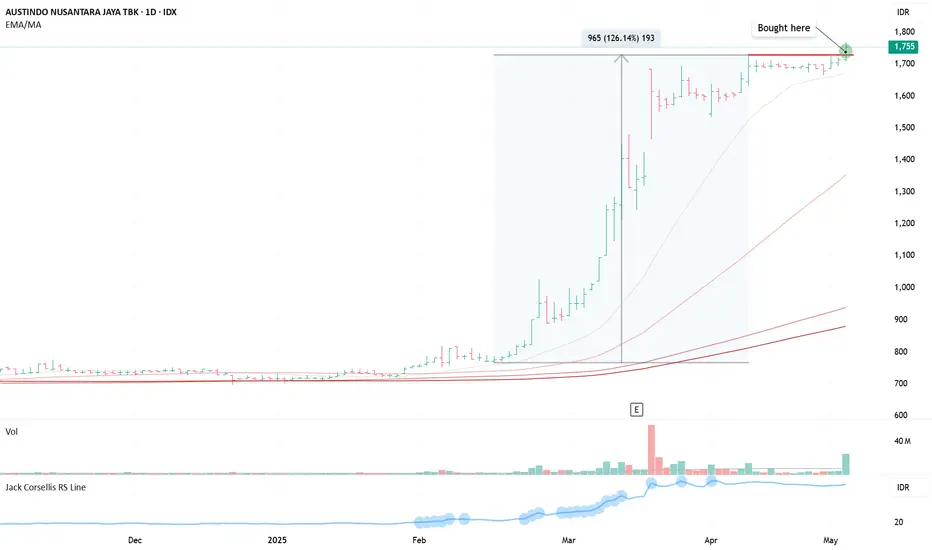
ANJT - POWER PLAYPosition Update: May 6, 2025
Key factors:
1. Low-risk entry point.
2. It has a very tight correction area.
3. A strong sign of continuation of upward momentum.
4. Corrects below 4% during this pause, indicating big institutions' reluctance to sell their positions.
5. High relative strength, outperforming the general market.
5. The stock is moving on its own universe and marching to its own drummer.
6. Volume diminishes during the correction, indicating less supply coming to the market.
7. The general market is in the early stages of a bull campaign.
8. Huge volume on the breakout
Consideration: Not many traction in the market so far.
This is a classic Power Play setup, featuring two viable entry points. My initial position was taken on April 14 from the low cheat and added big on a very clear pivot point today. I’m looking forward to seeing further constructive price action moving forward.
TAPG (VCP 10W 18/4 3T)Position update: July 9, 2025.
Key factors:
1. Confirmed stage 2 uptrend.
2. A textbook VCP setup with a clear, low-risk entry
3. Has absorbed its majority line of supply.
4. The stock moves on its own drummer, hitting an all-time high while the index struggles to reclaim its highs.
5. High relative strength.
6. Volume has dried up, indicating less supply coming to the market.
7. Strong fundamentals, with consistent triple-digit year-over-year earnings growth.
8. Significant volume surge on the breakout.
Considerations: Despite a favorable technical setup, risk should be managed diligently given the stock's sharp ascent and potential for profit-taking. Establishing stop-loss levels and monitoring market conditions is essential.
This is a quintessential VCP breakout with a clear pivot entry and minimal risk. I’m starting to see increased traction in the market now—a very positive sign to scale up trading size.

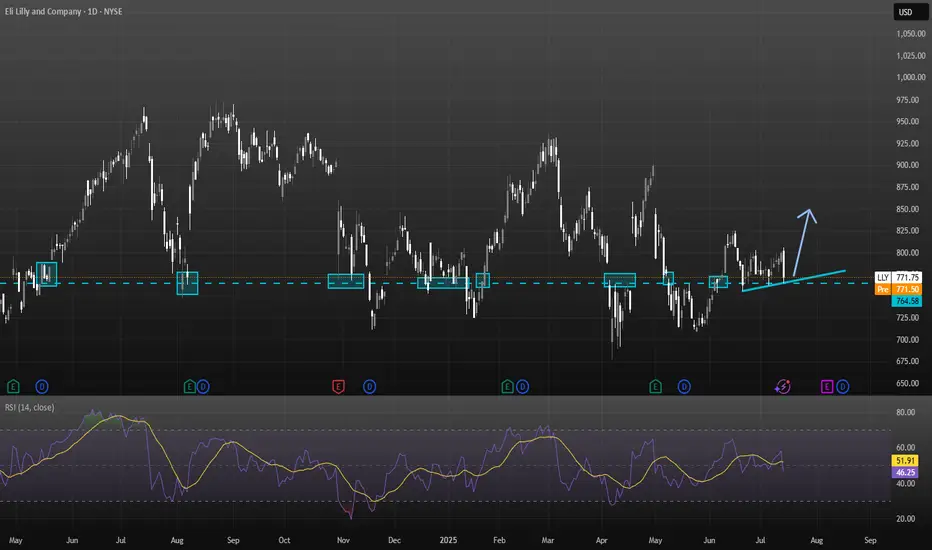
Eli Lilly (LLY) – Full Technical + Fundamental Analysis (July 20
I wanted to take a deeper dive into LLY and analyze more than just trendlines—looking into both the technical structure and the broader fundamentals of the stock.
Sources: i have a list of sources at the end of my report
Technical Breakdown:
Current Price: ~$771.75
Resistance Zone: $950–970 prior rejection levels
Support Zone:
Strong: $760–765 (multiple historical rejections and rebounds).
Secondary: $717 (previous bounce area).
Trendline: Steadily rising higher-lows, supporting price above $760.
RSI: Recently cooled from 79 (overbought) to ~51 (neutral), suggesting balanced conditions. No immediate overbought or oversold signals.
Chart Pattern Summary:
Price respects a higher-low ascending trendline.
Buyers defend $760, but $800+ remains heavy resistance.
Breakdown below $760 risks a drop to ~$717.
Breakout above $800 opens upside toward $950–970.
Growth Catalysts:
1. Zepbound & Mounjaro dominate the obesity/diabetes sector.
2. Retatrutide & Orforglipron (next-gen obesity treatments) could further expand market share by 2026.
3. Revenue growth: ~45% YoY in Q4 2024.
4. Analysts forecast ~15% annual revenue growth and 20%+ EPS CAGR through 2027.
Risks:
1. Q1 2025 saw adjusted EPS guidance trimmed to ~$20.78–22.28 from previous ~$22.50–24, causing ~7% drop in stock .
2. Valuation rich: forward P/E ~35 vs peers like Novo at ~14
3. 025 EPS estimates have slightly fallen (from $22.20 to $21.94) while 2026 expectations rose.
4. New rival Hengrui/Kailera shows ~18–19% weight loss, close to Zepbound’s ~21%, though still pre-approval
5. Regulatory volatility: Trump has floated heavy pharma tariffs (up to 200%) and repatriation incentives; Lilly has U.S. capacity but details remain uncertain
Analyst Sentiment:
Consensus target: $1,000+ within 12–24 months.
MarketBeat & StockAnalysis rate LLY as Strong Buy.
Institutional ownership remains high.
What to Monitor Next
1. FDA approvals for orforglipron or retatrutide (expected late 2025).
2. Next earnings—watch for forward guidance recovery.
3. Policy shifts (potential tariffs on pharma imports).
4. Obesity drug competition (Novo Nordisk, Chinese biosimilars).
Final Position: Modest Long Bias
Eli Lilly is technically holding trendline support while fundamentally leading in a booming therapeutic sector. Together, this makes LLY a long-term buy, though caution near $760 is warranted.
I tried to summaries as short as possible as i didn't want to make this post into an essay
Please note this is not financial advice
Sources Used for Analysis:
1. Eli Lilly Company Filings & Reports
2. Latest Earnings Reports (Q1 2025, prior Q4 2024)
3. Pipeline Updates and FDA Submission News
4. MarketBeat (Analyst ratings & price targets)
5. Yahoo Finance (EPS estimates, revenue growth forecasts)
6. StockAnalysis.com (Valuation ratios, dividend data)
7. Bloomberg and CNBC (News on guidance revisions)
8. Federal Reserve statements and forecasts
9. Bureau of Labor Statistics (BLS) – healthcare inflation data
10. WSJ and Financial Times – reporting on pharma tariffs and global healthcare policy shifts
11. Industry and Sector Insights
12. Novo Nordisk Investor Updates – competitor tracking
13. Statista – Obesity/diabetes global prevalence reports
14. World Health Organization (WHO) reports
15. Standard RSI and trendline patterns (based on TradingView style)
16. Support/resistance zones derived from historical price action Market Sentiment Tools
17. CNN Fear & Greed Index
18. S&P 500 Health Care Sector ETF (XLV) trends
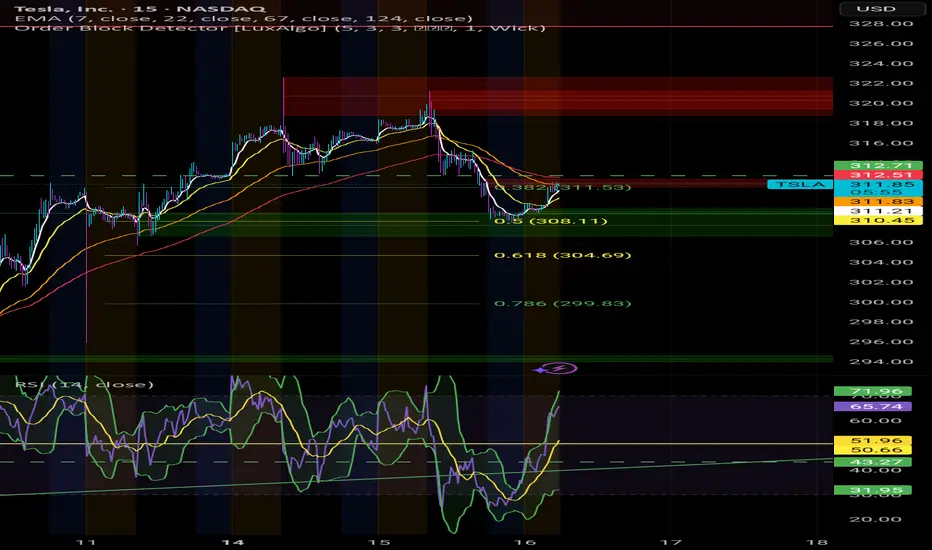
Is the BullRun over? I don't think so. $TSLAYesterday we saw a somewhat heavy fall in Indexes, and it probably scared alot of retail Bulls outs.
However, it seems we've fallen straight into potential medium term supports across multiple stocks in the markets.
I'm convinced we will get a good economic data print today.
This would open the door to new ATHs, again, in the Indexes.
For this to play out, the local bottoms established over night need to hold.
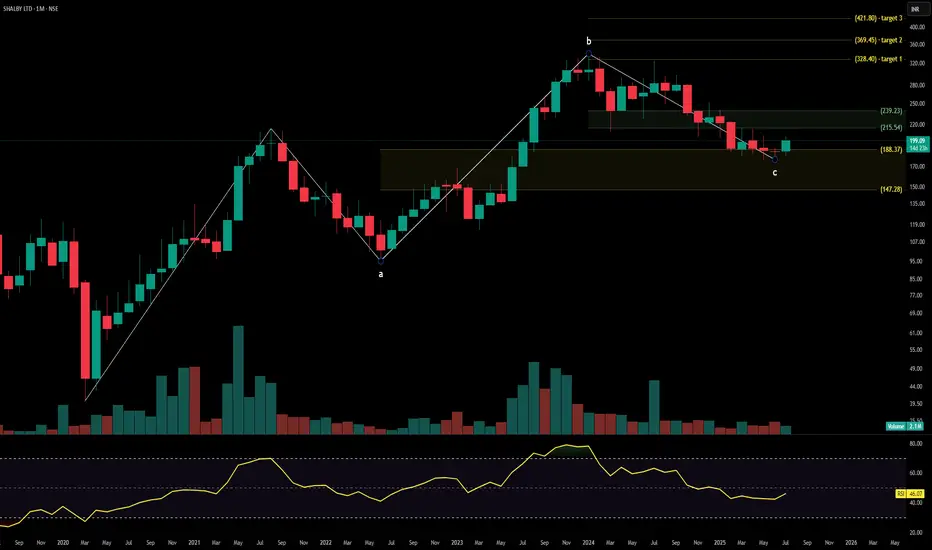
SHALBY HOSPITALSShalby Ltd. is a multi-specialty hospital chain with a strong presence across orthopedics, joint replacement, cardiology, oncology, and critical care services. With operations spanning India and growing international outreach through medical tourism, the company continues to expand its healthcare network via asset-light and franchise models. The stock is currently trading at ₹247.90 and is forming a base on the monthly timeframe after a broad correction. Fibonacci breakout targets are mapped toward ₹328.40, ₹369.45, and ₹421.80.
Shalby Ltd. – FY22–FY25 Snapshot
Sales – ₹607 Cr → ₹682 Cr → ₹748 Cr → ₹816 Cr – Expansion driven by new centers and service diversification
Net Profit – ₹46.3 Cr → ₹52.5 Cr → ₹61.8 Cr → ₹70.2 Cr – Improving earnings with cost optimization
Company Order Book – Moderate → Moderate → Strong → Strong – Increased traction in Tier-2 urban centers and surgical specialties
Dividend Yield (%) – 0.48% → 0.51% → 0.55% → 0.58% – Steady payouts with retained earnings
Operating Performance – Moderate → Moderate → Strong → Strong – Margin uplift from blended specialty mix
Equity Capital – ₹10.87 Cr (constant) – Efficient capital structure
Total Debt – ₹158 Cr → ₹148 Cr → ₹137 Cr → ₹125 Cr – Gradual deleveraging
Total Liabilities – ₹450 Cr → ₹464 Cr → ₹478 Cr → ₹494 Cr – Scaling with clinical expansion
Fixed Assets – ₹185 Cr → ₹192 Cr → ₹201 Cr → ₹210 Cr – Conservative capex, focused on infra and surgical equipment
Latest Highlights FY25 net profit rose 13.5% YoY to ₹70.2 Cr; revenue increased 9.1% to ₹816 Cr EPS: ₹6.46 | EBITDA Margin: 21.8% | Net Margin: 8.60% Return on Equity: 15.94% | Return on Assets: 9.37% Promoter holding: 71.63% | Dividend Yield: 0.58% Expansion into Udaipur, Surat, and Indore driving specialty-led patient volume Medical tourism and robotic surgery verticals gaining revenue traction
Institutional Interest & Ownership Trends Promoter holding remains strong at 71.63% with no dilution or pledging. Mutual fund positions have remained steady, while HNI accumulation is visible via delivery volumes in Q1 FY26. FII participation remains minimal, with domestic interest driving stability in ownership structure.
Business Growth Verdict Yes, Shalby is growing steadily with diversified service lines Margins and return metrics are trending upward Debt reduction is consistent and manageable Asset-light model enhances scalability without aggressive capex
Company Guidance Management expects FY26 revenue to cross ₹900 Cr+ with mid-teen margin targets. Growth will be led by expansion in cardiac care, ortho surgeries, and increased occupancy across existing units.
Final Investment Verdict Shalby Ltd. offers a disciplined healthcare growth story with consistent profitability, high promoter confidence, and expanding patient base. The asset-light hospital expansion and focus on surgical verticals provide margin support. Technical structure indicates breakout potential above ₹239–₹247 zone with medium-term targets mapped at ₹328.40, ₹369.45, and ₹421.80, making the stock attractive for staggered accumulation by investors seeking healthcare exposure in the mid-cap space.
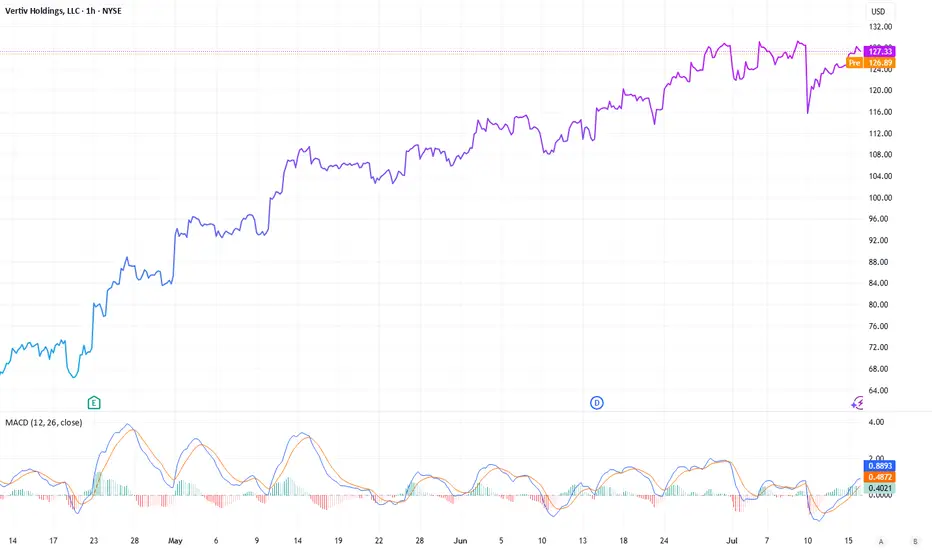
Vertiv Holdings: Powering the AI ProgressionNYSE:VRT NASDAQ:NVDA NASDAQ:META NYSE:ETN NASDAQ:CEG
While investors are engaged in a race “identify the next major microchip manufacturer”, a quieter opportunity is emerging at the crossroads of artificial intelligence (AI), infrastructure, and long-term demand. Vertiv Holdings (VRT), a company often overlooked amidst the hype, could be the backbone of the AI boom. In a recent NVIDIA earnings call, CEO Jensen Huang dropped a pretty interesting statement: the biggest hurdle for future data centers isn’t chips or regulations- it’s power.
The Power and Cooling Conundrum
AI is no longer some futuristic bet, it’s more like the engine of modern enterprise. Data centers, once powered by modest CPUs, now rely on NVIDIA’s superior GPUs to handle complex, multi-task workloads at scale. But this shift has exposed a critical bottleneck: energy supply can’t keep up with compute demand. Think of NVIDIA’s GPUs as high-performance supercars-powerful yet fuel-hungry, requiring premium infrastructure to operate efficiently. Data centers face challenges like high carbon footprints, downtime risks (recall the $10 billion CrowdStrike outage from a faulty software update), and intense cooling needs due to soaring rack densities.
And this is where Vertiv (VRT) comes in. This company designs and delivers essential infrastructure-uninterruptible power supplies, power distribution units, and advanced cooling solutions (both air and liquid-based)-tailored for data centers, telecom, and industrial clients. If NVIDIA’s GPUs are the brain, Vertiv is the heart and lungs, ensuring these systems run without melting down. The cooling challenge, in particular, is a game-changer. With rack densities exceeding 300kW, traditional air cooling falls short, making Vertiv’s liquid cooling innovations a must-have.
A Strategic Edge: The META-Nuclear Play
The AI race isn’t just about chips- it’s also about the infrastructure to sustain them. A telling sign came from META, which recently inked a nuclear power deal with Constellation Energy. Why nuclear? It offers low-carbon, reliable, 24/7 power with massive capacity-ideal for AI’s energy demands. Yet, Constellation’s deal didn’t address cooling, a gap Vertiv fills perfectly. This collaboration points a broader trend: companies are scrambling to solve power and thermal management issues, and Vertiv is at the forefront of this effort.
Financial Momentum and Analyst Backing
Vertiv’s financials back up its strategic importance. In Q1 2025, the company reported $2.04 billion in revenue-a 25% year-over-year jump, surpassing the $1.94 billion estimate. Adjusted earnings per share hit $0.64, beating the $0.615 forecast. Its backlog soared 50% to $6 billion, signaling robust future demand, while free cash flow margins doubled to 13% ($1.48 billion). Earnings before interest, taxes, depreciation, and amortization grew 22.8%, with a manageable 1.6x leverage ratio and over $350 million annually invested in R&D-much of it for cutting-edge liquid cooling.
Looking ahead, analysts project revenue of $10.76 billion by 2026, with EPS growth of 22% annually and free cash flow reaching $1.6 billion, even as capital expenditure rises to 18.2%. The sentiment is overwhelmingly bullish: Bank of America, Goldman Sachs, and Barclays maintain "Buy" ratings, with target prices ranging from $115 to $130. Oppenheimer, a top analyst, recently raised its target to $132, while 75% of analysts recommend buying, with only 6.3% suggesting a hold or sell.
Outpacing the Market
Since its liberation date of April 2, Vertiv has outperformed its peers. While the S&P 500 grew 11.48%, NVIDIA rose 45.62%, Eaton Corporation 30.26%, and Constellation Energy 48.3%, Vertiv surged 69.8%. Its focus on data centers and AI-driven infrastructure is reflected in this outperformance, with even uranium ETFs (42.41%) tied to nuclear power trends being outpaced. Vertiv’s faster free cash flow growth and direct exposure to AI’s power and cooling bottlenecks give it an edge over cyclical chipmakers.
A Long-Term Buy?
The thesis is simple: AI is already here and it will stay, and the infrastructure supporting it-especially cooling- is important factor in ensuring the rotation of the gears. Vertiv is quietly becoming, lets say, the NVIDIA of infrastructure, leveraging strong financials, analyst confidence, and a critical role in solving AI’s energy crisis. At a current price of $127.37, with targets up to $132 within the next 18 months (and potentially higher over 2-3 years), VRT could be a pretty confident long-term buy. Unlike chipmakers facing valuation risks, Vertiv may offer stable growth tied to an urgent need, which one is growing today.
Disclosure: I currently hold no positions in VRT, NVIDIA, Eaton, or Constellation Energy.
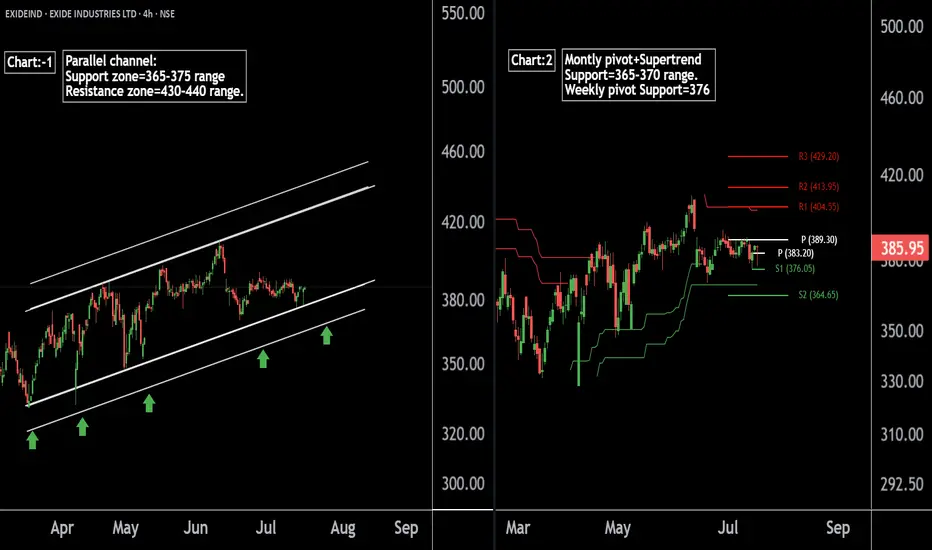
Exide Industries Ready for the Next Bull Run !! Powering Up !!there are two chart of Exide Industries.
In a first chart: EXIDEIND is moving in a well defined parallel channel and currently trading near at support 365-375 range
In the second chart,EXIDEIND is respecting support at both the monthly pivot and the supertrend indicator, with the support zone positioned between ₹365-₹370.
EXIDEIND is currently sustaining below both the monthly and weekly pivot levels at ₹290. As long as the stock does not break above this pivot zone, the momentum is expected to remain weak.
If this level is suatin then ,we may see higher prices in EXIDEIND.
Thank you !!