Vertiv Holdings: Powering the AI ProgressionNYSE:VRT NASDAQ:NVDA NASDAQ:META NYSE:ETN NASDAQ:CEG
While investors are engaged in a race “identify the next major microchip manufacturer”, a quieter opportunity is emerging at the crossroads of artificial intelligence (AI), infrastructure, and long-term demand. Vertiv Holdings (VRT), a company often overlooked amidst the hype, could be the backbone of the AI boom. In a recent NVIDIA earnings call, CEO Jensen Huang dropped a pretty interesting statement: the biggest hurdle for future data centers isn’t chips or regulations- it’s power.
The Power and Cooling Conundrum
AI is no longer some futuristic bet, it’s more like the engine of modern enterprise. Data centers, once powered by modest CPUs, now rely on NVIDIA’s superior GPUs to handle complex, multi-task workloads at scale. But this shift has exposed a critical bottleneck: energy supply can’t keep up with compute demand. Think of NVIDIA’s GPUs as high-performance supercars-powerful yet fuel-hungry, requiring premium infrastructure to operate efficiently. Data centers face challenges like high carbon footprints, downtime risks (recall the $10 billion CrowdStrike outage from a faulty software update), and intense cooling needs due to soaring rack densities.
And this is where Vertiv (VRT) comes in. This company designs and delivers essential infrastructure-uninterruptible power supplies, power distribution units, and advanced cooling solutions (both air and liquid-based)-tailored for data centers, telecom, and industrial clients. If NVIDIA’s GPUs are the brain, Vertiv is the heart and lungs, ensuring these systems run without melting down. The cooling challenge, in particular, is a game-changer. With rack densities exceeding 300kW, traditional air cooling falls short, making Vertiv’s liquid cooling innovations a must-have.
A Strategic Edge: The META-Nuclear Play
The AI race isn’t just about chips- it’s also about the infrastructure to sustain them. A telling sign came from META, which recently inked a nuclear power deal with Constellation Energy. Why nuclear? It offers low-carbon, reliable, 24/7 power with massive capacity-ideal for AI’s energy demands. Yet, Constellation’s deal didn’t address cooling, a gap Vertiv fills perfectly. This collaboration points a broader trend: companies are scrambling to solve power and thermal management issues, and Vertiv is at the forefront of this effort.
Financial Momentum and Analyst Backing
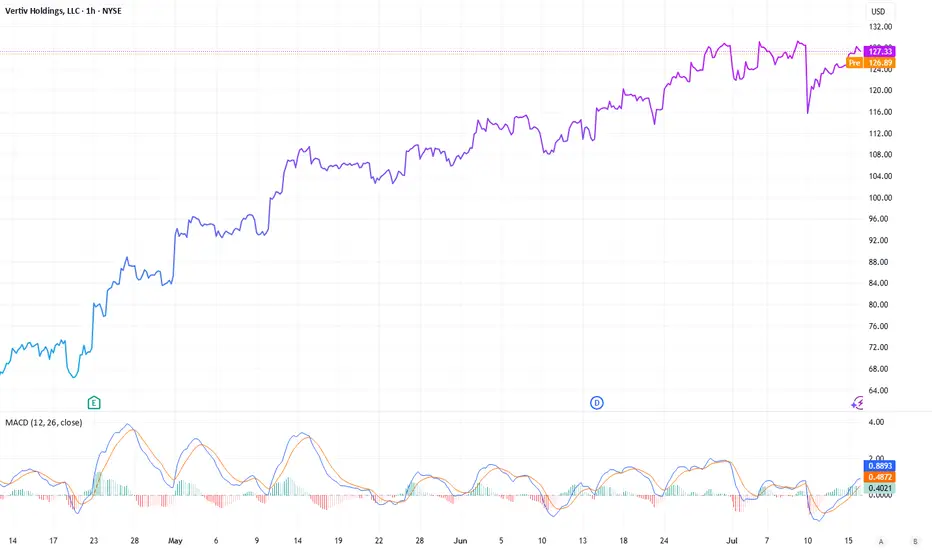
Vertiv’s financials back up its strategic importance. In Q1 2025, the company reported $2.04 billion in revenue-a 25% year-over-year jump, surpassing the $1.94 billion estimate. Adjusted earnings per share hit $0.64, beating the $0.615 forecast. Its backlog soared 50% to $6 billion, signaling robust future demand, while free cash flow margins doubled to 13% ($1.48 billion). Earnings before interest, taxes, depreciation, and amortization grew 22.8%, with a manageable 1.6x leverage ratio and over $350 million annually invested in R&D-much of it for cutting-edge liquid cooling.
Looking ahead, analysts project revenue of $10.76 billion by 2026, with EPS growth of 22% annually and free cash flow reaching $1.6 billion, even as capital expenditure rises to 18.2%. The sentiment is overwhelmingly bullish: Bank of America, Goldman Sachs, and Barclays maintain "Buy" ratings, with target prices ranging from $115 to $130. Oppenheimer, a top analyst, recently raised its target to $132, while 75% of analysts recommend buying, with only 6.3% suggesting a hold or sell.
Outpacing the Market
Since its liberation date of April 2, Vertiv has outperformed its peers. While the S&P 500 grew 11.48%, NVIDIA rose 45.62%, Eaton Corporation 30.26%, and Constellation Energy 48.3%, Vertiv surged 69.8%. Its focus on data centers and AI-driven infrastructure is reflected in this outperformance, with even uranium ETFs (42.41%) tied to nuclear power trends being outpaced. Vertiv’s faster free cash flow growth and direct exposure to AI’s power and cooling bottlenecks give it an edge over cyclical chipmakers.
A Long-Term Buy?
The thesis is simple: AI is already here and it will stay, and the infrastructure supporting it-especially cooling- is important factor in ensuring the rotation of the gears. Vertiv is quietly becoming, lets say, the NVIDIA of infrastructure, leveraging strong financials, analyst confidence, and a critical role in solving AI’s energy crisis. At a current price of $127.37, with targets up to $132 within the next 18 months (and potentially higher over 2-3 years), VRT could be a pretty confident long-term buy. Unlike chipmakers facing valuation risks, Vertiv may offer stable growth tied to an urgent need, which one is growing today.
Disclosure: I currently hold no positions in VRT, NVIDIA, Eaton, or Constellation Energy.
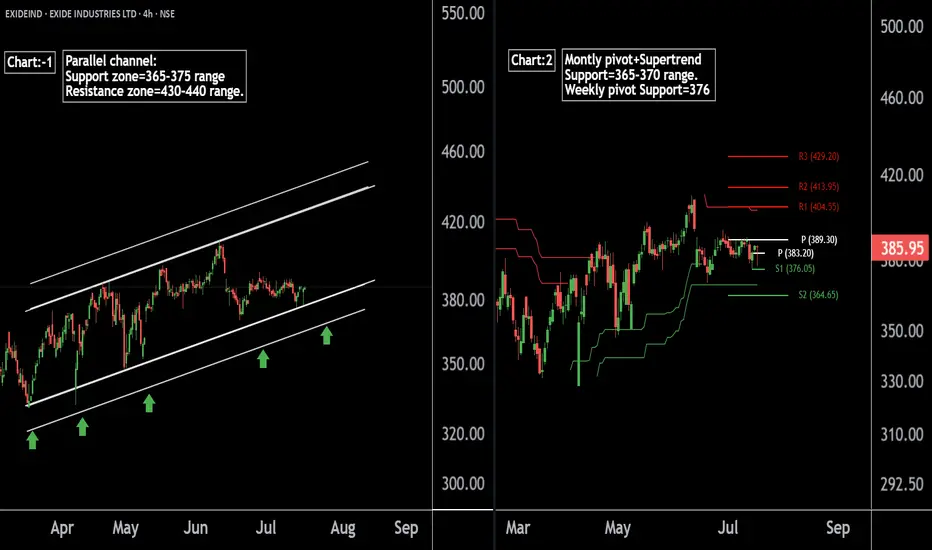
Exide Industries Ready for the Next Bull Run !! Powering Up !!there are two chart of Exide Industries.
In a first chart: EXIDEIND is moving in a well defined parallel channel and currently trading near at support 365-375 range
In the second chart,EXIDEIND is respecting support at both the monthly pivot and the supertrend indicator, with the support zone positioned between ₹365-₹370.
EXIDEIND is currently sustaining below both the monthly and weekly pivot levels at ₹290. As long as the stock does not break above this pivot zone, the momentum is expected to remain weak.
If this level is suatin then ,we may see higher prices in EXIDEIND.
Thank you !!
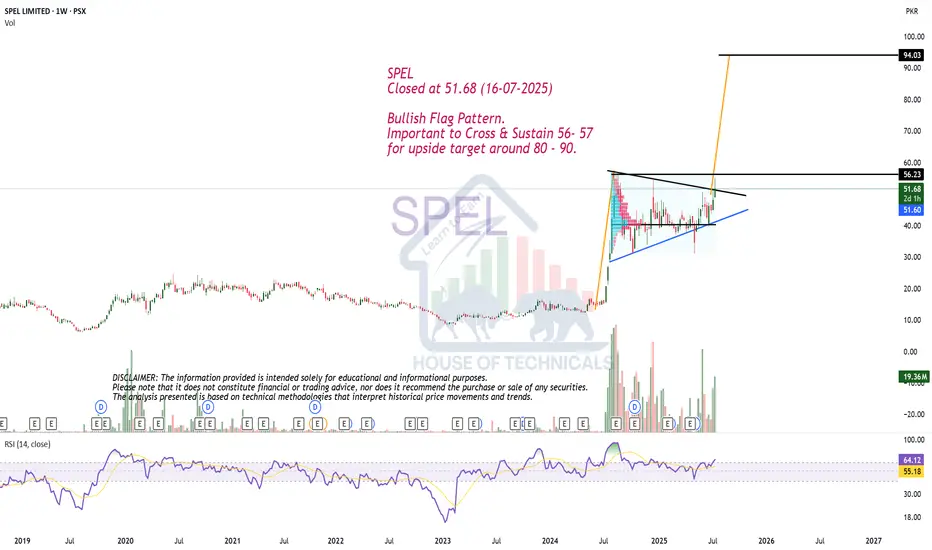
Bullish Flag Pattern.SPEL
Closed at 51.68 (16-07-2025)
Bullish Flag Pattern.
Important to Cross & Sustain 56- 57
for upside target around 80 - 90.
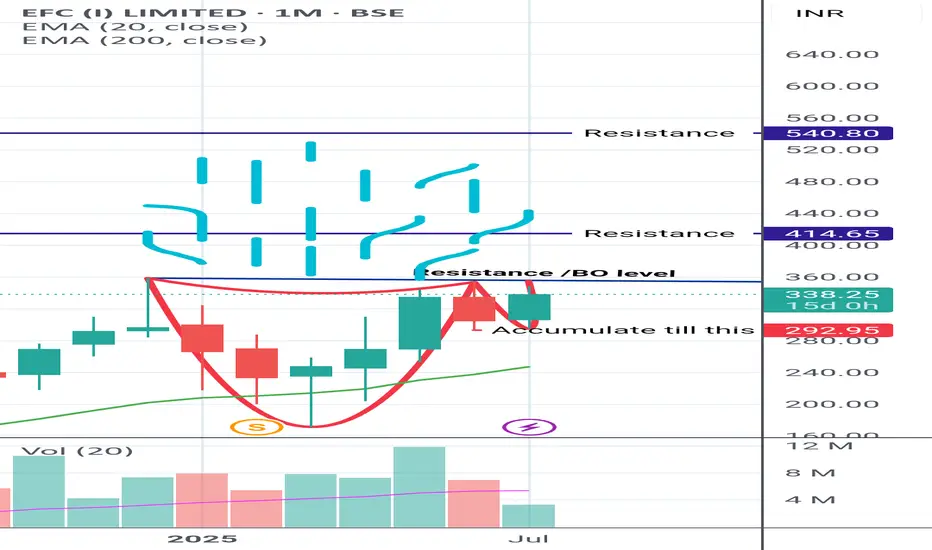
EFCIL is getting hot. Currently on Breakout stage in CUP and HANDLE PATTERN.
On Breakout confirmation,
The marked resistance will be the tgt
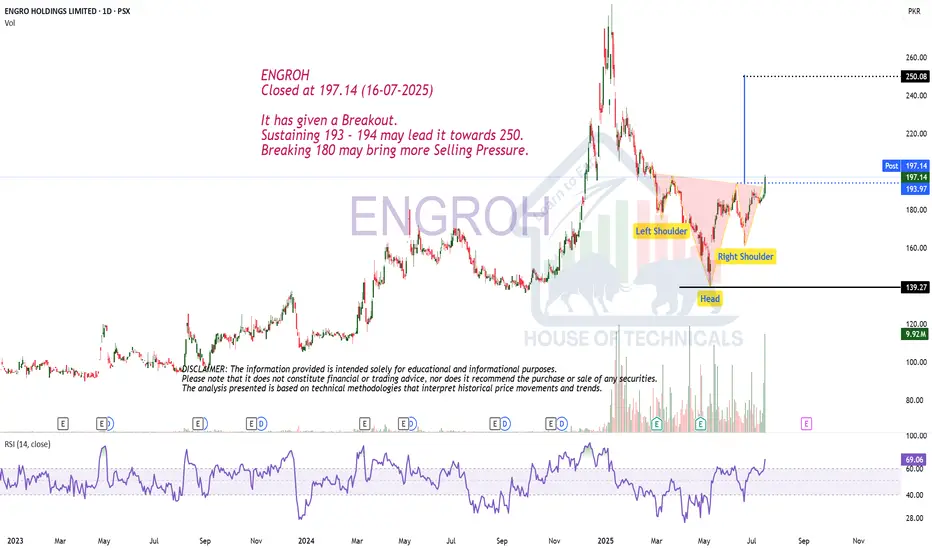
Breakout..ENGROH
Closed at 197.14 (16-07-2025)
It has given a Breakout.
Sustaining 193 - 194 may lead it towards 250.
Breaking 180 may bring more Selling Pressure.
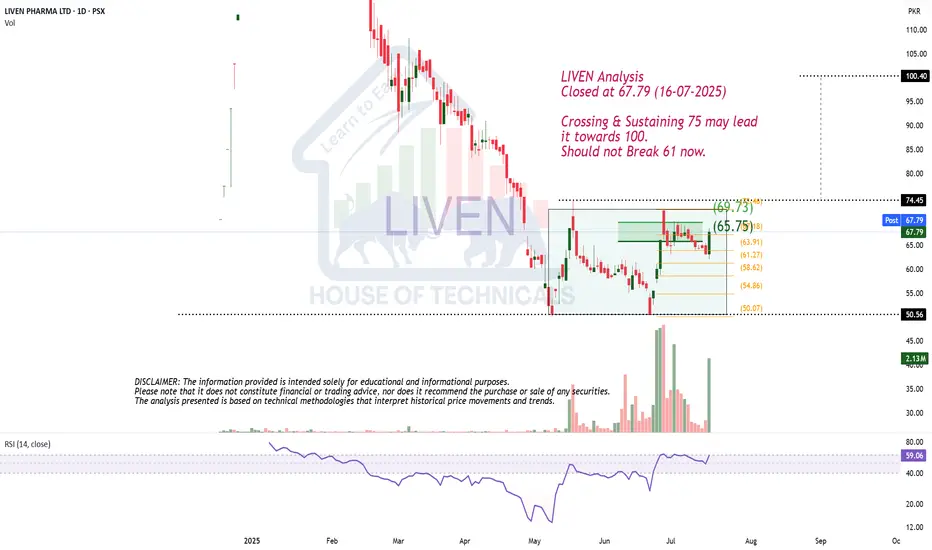
Long SetupLIVEN Analysis
Closed at 67.79 (16-07-2025)
Crossing & Sustaining 75 may lead
it towards 100.
Should not Break 61 now.
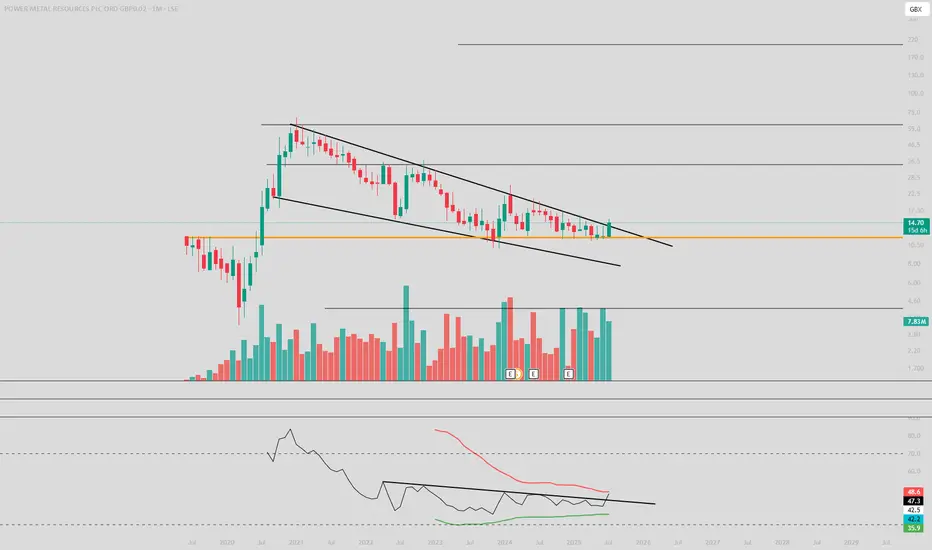
POWER METALHello guys, good ?
POW idea.
Large bullflag breakout. For safe enter, you need to wait monthly candle close.
This stabilisation is very very a good sign.
Levels are clean now.
RSI breakout too.
Good luck :)
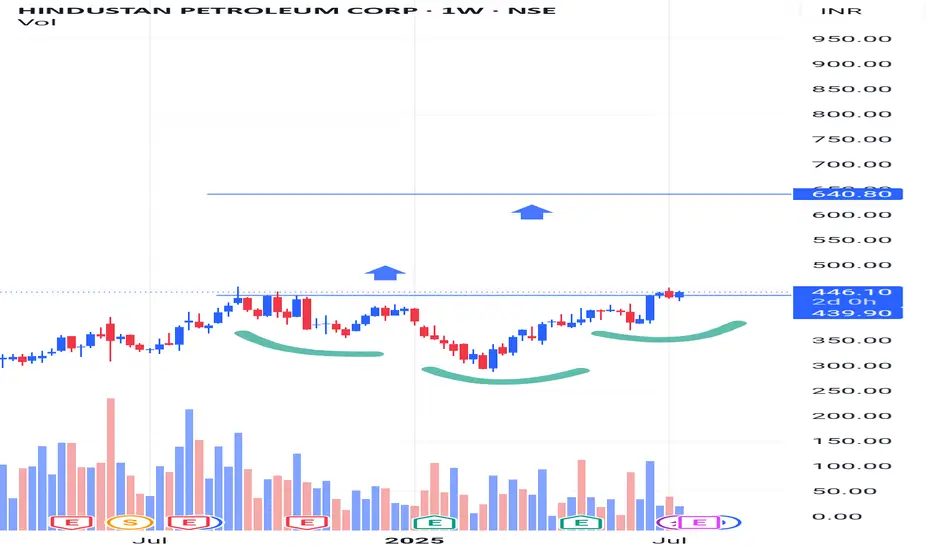
Hindustan Petroleum Corporation LtdHindustan Petroleum Corporation Ltd is mainly engaged in the business of refining of crude oil and marketing of petroleum products, production of hydrocarbons as well as providing services for management of E&P Blocks
Current Price
₹ 446
High / Low
₹ 457 / 288
Stock P/E
14.1
Book Value
₹ 240
Dividend Yield
2.34 %
ROCE
10.5 %
ROE
13.7 %
Face Value
₹ 10.0
Price to book value
1.80
Intrinsic Value
₹ 289
PEG Ratio
0.97
Price to Sales
0.22
Debt
₹ 70,558 Cr.
Debt to equity
1.38
Int Coverage
3.67
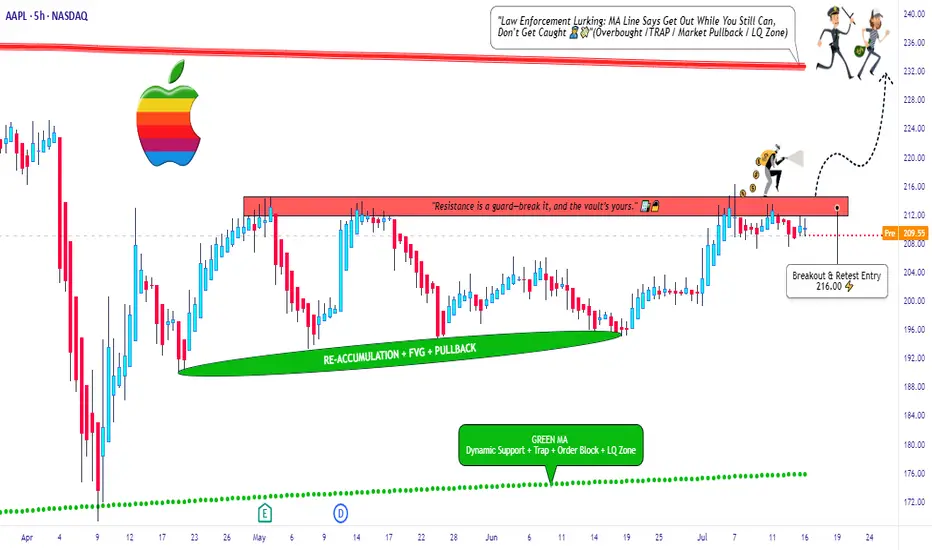
Apple Inc Long Setup – Break, Ride, Exit Like a Pro🕵️♂️💼 “The Apple Heist: Thief Trader's Masterplan for a Clean Escape” 💸🚀
🌟 Hi! Hola! Ola! Bonjour! Hallo! Marhaba! 🌟
Welcome, Money Makers & Market Thieves! 🤑💰💸✈️
This ain’t your average stock analysis — this is a high-level blueprint for the Apple Inc. (AAPL) market heist, built using the Thief Trading Style 🔥📊.
We've scouted the field using a mix of technical patterns, market sentiment, and fundamental fuel, and we’re ready to make our move. The plan is set: go long once the resistance wall cracks, and aim for a clean getaway just before the danger zone hits.
🎯 THE PLAN: INFILTRATE, ESCAPE, PROFIT
Entry Point:
💥 “The vault’s cracking – the breakout begins at 216.00!”
Place Buy Stop orders just above the resistance wall or wait for a pullback to recent swing zones (15M–30M charts work best).
📌 Set your alerts early – you don’t want to miss the opening.
🛑 STOP LOSS - YOUR BACKUP PLAN
🔊 “Listen up, crew: No stop loss until the breakout confirms! Once you’re in, place SL wisely – use the 4H swing low (200.00). Your risk, your rules. Don't get caught slippin’.”
📍 Adjust SL based on lot size, entry volume, and trade size. Protect your stash.
🏁 TARGET ZONE:
🎯 Heist Target = 232.00
(Or bail early if the heat's on – you know the drill.)
⚠️ SCALPERS & SWINGERS
💸 Long side only – don’t fight the wave.
🧲 Scalpers: Get in, grab the cash, trail the stop.
📈 Swing Traders: Hold firm. This setup has legs.
🔎 WHY WE’RE ROBBING THIS CHART:
Apple’s bullish momentum is fueled by:
📌 Strong institutional sentiment
📌 Earnings strength
📌 Index rotation and positioning
📌 COT data & macro tailwinds
Get the full scope: fundamentals, macro outlook, positioning data, sentiment, and intermarket dynamics 🔗📊.
Stay sharp – stay informed.
📰 NEWS ALERTS & POSITION MANAGEMENT
🚨 Avoid new entries during high-impact news releases.
🏃 Use trailing SLs to lock profits and exit clean.
💖 BOOST THE CREW — STRENGTH IN NUMBERS
🚀 Hit that BOOST button if this helped you steal a profitable trade. Your support powers our heist team.
Let’s keep making money the Thief Way – with style, planning, and confidence. 🎉💪🏆
📌 NOTE FROM HQ:
This analysis is for educational purposes. It’s not personalized financial advice. Manage your trades responsibly. Conditions can shift quickly — stay updated and flexible. Stay in the shadows and move smart. 🐱👤
💬 Drop a comment, hit like, share with your gang – the market's a vault, and we’re the codebreakers.
See you on the next heist, Thief Fam. 🤑🔥🕶️💼
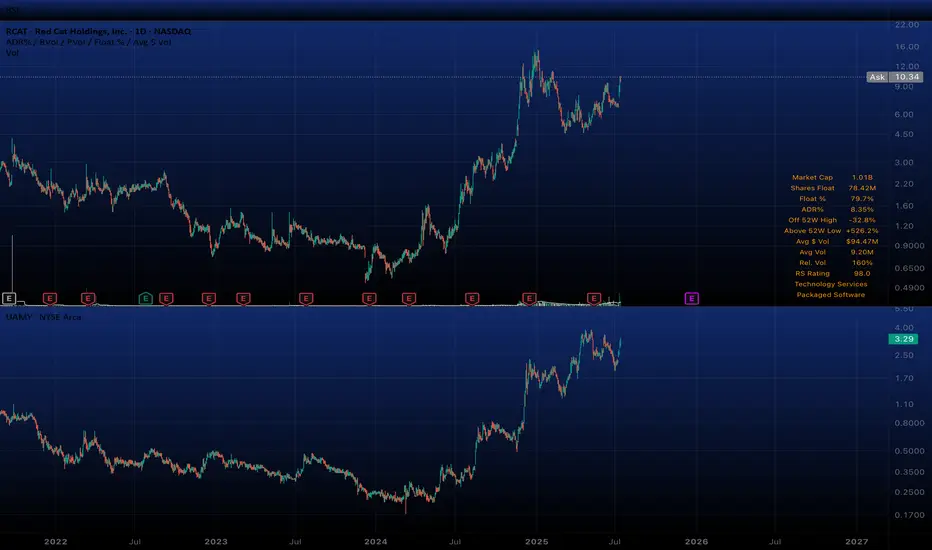
$RCAT $UAMY LONGNASDAQ:RCAT AMEX:UAMY
“If you’re good at something, never do it for free.”
AND one of the hardest you should learn things to judge is what level of risk is safe.
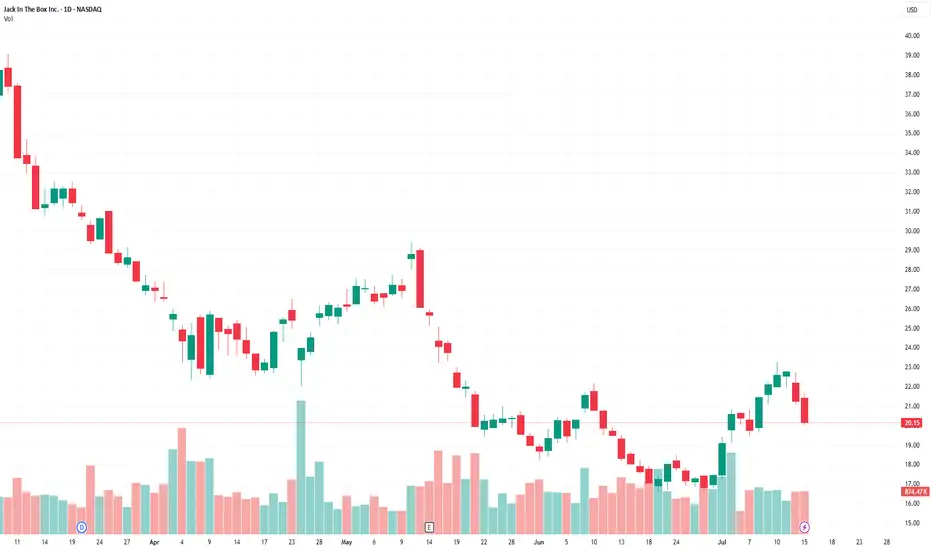
Jack in the Box (JACK)Consumer Discretionary - Restaurants
Buy the dip: strategic plan, a number of shorts and the institutional interest.
Supporting Arguments
Strategic transformation program.
Large number of shorts and high dividend yield.
Interest of a large investor.
Jack in the Box, Inc. (NASDAQ: (JACK) operates of two chains of quick-service and fast-casual restaurants, with a total number of 2,600. The Jack in the Box segment offers a classic burgers. The Del Taco segment focuses on both Mexican and American. The company was founded in 1951 and is headquartered in San Diego, CA.
Investment Thesis
Strategic transformation plan. The company grew its revenue at a double-digit rate in 2021–2023, but since last year, revenue has been declining. The debt burden has begun to grow and has reached a critical level of more than $1.7 billion, or 5.1x LTM EBITDA. Amid the problems, the CEO resigned.
The company announced a restructuring plan, which includes closing 150–200 unprofitable restaurants, and selling the Del Taco chain entirely to reduce debt by $300 million is not ruled out. It is also planned to increase online sales from the current 12.5% to 25%. The EBITDA margin of the online segment is planned to increase to 15%.
A large number of short positions and a dividend. Short interest is 4.48 million shares, or about 25% of shares in free float and 5 average daily trading volumes. Closing the short may lead to a strong short-term increase in quotes. The dividend yield is about 6%, however, due to the need to save, it cannot be ruled out that the company will cut the dividend in the near future.
The interest of a large investor. The company's capitalization is $420 million, it has not been so cheap since the COVID-19 pandemic, and before that in the early 2010s. Quotes have fallen almost 5 times from the maximum, which creates a good opportunity for a takeover by a large player. The Biglari Capital Corp. fund, which controls almost 10%, has already taken advantage of the stock correction and intends to increase its share. However, the Board of Directors is currently taking measures to counter a hostile takeover, hoping to cope with the crisis on its own.
We recommend to BUY a JACK shares with the target price of $935, which implies a 60 upside. To mitigate potential losses, it is advised to implement a stop-loss at $16.90.
The Case for Solar Tracker Infrastructure (NXT) NASDAQ:NXT
THE CONCEPT
Superficially, the solar infrastructure sector appears to be just another subset of the cyclical renewable energy market, heavily influenced by commodity pricing, subsidies, and Chinese overcapacity. This view, while partially accurate, overlooks a deeper dynamic now unfolding in the utility-scale solar ecosystem: the emergence of solar trackers, specifically Nextracker (NXT), as a default layer of infrastructure that enhances energy yield, drives project economics, and becomes essential to capturing IRR in large-scale solar development.
The true attraction of companies like NXT lies not in their participation in the solar value chain but in their ability to compound earnings by becoming the default standard in project infrastructure. As utility developers increasingly seek higher ROI and shorter time-to-completion, tracker systems with proven yield enhancements and robust reliability are becoming indispensable. What began as a technological upgrade is now evolving into an infrastructure platform with software-defined margins, long product lifecycles, and embedded switching costs.
If this dynamic is recognized by investors, NXT may undergo a valuation re-rating, as happened with other asset-light infrastructure providers in the past. The process is potentially self-reinforcing: tracker adoption increases → project IRRs improve → developers standardize on proven providers → NXT backlog and margins grow → investor recognition expands → valuation multiple rises → NXT scales further, increasing its data advantage and competitive moat.
ANALYTICAL APPROACH
The conventional method of evaluating solar-linked equities—projecting demand growth for solar installations and then applying a valuation multiple based on cyclical earnings—is insufficient in this case. NXT’s trajectory is not merely a function of solar penetration; it depends critically on its ability to convert adoption into infrastructure entrenchment. The valuation multiple itself reflects investor understanding of this transition.
Instead of isolating earnings and then applying an arbitrary multiple, we analyze the self-reinforcing process of tracker adoption, profitability, and recognition. We identify three interlocking drivers:
The effective return on solar projects equipped with tracker systems
The penetration rate of trackers in utility-scale solar globally
Investor recognition of NXT as a long-term infrastructure platform rather than a cyclical solar component supplier
THE SCENARIO
Act One: The Emergence of the Infra Layer (2023–2025)
At present, the effective return on utility-scale solar projects is entering a new phase. While panel prices continue to decline due to Chinese oversupply (falling below $0.16/W in the U.S.), project economics are improving due to two compounding forces: rising electricity demand (particularly from AI, EVs, and data centers) and software-enhanced yield optimization from tracker platforms.
NXT's tracker systems, enhanced by machine-learning algorithms like TrueCapture, are capable of increasing energy yield by 15–25%, a material change in IRR for developers. Meanwhile, the total cost of tracker systems has declined enough to reach mass adoption thresholds, especially in markets like the U.S., where NXT holds a 57% share. Tracker usage in new U.S. projects now exceeds 95%, while global adoption is climbing from 40–45%.
Investor recognition is still partial; NXT trades at ~15x earnings despite 30% EPS growth and a $4.5B backlog. The process has just begun, but the initial indicators of self-reinforcing dynamics are visible.
Act Two: Recognition and Rerating (2025–2027)
As demand for electricity continues to grow and renewable installations scale with it, tracker systems become default components in new builds. Developers now see tracker-equipped plants as the norm, not an upgrade. Projects from 2025 onward increasingly retroactively upgrade from fixed-mount systems.
Investors begin to grasp the role of NXT as a high-margin infrastructure provider. The shift in narrative—from cyclical solar to embedded utility infrastructure—leads to a re-rating. Price-to-earnings multiples begin to reflect platform-like characteristics: recurring software revenue, long product cycles, data network effects, and entrenched customer relationships. The company’s moat, built on both hardware reliability (30-year durability) and proprietary software trained on years of operational solar data, becomes widely recognized.
Investor multiples compress slightly to reflect maturity but remain above historical solar averages due to sticky revenue, data leverage, and infrastructure resilience.
EVALUATION
The shakeout is still years away. Until then, NXT is positioned to benefit from a global shift in energy infrastructure. The real risk at present is not from saturation but from investor miscategorization. If NXT continues to be treated as a cyclical solar stock, it may remain undervalued despite strong fundamentals and compelling growth.
The key vulnerability lies in the macro environment. Should global renewable demand stall due to policy reversals (e.g., rollback of IRA credits), or should Chinese entrants successfully replicate NXT’s software and reliability at scale, the thesis may weaken. However, even in such cases, the cost structure of tracker-enhanced solar remains globally competitive, and NXT’s backlog and historical performance offer downside protection.
Yet, it must be acknowledged that current market sentiment favors nuclear-related equities, driven by political narratives of energy security and bipartisan support for nuclear expansion. Nuclear stocks are being re-rated on the expectation of long-term baseload reliability, even though their LCOE remains higher and their construction timelines are far longer than utility-scale solar. This sentiment bias may delay investor recognition of NXT’s strategic role as an infrastructure platform.
If the self-reinforcing process plays out as expected, NXT could deliver the compound benefits of scale, margin expansion, and multiple re-rating. The capital appreciation potential mirrors the early phases of other infrastructure transitions—cable, fiber, datacenter REITs—where early recognition translated into multiyear equity outperformance.
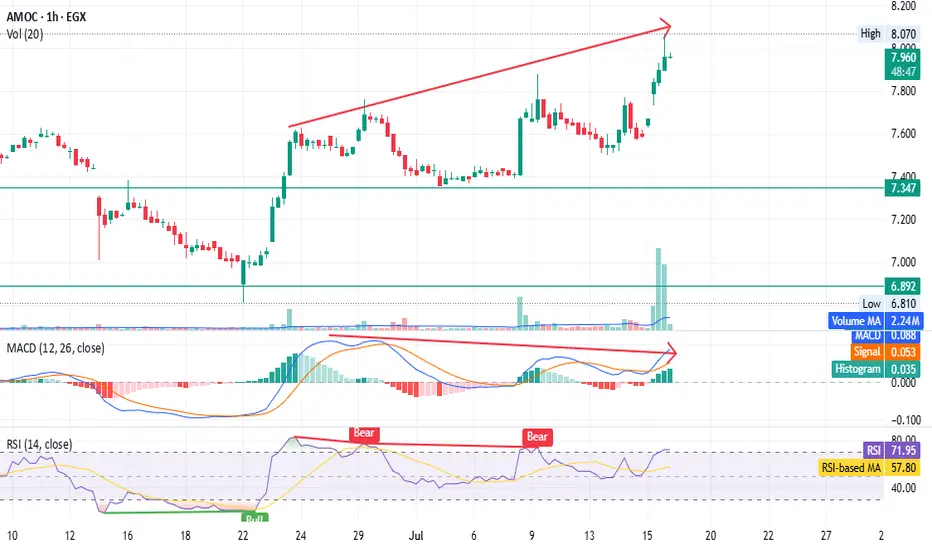
AMOC - Beware of the bear trap - only for shareholders EGX:AMOC timeframe: 1 hour
Prices continue to rise, forming a higher top than the previous one,
but MACD shows a negative divergence.
RSI indicates bearish dominance despite the price increase.
High volume with a gap, unsupported by other indicators, suggests possible distribution.
Stop loss (profit-saving) at 7.62.
This is not financial advice, just our analysis based on chart data. Consult your account manager before investing.
Thanks and good luck!
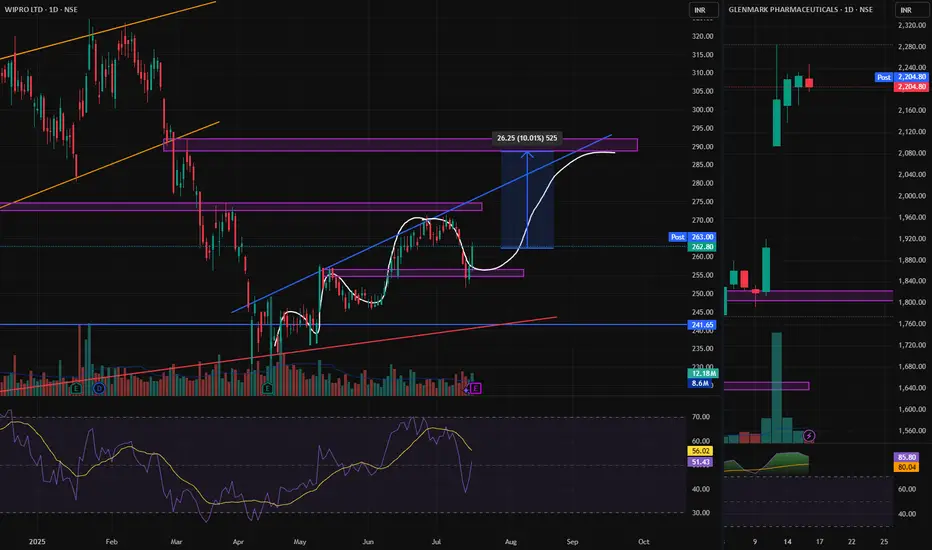
WIPRO, CREATING NEW HIGHER HIGHWIPRO, Creating new higher high pattern, this can reward us with 10% return in few weeks. mark the levels and plan your trade.
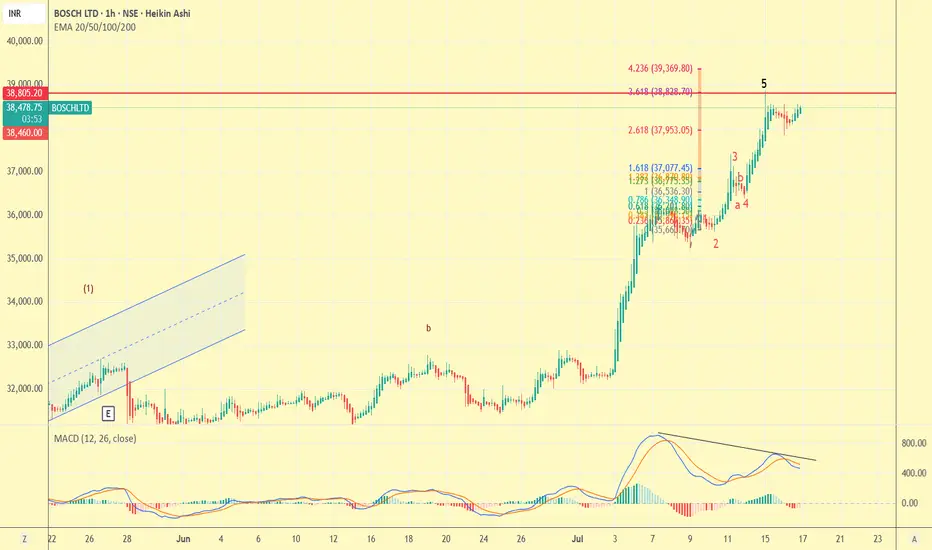
bosch-sell on riseas visible completion of 5th wave and negative div . It would be good if one books profit and enter at lower level or may use trailing stoploss .
Currently in a Consolidation Zone.ANL Closed at 8.06 (24-06-2025)
Currently in a Consolidation Zone.
6.90 - 7.0 seems to be an Important Support
Level.
Bullish Divergence on Bigger tf.
Immediate Resistance is around 10.50 & then
around 13 - 13.50

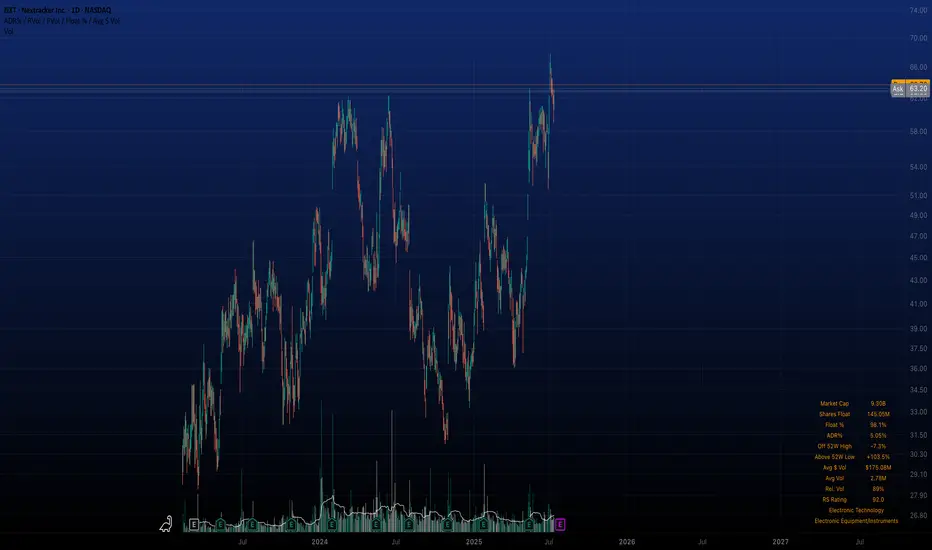
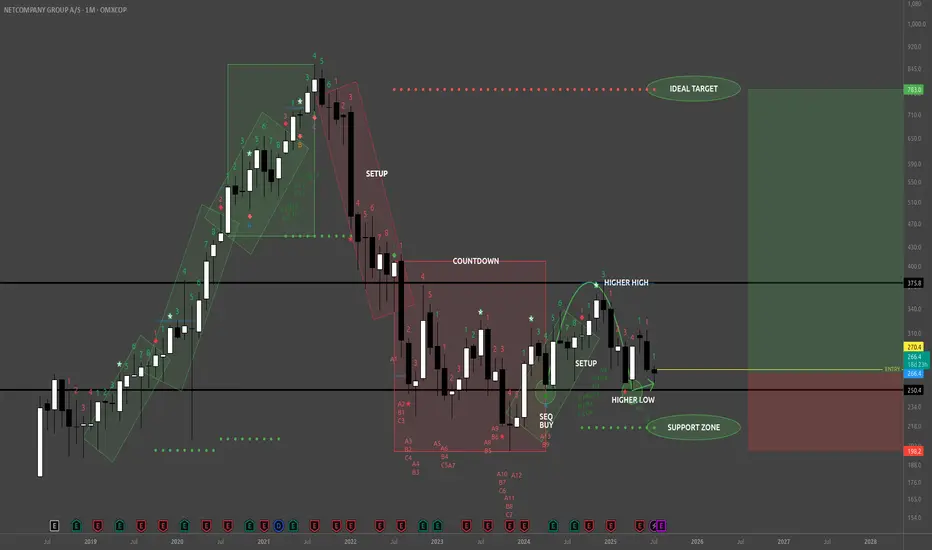
NETC - BuyReading the NETC Monthly chart from the left to right look at that remarkably strong bullish trend (green rotated rectangles) which spanned 3 consecutive TD 1-9 Setups. That's 9 strong months of uptrend culminating in the beginning of the bearish trend with a TD Sequential 13 Sell signal at the apex, a Bearish Engulfing Pattern, and a large Doji immediately preceding the TD 1-9 Setup (red rotated rectangle) which exhausted the downward momentum, and dissipated the downward momentum with the TD Sequential 13 Buy signal (first green circle).
From the TD 13 Buy signal (first green circle) buyers created a higher high, followed by 4 consecutive red TD counts, whose bearish implications were disrupted by the strong Bull Sash pattern. I really like this spot for opening a long position. One caveat is that the Weekly TD Buy Setup is on 7/9 so the next two weeks could bring the price lower, potentially even tapping the TDST support zone, but whether that happens or not look left on the chart everywhere from my entry price and below. This is all wholesale pricing territory!
TDST up at 783 is a nice upside target just shy of the ATH traders will be gunning for.
Now on fundamentals here's where things are really nice. NETC just bought themselves the Danish IT banking company SDC (for 1 Billion DKK) which serves about 100 Nordic banks. That's going to be bringing in sticky, recurring revenues in a critical financial sector. NETC revenues are also not materially tied to the U.S., and doesn't rely on American consumer sentiment, regulatory policy, or supply chains.
Whether price falls from here or not I'm holding on to my shares until this pays off big. Maybe this is a trade for your trading temperament too.
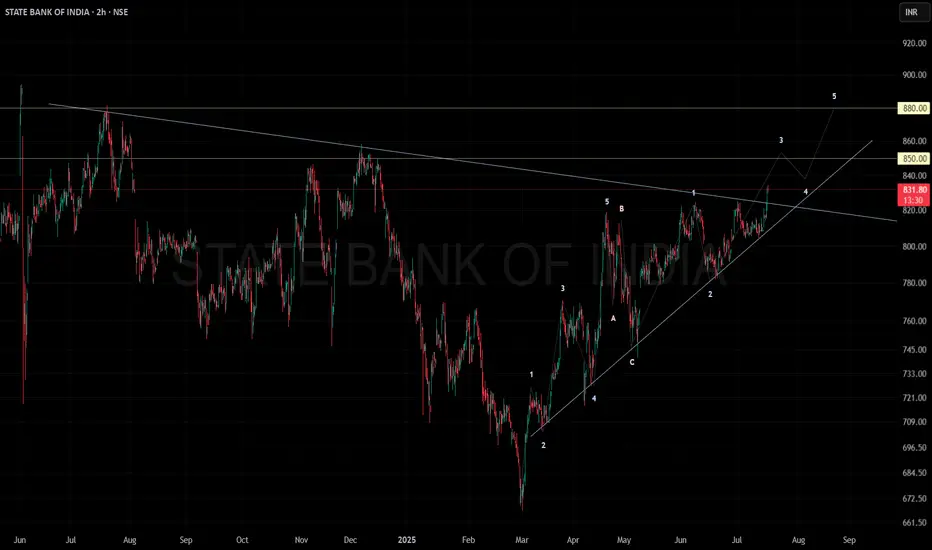
STATE BANK OF INDIA IN A BULLISH MOMENTUMThe technical setup suggests bullish momentum with Elliott Wave supporting continuation higher. Key upside levels are ₹850 and ₹880, as long as the price holds above trend support near ₹820-₹830. A failure below this zone would weaken the bullish outlook.
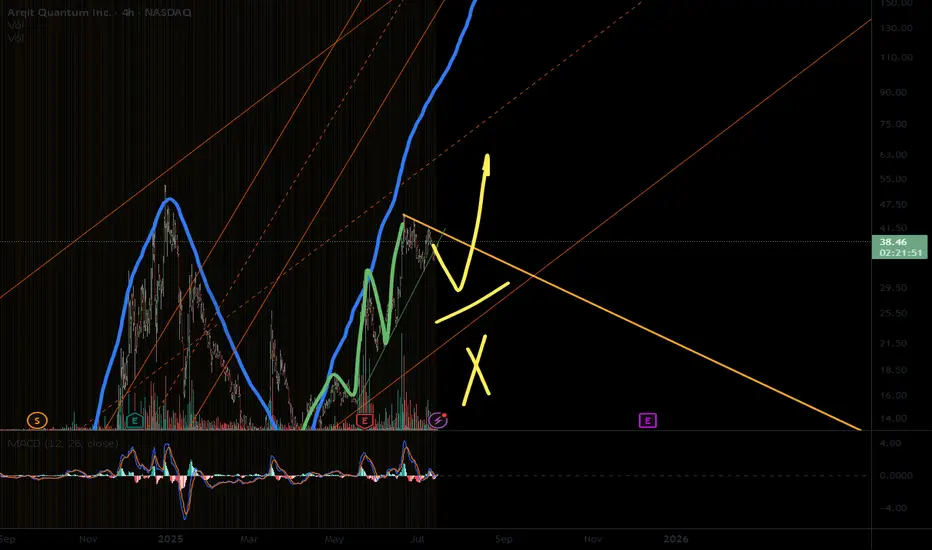
ARQQ setup of mine3 impulses form first bigger,
now the pull back is considered.
Global weakness meets the pullback,
none of first waves cut the prev high,
only second let to pass by,
bottom channel might get nagged
If we make it we will strive,
but only to the (chan) half,
then I see a good bye, not buy.
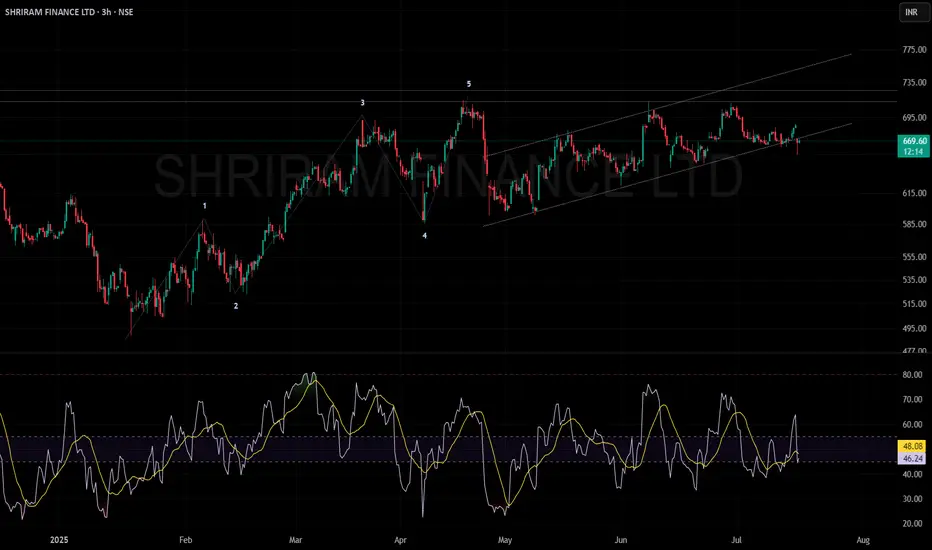
SHRIRAM FINANCE LIMITED in a channelThe stock experienced a strong bullish move (5-wave uptrend), currently consolidating inside an upward channel.
Price is facing resistance near ₹700–₹735.
The momentum indicator (RSI) suggests no extreme buying or selling; trend is neutral to cautiously bullish unless a clear breakout or breakdown occurs.
Support: Lower channel boundary (~₹660).
Resistance: ₹700–₹735.
Strong move above resistance could signal further upside; a break below the channel may indicate a corrective decline.
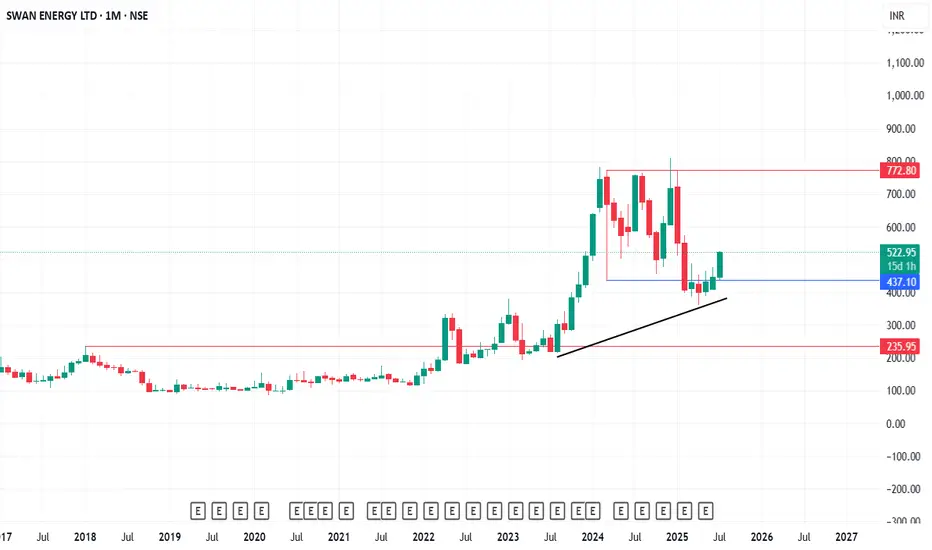
Swing trade monthly ...swan energy swan energy seem to be taking support at a major support level ....
this stock seem to be a swing long
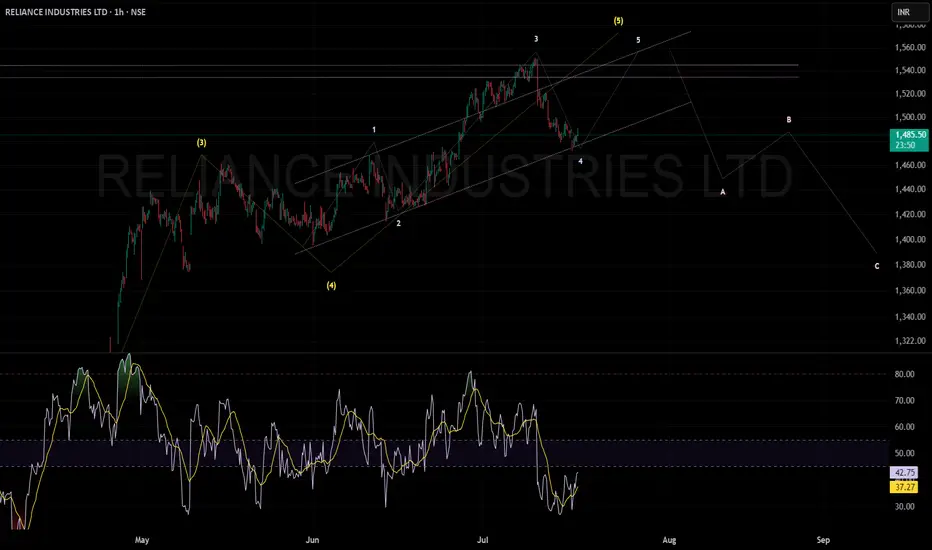
RELIANCE INDUSTRIES CAN MOVE UP IN 5TH WAVEReliance Industries appears poised to complete its final bullish wave with an upward move toward 1550, following which a corrective retracement is likely.