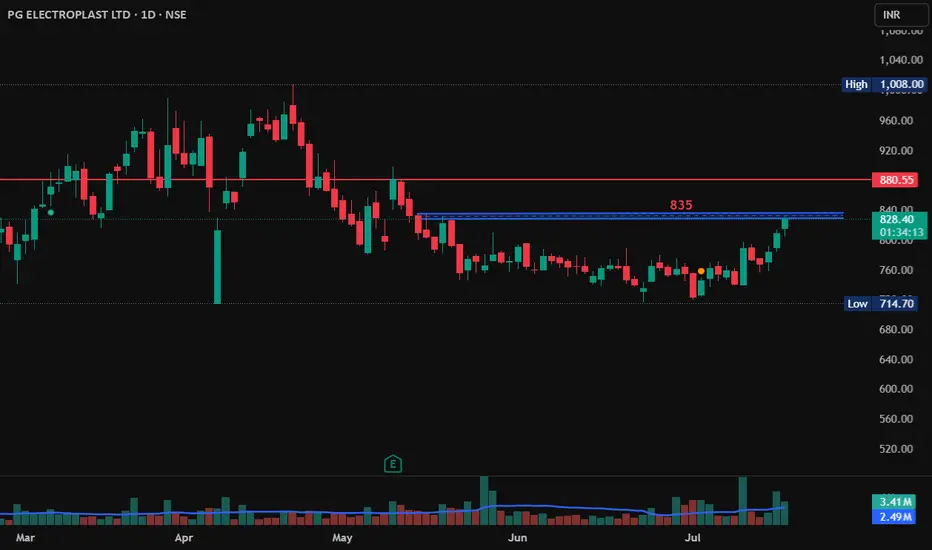
PGEL High Volumes, Breakout, LongPGEL is showing good buying volumes in last 3 sessions. If it crosses and sustains 835 with Bullish candlestick pattern then buy at 835.
Entry: 835
Target1: 880
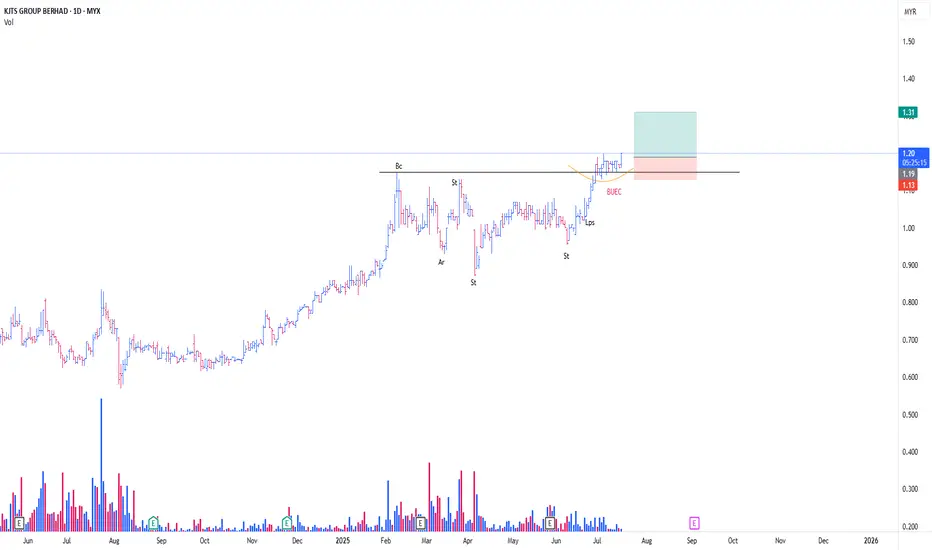
KJTS CONT MARKING UPThis is just a continuation of my prev thesis
**please refer to the link below
Turned out, KJTS formed Type #2 Schematic of Reaccmulation (Rising Bottom)
As it looks now, current price action seems to be confirming BUEC
**Buec is part of Phase D of Wyckoff Event
Noticed the formation of Feather's Weight (Yellow Line), coincided with BUEC
Bought a position today in view of Trigger Bar
Ep + SL as attached
PureWcykoff
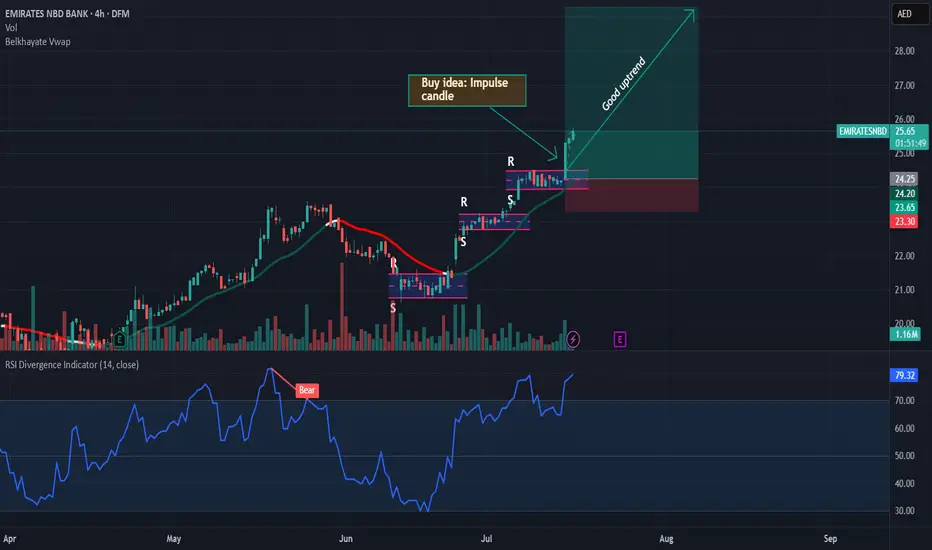
EMIRATES NBD BANK: Good uptrendOn EMIRATES NBD BANK we can see a nice impulse candle which has broken the resistance line with force. This means that buyers have further confirmed their supremacy over sellers. With this breakout we would have a nice continuation of the upward trend.
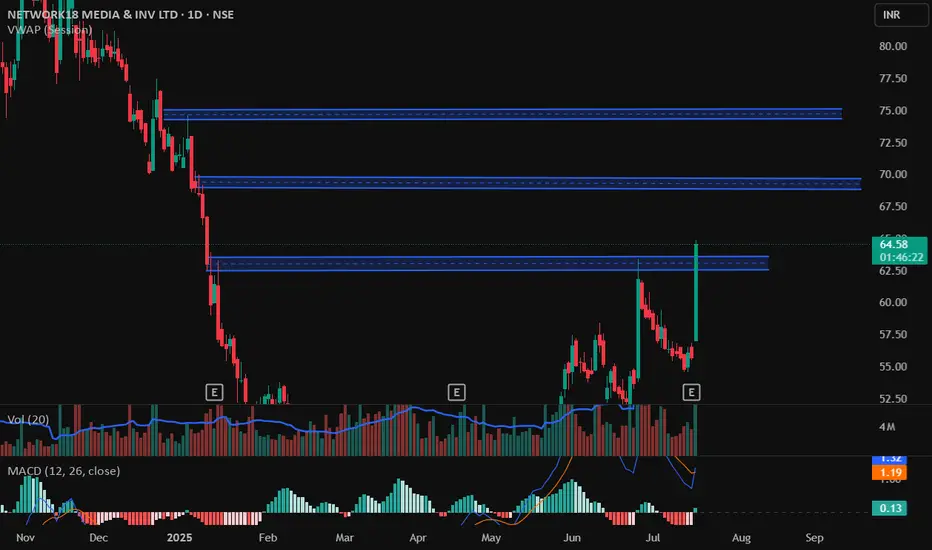
Breakout 1D, Long Trade, Short TermA very nice breakout in Network18 with high volumes. If it sustains this and shows a Bullish candlestick pattern then go long on this stock.
Entry level - 65 - 65.5
Target 1: 70
Target 2: 75
SL : 63
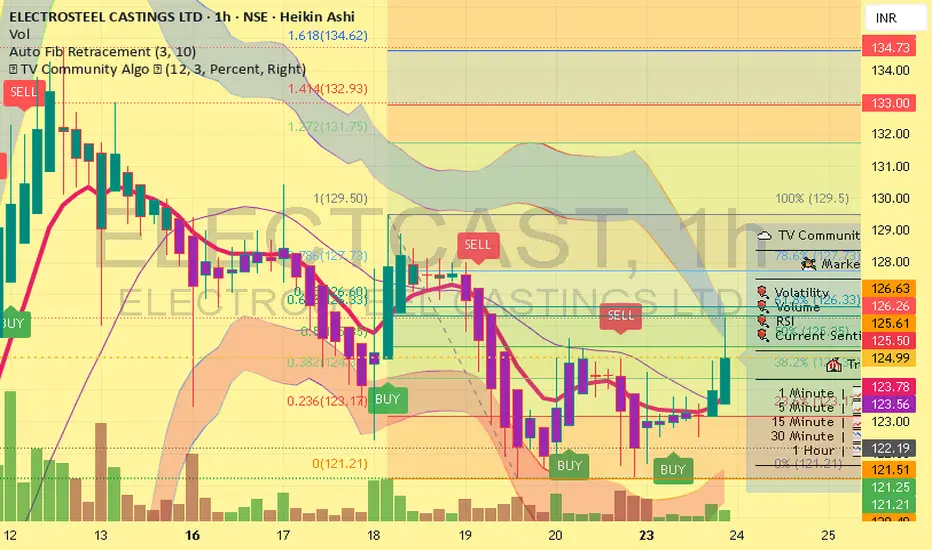
buy ELECTCAST BUY ELECTROSTEEL for the tgt of 1, RS 135 2, 175 AND 3, 235 with SL 120 time frame NEXT 1 YEAR
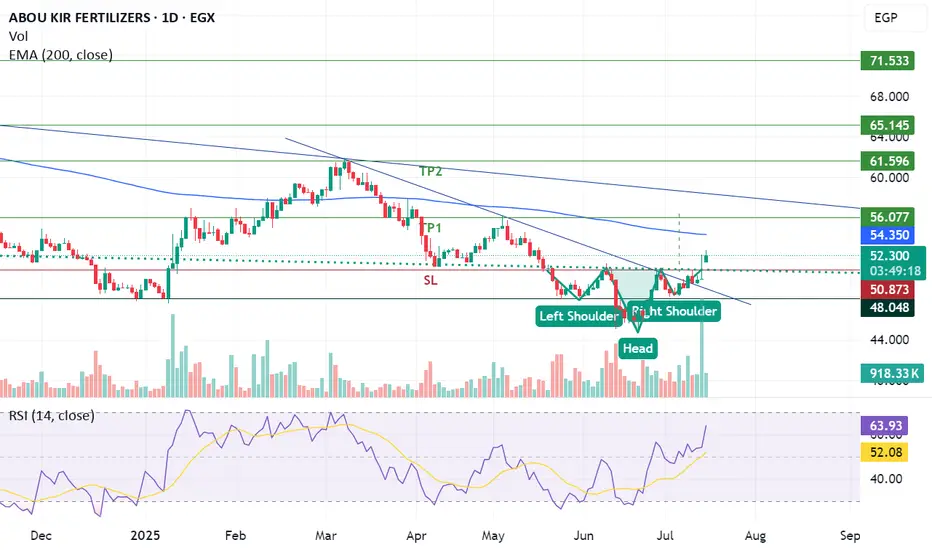
Breakthrough inverted head and shoulders and downtrend lineABUK has successfully breakthrough inverted head and shoulders pattern and downtrend resistance line supported with volume exceeding average 30 days allowing the stock to achieve the below targets:
- Potential buy range: 51 - 51.5
- TP1: 56
- TP2: 61.5
- SL: below 50.70 "Require confirmation"
SAMMAAN CAPITAL LTD. trading in a consolidation zone.Sammaan Capital Ltd. is currently in a decisive zone on the weekly charts. For a trend change confirmation:
Short-term traders: Wait for a weekly close above ₹145.
Long-term investors: Look for a sustainable breakout above ₹175 to target the ₹280–₹300 zone.
Bearish bias: A close below ₹100 can signal further weakness.
Given the weekly timeframe, these moves may take time to materialize. Closely monitor weekly closes and volumes for early indications of a trend shift.

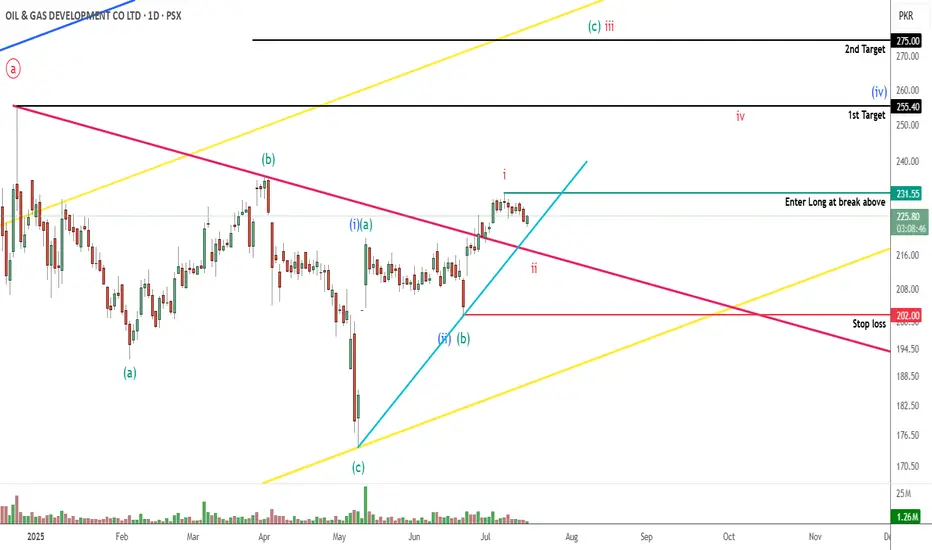
OGDC PROBABLY IN WAVE ' B ' OR ' C ' - LONGThis is in continuation to our ongoing tracking of OGDC wave structure.
If our wave count is correct then prices will take support from the 220-210 levels and will target the upside level of 255 and 275. Our wave count suggest that prices might even go above 300+ but that depends on how strong the bullish move is, if the move stays strong then price will target the upper yellow trendline.
Alternately, if price goes below the 202 level, it will take price well below 174.
We will buy 25% positions at 220-210 levels (ideally 218-216) and 75% at the break above 231.56
Trade Setup:
Entry level: 217 & 231.56
Stop loss: 202
Targets:
T1: 255
T2: 275
T3: Yellow trendline
Let see how this plays, Good Luck!
Disclaimer: The information presented in this wave analysis is intended solely for educational and informational purposes. It does not constitute financial or trading advice, nor should it be interpreted as a recommendation to buy or sell any securities.
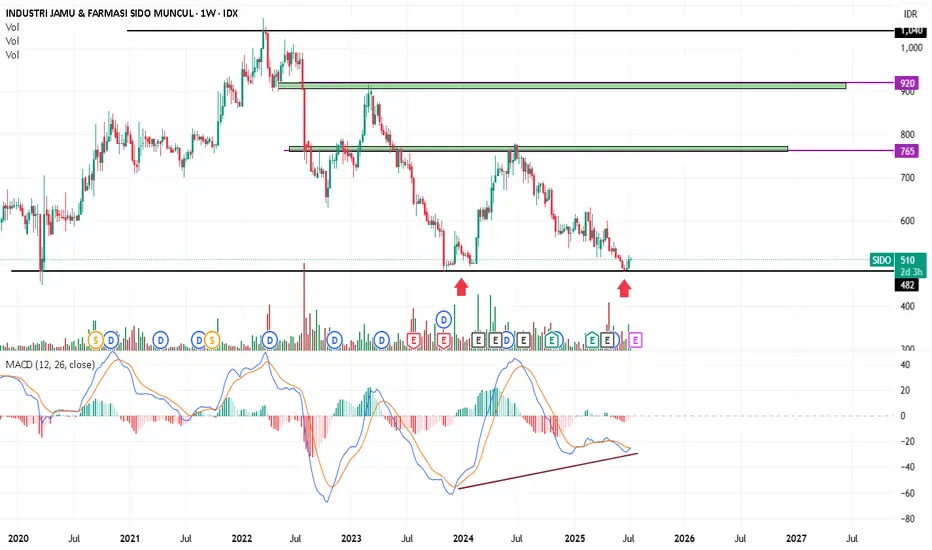
sidoDISCLAMER !!!!
You can buy now with a stop-loss of 480.
Divergence is likely.
Medium-term hold.
TP1: 765
TP2: 920
Before the Judge: Turmoil in Silicon ValleyIon Jauregui – Analyst at ActivTrades
Zuckerberg Takes the Stand
This week, Mark Zuckerberg appears as a witness in a civil lawsuit worth $8 billion, in which the governance of Meta Platforms (NASDAQ: META) is under scrutiny following the well-known Cambridge Analytica scandal. The plaintiffs — shareholders of the company — argue that decisions were made without proper board oversight, directly affecting the company’s value and corporate governance.
The trial also implicates other high-profile figures, including former executive Sheryl Sandberg, investor Marc Andreessen, Palantir Technologies (NYSE: PLTR) co-founder Peter Thiel, and former Netflix (NASDAQ: NFLX) chairman Reed Hastings. The central question is whether Meta’s board exercised independent and effective oversight in handling the crisis.
Temasek Reshapes Its Strategy in India
Singapore’s sovereign wealth fund, Temasek, has announced a shift in its investment strategy: fewer deals, but with higher concentration and larger individual commitments. Its current exposure in India exceeds $50 billion, and the fund believes the local market has matured enough to allow for easier entry and exit of capital.
Companies that could attract attention include major players such as Reliance Industries (NSE: RELIANCE) and Tata Consultancy Services (NSE: TCS)—key actors in sectors like technology, telecommunications, and financial services. Temasek values not only India’s economic growth, but also the opportunities for scalability and sector diversification.
Banking Sector Eyes Mergers
In the financial sector, Northern Trust (NASDAQ: NTRS) has drawn market attention amid speculation of a possible approach by BNY Mellon (NYSE: BK). A more flexible regulatory framework from the Federal Reserve has rekindled interest in M&A activity across the U.S. banking industry.
Major banks such as JPMorgan Chase (NYSE: JPM), Bank of America (NYSE: BAC), and Goldman Sachs (NYSE: GS) are closely monitoring the landscape, while regional players like PNC (NYSE: PNC), U.S. Bancorp (NYSE: USB), and Truist (NYSE: TFC) could also engage in strategic transactions aimed at improving efficiency and increasing market share.
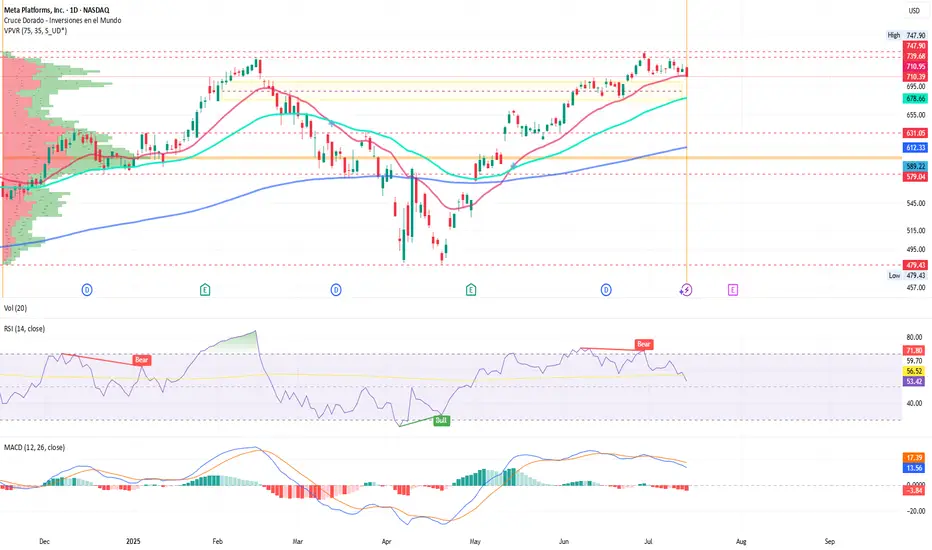
META in Focus: Technical Analysis
After reaching all-time highs in June near $747.90, Meta Platforms shares have slightly corrected, entering a consolidation phase around the 50-day moving average, which now acts as a key technical support level.
From a technical standpoint:
The price remains above the 50-day moving average since the golden cross in May, preserving the medium-term bullish structure.
The RSI stands at 53.42%, indicating a consolidation phase with no clear overbought or oversold signals.
Immediate support: $688 (100-day moving average)
Key support: $631, just above the point of control around $600
MACD: indicates short-term bearish pressure
Resistance: recent highs suggest a potential double top
A breakdown below the current support area could increase downside pressure, while a breakout above the all-time high, supported by volume, would resume the bullish trend toward new highs. The ongoing trial may bring short-term volatility, although much of the reputational risk appears to have been priced in by the market. Over the long term, investors continue to assess Meta’s strategic positioning in artificial intelligence, digital advertising, and virtual reality.
Conclusion
Silicon Valley is navigating a phase of heightened scrutiny—both in courtrooms and financial markets. As tech companies adjust their strategies and international funds recalibrate their positions, sectors like banking are preparing for potential consolidation. In this context, regulatory risk, governance, and strategic efficiency will remain key drivers in the performance of major U.S. corporations in the coming quarters.
*******************************************************************************************
The information provided does not constitute investment research. The material has not been prepared in accordance with the legal requirements designed to promote the independence of investment research and such should be considered a marketing communication.
All information has been prepared by ActivTrades ("AT"). The information does not contain a record of AT's prices, or an offer of or solicitation for a transaction in any financial instrument. No representation or warranty is given as to the accuracy or completeness of this information.
Any material provided does not have regard to the specific investment objective and financial situation of any person who may receive it. Past performance and forecasting are not a synonym of a reliable indicator of future performance. AT provides an execution-only service. Consequently, any person acting on the information provided does so at their own risk. Political risk is unpredictable. Central bank actions can vary. Platform tools do not guarantee success.
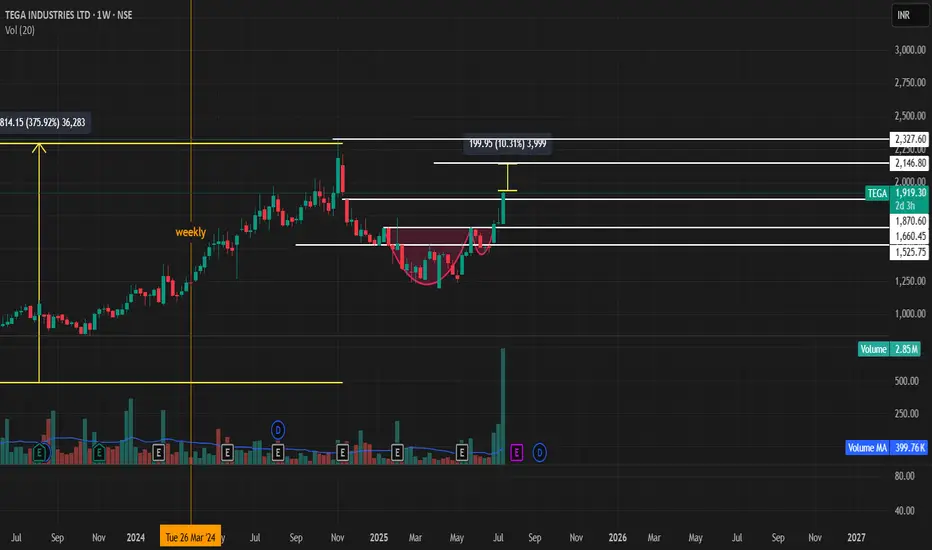
**Tega Industries – Breakout Setup (Cup with Handle Pattern)****Tega Industries – Breakout Setup (Cup with Handle Pattern)**
**Chart Pattern Identified**:
A **Cup with Handle** formation has been identified on the daily/weekly chart of **Tega Industries**, signaling a potential bullish breakout. This classic continuation pattern typically leads to strong upward moves once the handle breakout is confirmed.
---
### 🔍 **Breakout Levels and Price Targets**
1. **Primary Breakout Level – ₹1660**
* This marks the neckline of the **Cup with Handle** formation.
* A confirmed breakout and tgt ₹2,145 would validate the pattern.
(based on the measured move from the depth of the cup added to the breakout point)
2. **Secondary Breakout Level – ₹1,875**
* Acts as a **pre-breakout resistance** or consolidation level.
* A **daily or weekly close above ₹1,875** with strong volume would indicate early momentum and buyer interest.
* **Target after this level is breached**: ₹2,145 (primary breakout zone), and if sustained, an extended target of **₹2,530**.
---
### 📌 **Technical Outlook**
| Level | Significance | Action |
| ------ | ------------------------ | --------------------------------------------------- |
| ₹1,875 | Secondary breakout level | Watch for strong close with volume; bullish trigger |
| ₹1660 | Cup with handle breakout | Key confirmation zone; breakout of pattern |
| ₹2,530 | Extended target | Projected move after full breakout confirmation |
---
### 📈 **Trade Strategy**
* **Entry Option 1**: Anticipatory buy near ₹1,875.
* **Entry Option 2**: Breakout confirmation buy above ₹1875 with higher risk-reward toward ₹2,530.
* **Volume Confirmation**: Essential at both ₹1660 and ₹1875 levels.
* **Stop-loss**: Dynamic trailing stop-loss below handle lows or breakout support zones depending on entry.
---
### ⚠️ **Risk Management & Considerations**
* Ensure confirmation via **volume expansion** and **daily/weekly close** above key breakout zones.
* Be cautious of false breakouts, especially if moves happen on low volume or during broader market weakness.
* Monitor sectoral momentum (capital goods, engineering, or mining equipment) as it may influence breakout strength.
---
Would you like me to generate a chart snapshot or help you set up price alerts or trading logic based on this setup?
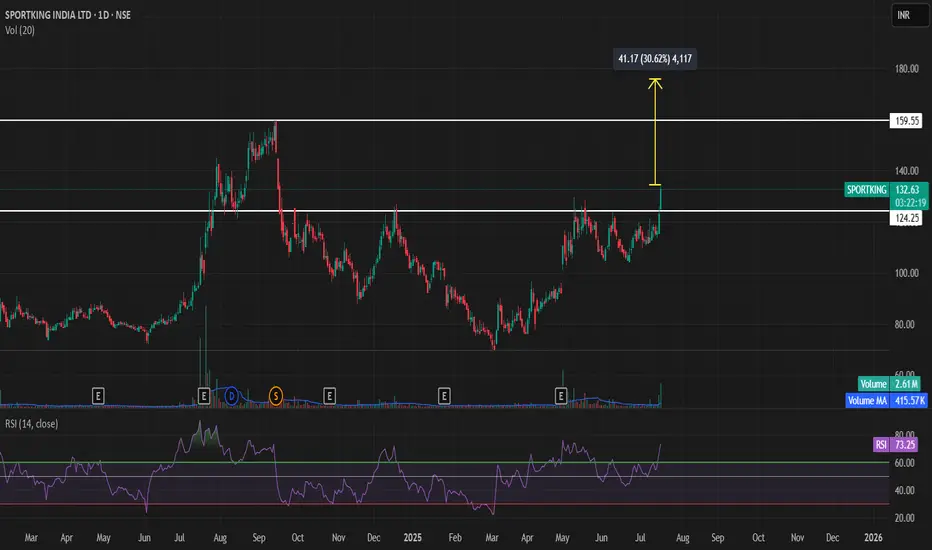
sportking technical breakout gain 30% sportking technical breakout gain 125 is major support and tgt is 30% gain at cmp price , cmp price is 132.65, please check
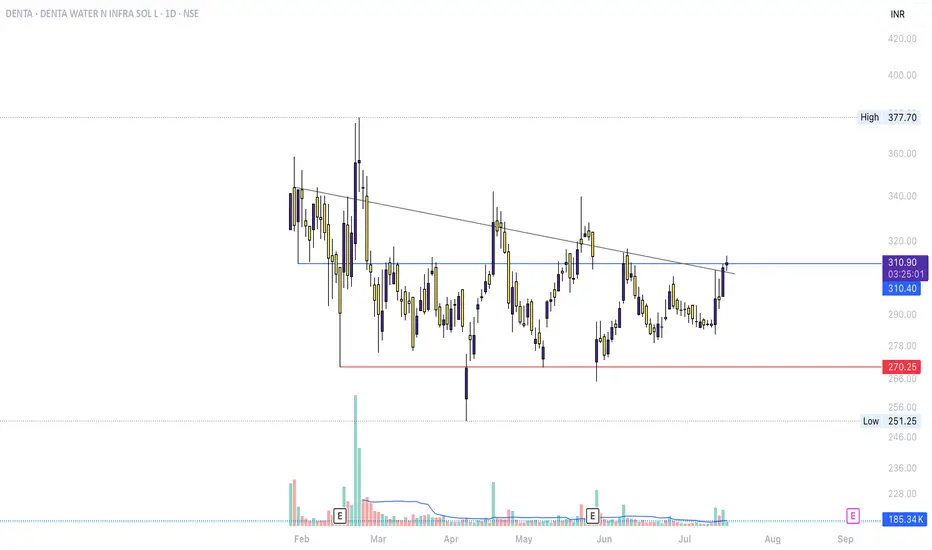
DENTA – SMC & Breakout Structure Analysis (Jul 2025)Accumulation/Distribution: Long consolidation near ₹270–₹311
Break of Structure (BOS): Trendline breakout + recent close above prior top
Neutral toward Bullish: Awaiting volume and price action confirmation to validate trend shift
1. Defined Range Structure
Support ~₹270 (red line) holding over 4+ months
Resistance ~₹311–₹315 (blue line) tested multiple times before today
2. Possible Breakout Attempt
Price has breached the descending trend line—an early mark of bullish structure shift
Close is marginally above resistance, but lacks volume confirmation for breakout validation
3. Volume & Confirmation
No substantial volume spike yet—breakouts typically require accompanying volume
Watch for multi-session closes above ₹315 with sustained volume to support continuation
4. Pullback as an Opportunity
Retracing into ₹305–₹310 could form a higher-low
Such a move would align with healthy trend behavior, offering clearer structure and stronger validation
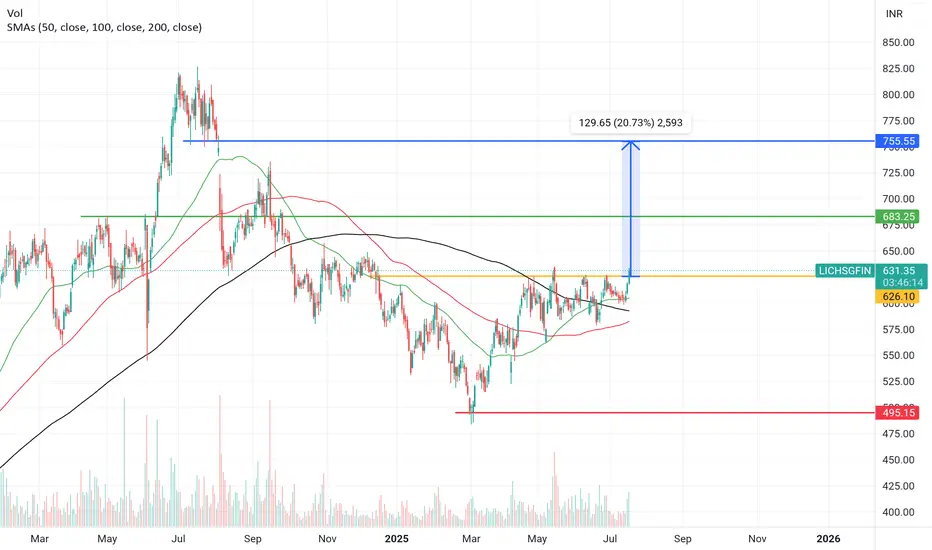
Complex Cup & Handle pattern break out in lic housing finance Lic housing finance given break out from 620 level .It's formed a complex Cup Handle pattern .1st target will be arround 680 & final target will be 750.
It's not a buy or sell recommendation , For educational purpose only.
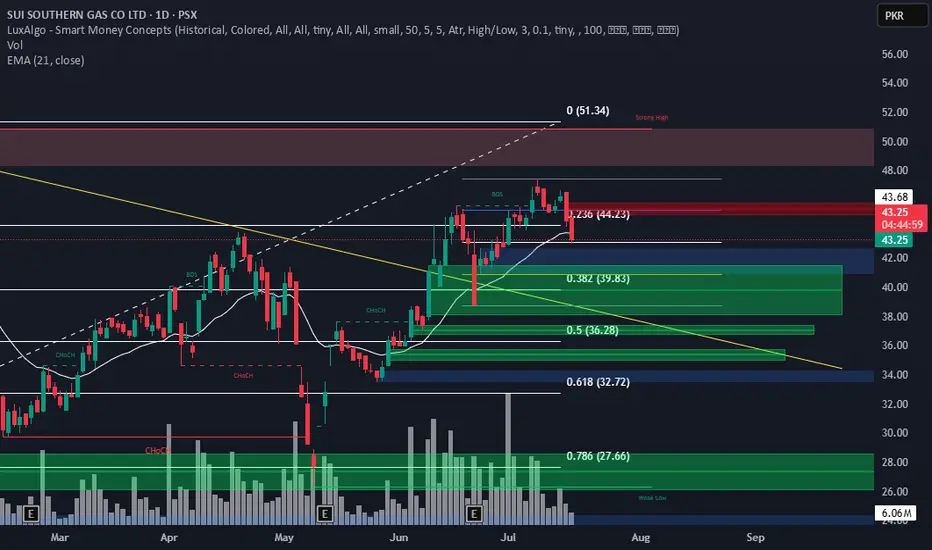
SSGC DAILY CHART BUYING OPPORTUNITY41.50 is a good price to buy SSGC. This analysis is sharing for educational purpose only.
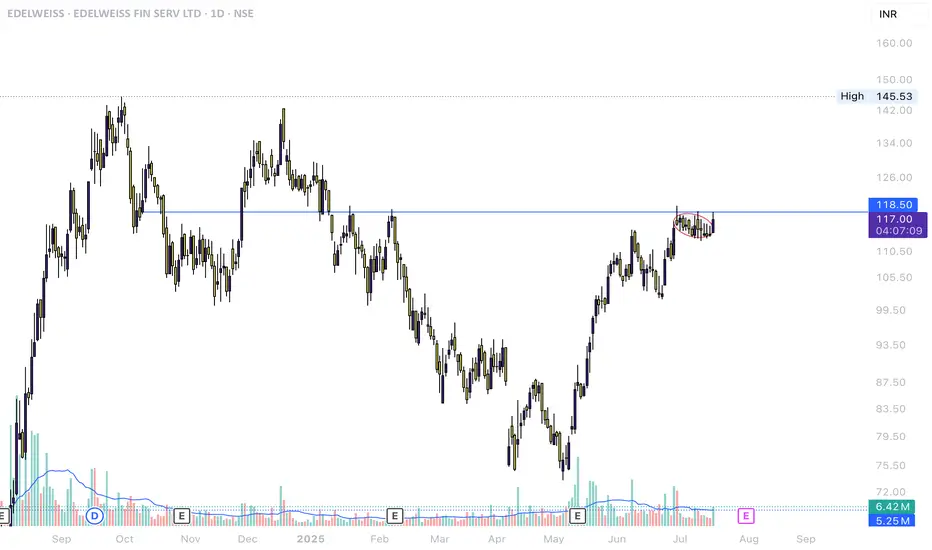
EDELWEISSAfter a strong uptrend , Price consolidated near the resistance forming a tight closing base
Price is breaking out of the range.
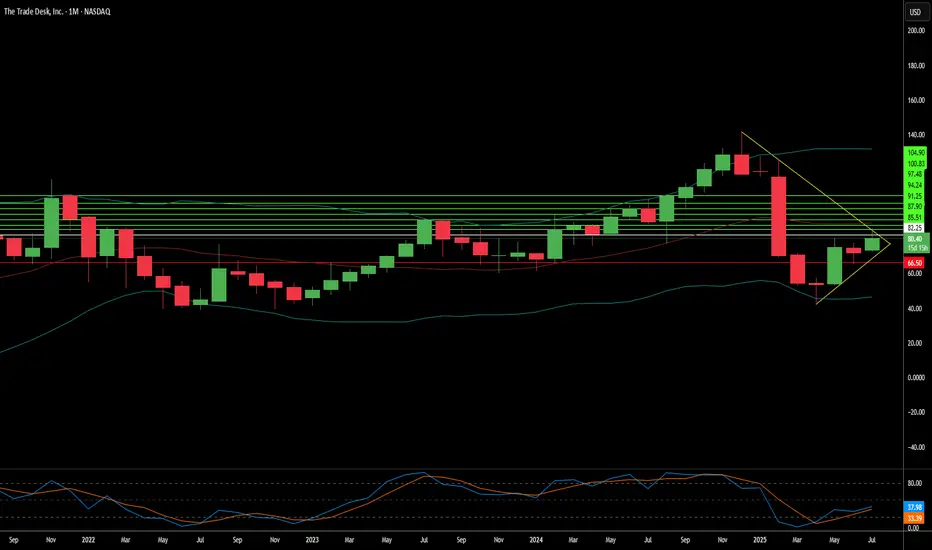
The Trade Desk: Why the Sudden Surge?The Trade Desk (TTD) recently experienced a significant stock surge. This rise stems from both immediate market catalysts and robust underlying business fundamentals. A primary driver was its inclusion in the prestigious S&P 500 index, replacing Ansys Inc. This move, effective July 18, immediately triggered mandated buying from index funds and ETFs. Such inclusion validates TTD's market importance and enhances its visibility and liquidity. This artificial demand floor, coupled with TTD's $37 billion market capitalization, underscores its growing influence within the financial landscape.
Beyond index inclusion, TTD benefits from a significant structural shift in advertising. Programmatic advertising is rapidly replacing traditional media buying, expected to account for nearly 90% of digital display ad spending by 2025. This growth is driven by advertisers' need for transparent ROI, publishers avoiding "walled gardens" through platforms like TTD's OpenPath, and AI-driven innovation. TTD's AI platform, Kokai, greatly lowers acquisition costs and enhances reach, resulting in over 95% client retention. Strategic partnerships in high-growth areas like Connected TV (CTV) further reinforce TTD's leadership.
Financially, The Trade Desk demonstrates remarkable resilience and growth. Its Q2 2025 revenue growth of 17% outpaces the broader programmatic market. Adjusted EBITDA margins hit 38%, reflecting strong operational efficiency. While TTD trades at a premium valuation - over 13x 2025 sales targets-its high profitability, substantial cash flow, and historical investor returns support this. Despite intense competition and regulatory scrutiny, TTD's consistent market share gains and strategic positioning in an expanding digital ad market make it a compelling long-term investment.
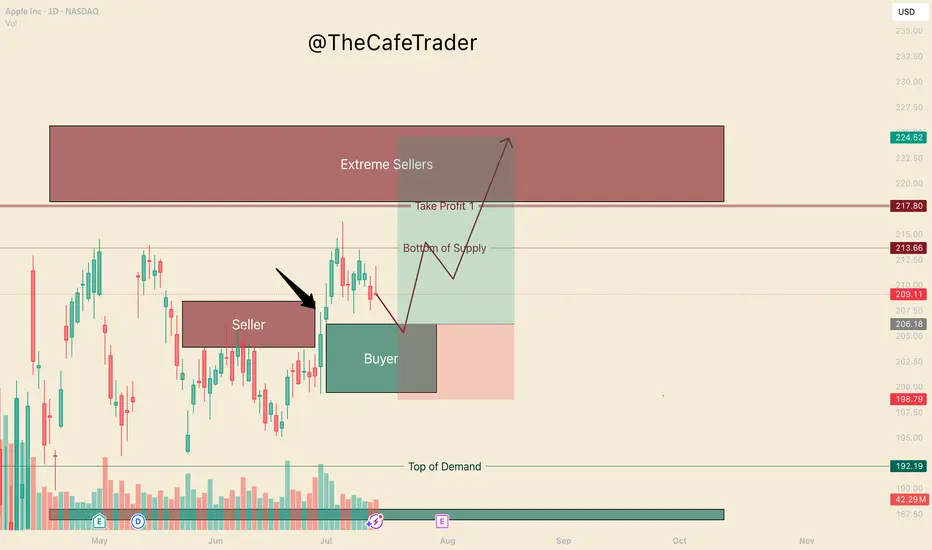
APPL. Bulls are in ControlHello, I’m TheCafeTrader.
This post is for technical traders looking to capitalize on short swings and options.
What you’re seeing here are supply and demand zones — areas where liquidity is concentrated. These levels are identified using a system built around footprint data, order flow, and market imbalances.
🔹 Key Observation:
I’ve marked a seller that price has now broken above. This tells us that buyers have overpowered a sell-side participant, and are now likely targeting deeper liquidity in the $218–$225 range.
🔹 On Apple’s Behavior:
Apple can be slow and choppy at times. So, if you’re trading options, consider going as close to the money as possible and give yourself some time on the contracts.
🔹 New Buyer in the Market:
Between $199–$206, a new aggressive buyer has stepped in. This player appears to be pressuring the first line of sellers (labeled “beginning of supply”).
🟢 My Expectation:
I expect AAPL to pull back to around $206 before catching a bid. As long as price holds above $199, buyers remain in control. In this range, I anticipate further accumulation by bulls.
🔸 Take Profit Levels:
• First TP: Just before the major selling cluster around $218
• Final TP: Deep inside the seller zone near $223
⸻
📊 Follow for more short-term analysis. This week, we’re covering both short- and long-term views of the MAG 7.
⸻
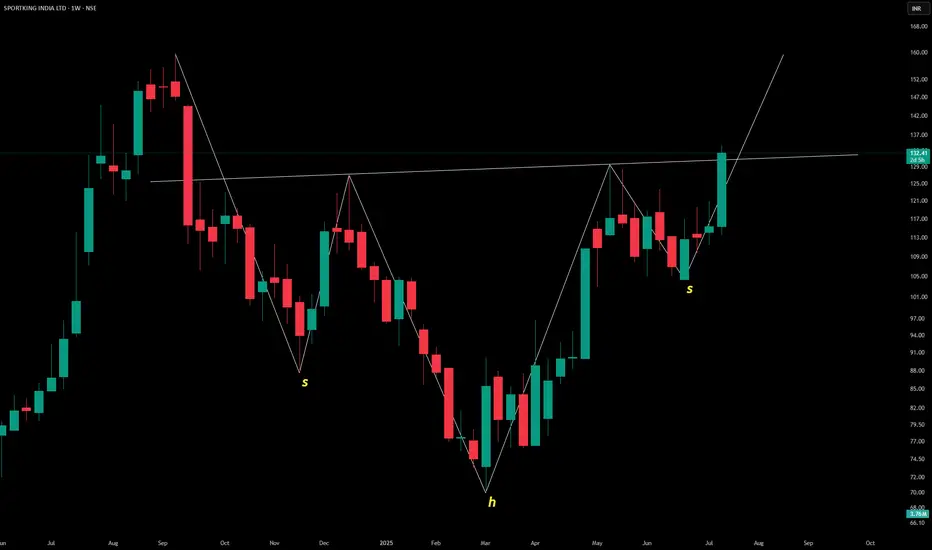
SPORTKING INDIA LTD – Inverted Head & Shoulders Pattern
The weekly chart shows a classic **inverted head and shoulders** formation:
- 👈 **Left Shoulder**: Shallow trough
- 🔽 **Head**: Deep central low
- 👉 **Right Shoulder**: Higher trough mirroring the left
Price action around ₹132.48 suggests a potential **bullish reversal**, indicating that the prior downtrend may be bottoming out. A breakout above the neckline would typically confirm upward momentum—worth watching for volume confirmation and resistance levels.
Let me know if you’d like projected targets or neckline levels next!
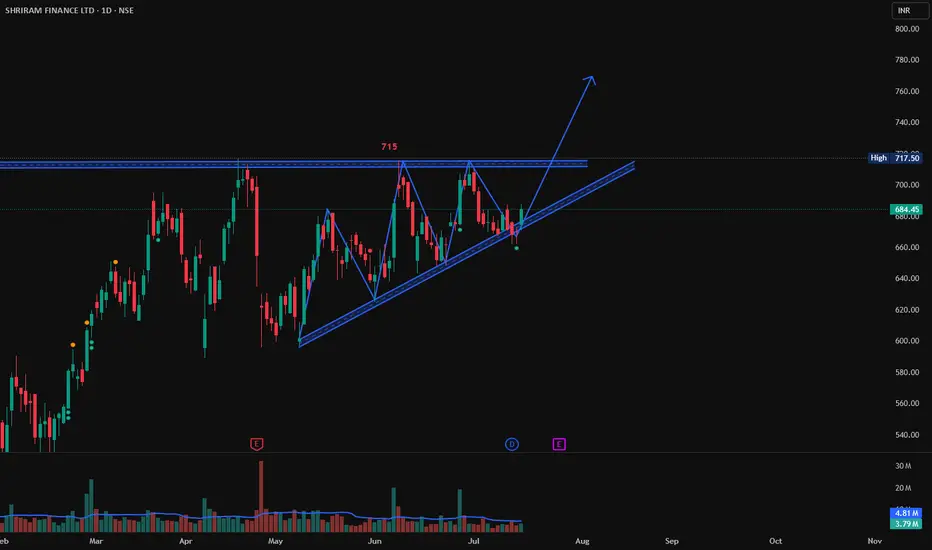
Shriram Finance following TrendLine, Long TradeShriram Finance is following the TrendLine. If it cross the high created today at 688 and shows a good Bullish candlestick patterns like Bullish Engulfing, Hammer & Inverted Hammer, Piercing Line, Morning Star, Three White Soldiers, Tweezer Bottoms or Bullish Harami. Then it may go till 715 which is strong resistance level.
Entry above 688 on Bullish Candlestick pattern.
Target: 715
Stop Loss: 680
Kotak Mahindra Bank Long Positional ViewKotak Mahindra Bank is breaks 2245 and close above 2250 then it may go long till 2300 from here.
Buy above 2250
Target 2300
SL - 2230

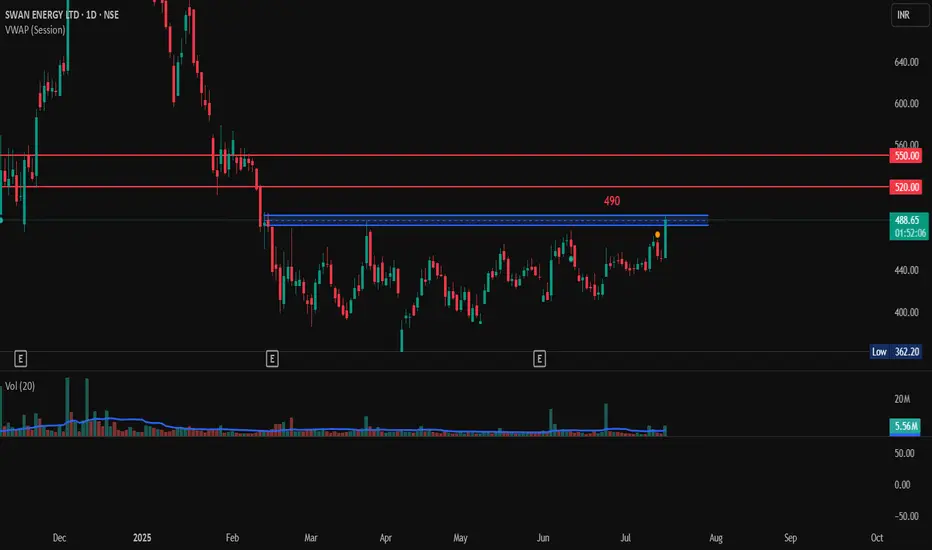
Breakout in Swan Energy, Long TargetsA nice breakout in Swan Energy, if it breaks and sustains 490 then we can see a good up move from here.
Entry above 490
SL 485
Target1: 525
Target2: 550
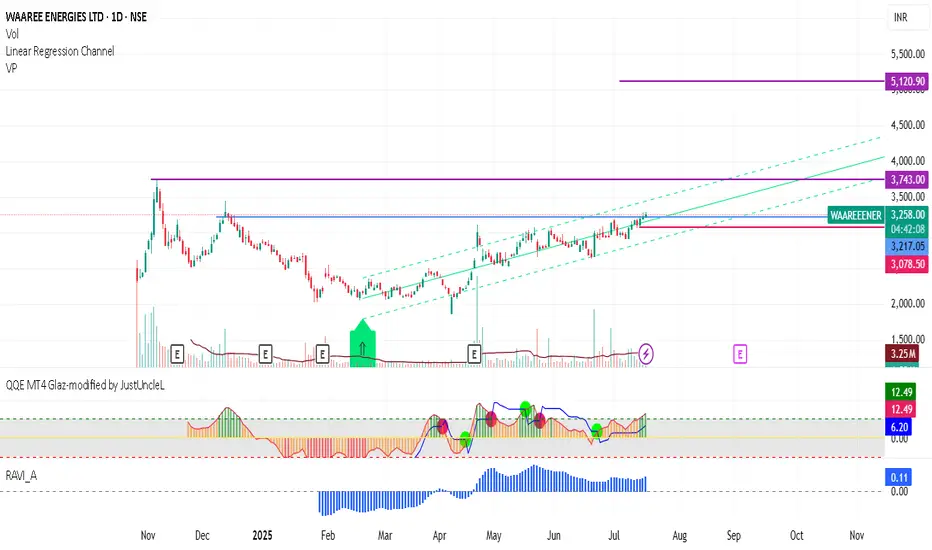
Waaree EnergiesStock crossed above mid of the channel can reach the previous high.
Added into my watchlist.