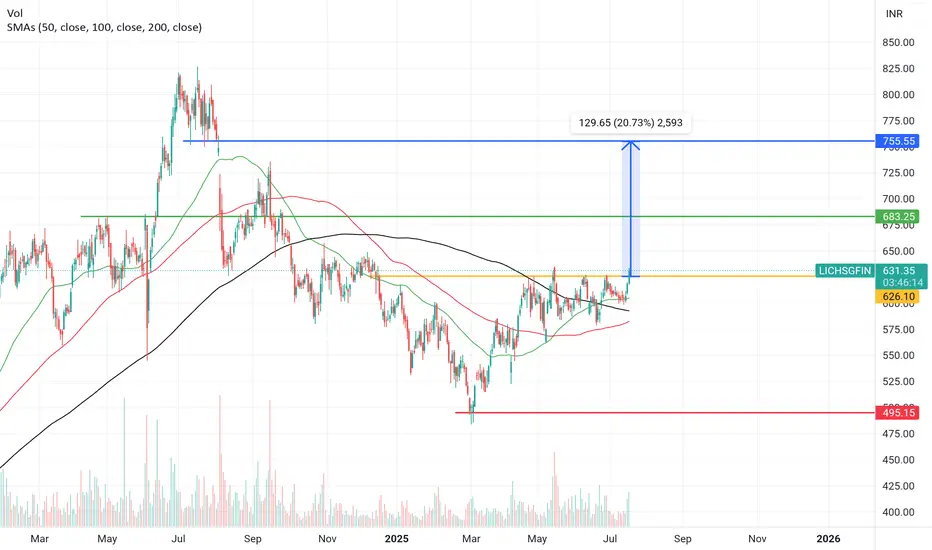
Complex Cup & Handle pattern break out in lic housing finance Lic housing finance given break out from 620 level .It's formed a complex Cup Handle pattern .1st target will be arround 680 & final target will be 750.
It's not a buy or sell recommendation , For educational purpose only.
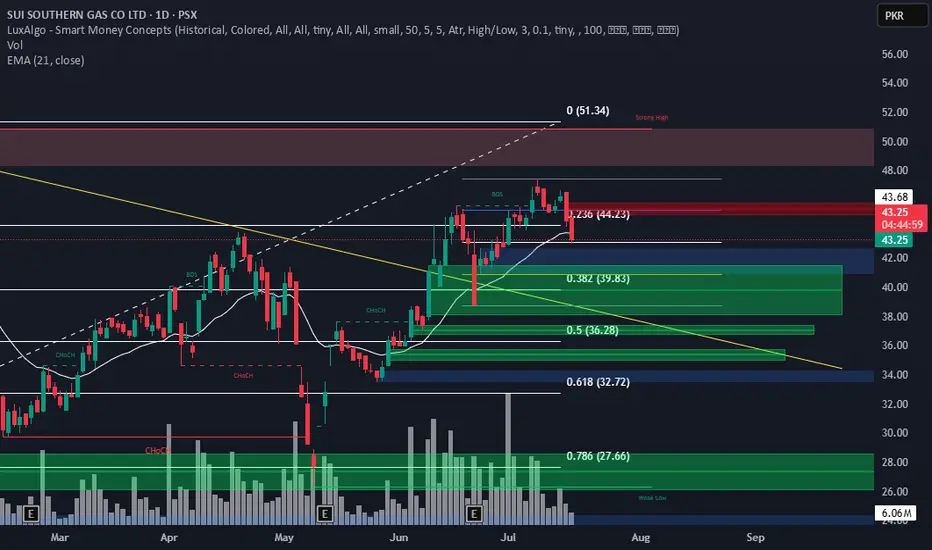
SSGC DAILY CHART BUYING OPPORTUNITY41.50 is a good price to buy SSGC. This analysis is sharing for educational purpose only.
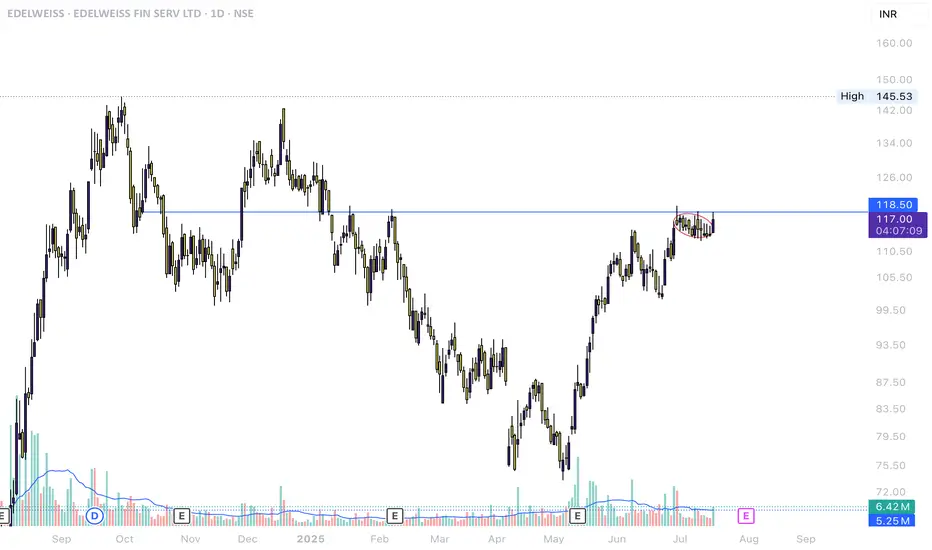
EDELWEISSAfter a strong uptrend , Price consolidated near the resistance forming a tight closing base
Price is breaking out of the range.
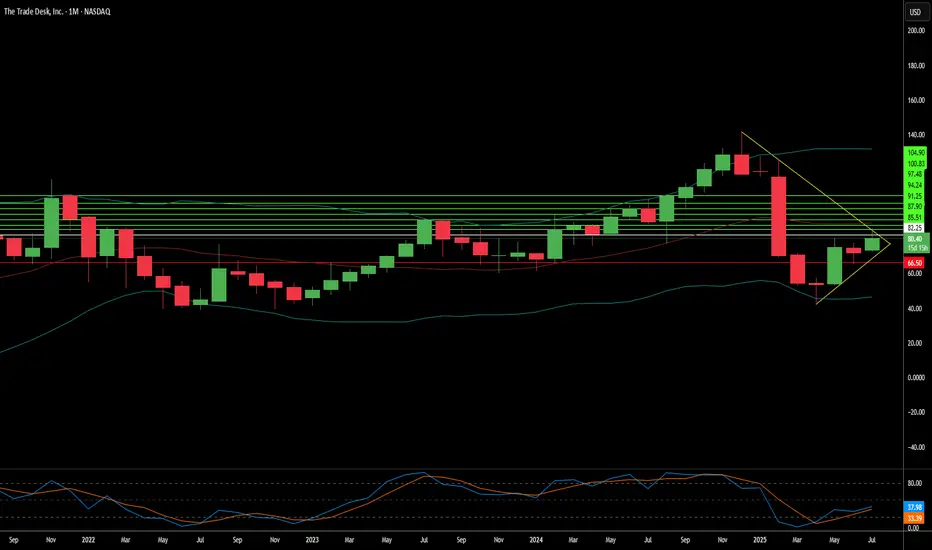
The Trade Desk: Why the Sudden Surge?The Trade Desk (TTD) recently experienced a significant stock surge. This rise stems from both immediate market catalysts and robust underlying business fundamentals. A primary driver was its inclusion in the prestigious S&P 500 index, replacing Ansys Inc. This move, effective July 18, immediately triggered mandated buying from index funds and ETFs. Such inclusion validates TTD's market importance and enhances its visibility and liquidity. This artificial demand floor, coupled with TTD's $37 billion market capitalization, underscores its growing influence within the financial landscape.
Beyond index inclusion, TTD benefits from a significant structural shift in advertising. Programmatic advertising is rapidly replacing traditional media buying, expected to account for nearly 90% of digital display ad spending by 2025. This growth is driven by advertisers' need for transparent ROI, publishers avoiding "walled gardens" through platforms like TTD's OpenPath, and AI-driven innovation. TTD's AI platform, Kokai, greatly lowers acquisition costs and enhances reach, resulting in over 95% client retention. Strategic partnerships in high-growth areas like Connected TV (CTV) further reinforce TTD's leadership.
Financially, The Trade Desk demonstrates remarkable resilience and growth. Its Q2 2025 revenue growth of 17% outpaces the broader programmatic market. Adjusted EBITDA margins hit 38%, reflecting strong operational efficiency. While TTD trades at a premium valuation - over 13x 2025 sales targets-its high profitability, substantial cash flow, and historical investor returns support this. Despite intense competition and regulatory scrutiny, TTD's consistent market share gains and strategic positioning in an expanding digital ad market make it a compelling long-term investment.
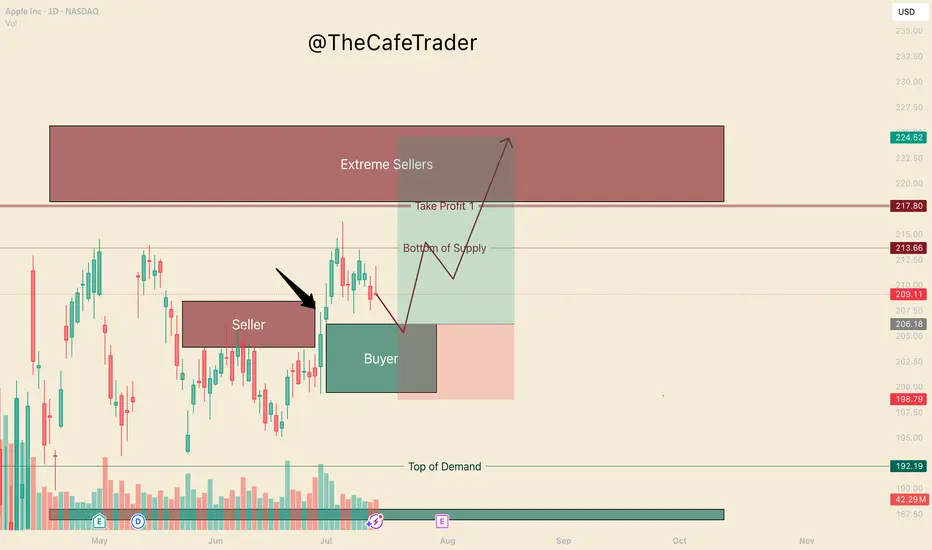
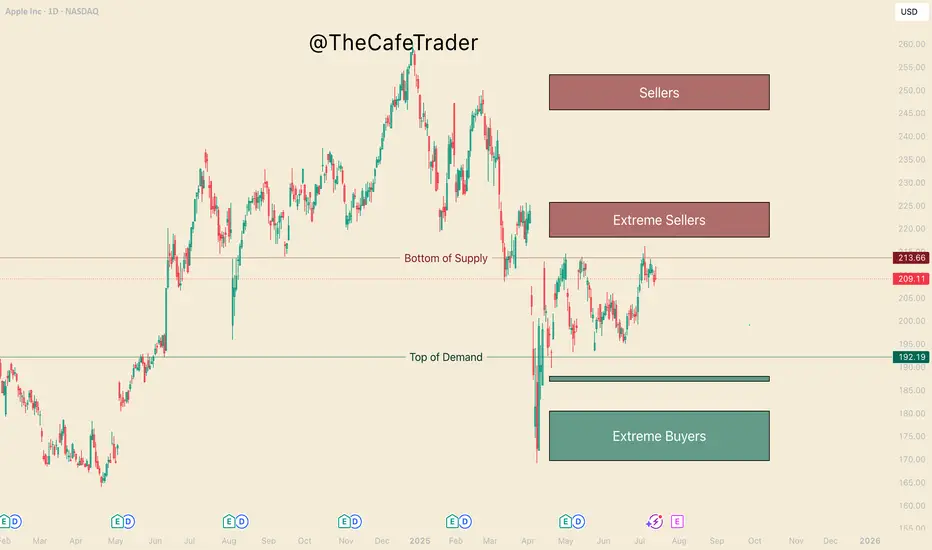
APPL. Bulls are in ControlHello, I’m TheCafeTrader.
This post is for technical traders looking to capitalize on short swings and options.
What you’re seeing here are supply and demand zones — areas where liquidity is concentrated. These levels are identified using a system built around footprint data, order flow, and market imbalances.
🔹 Key Observation:
I’ve marked a seller that price has now broken above. This tells us that buyers have overpowered a sell-side participant, and are now likely targeting deeper liquidity in the $218–$225 range.
🔹 On Apple’s Behavior:
Apple can be slow and choppy at times. So, if you’re trading options, consider going as close to the money as possible and give yourself some time on the contracts.
🔹 New Buyer in the Market:
Between $199–$206, a new aggressive buyer has stepped in. This player appears to be pressuring the first line of sellers (labeled “beginning of supply”).
🟢 My Expectation:
I expect AAPL to pull back to around $206 before catching a bid. As long as price holds above $199, buyers remain in control. In this range, I anticipate further accumulation by bulls.
🔸 Take Profit Levels:
• First TP: Just before the major selling cluster around $218
• Final TP: Deep inside the seller zone near $223
⸻
📊 Follow for more short-term analysis. This week, we’re covering both short- and long-term views of the MAG 7.
⸻
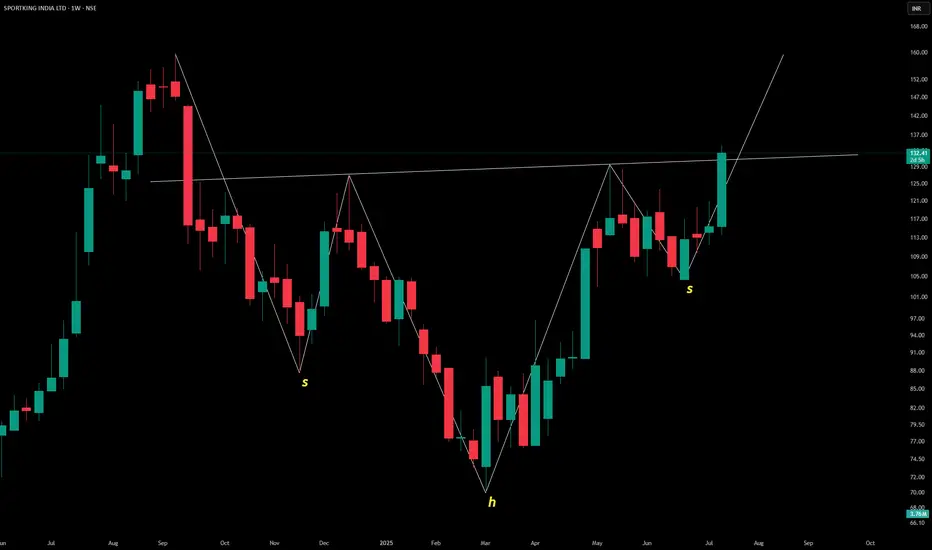
SPORTKING INDIA LTD – Inverted Head & Shoulders Pattern
The weekly chart shows a classic **inverted head and shoulders** formation:
- 👈 **Left Shoulder**: Shallow trough
- 🔽 **Head**: Deep central low
- 👉 **Right Shoulder**: Higher trough mirroring the left
Price action around ₹132.48 suggests a potential **bullish reversal**, indicating that the prior downtrend may be bottoming out. A breakout above the neckline would typically confirm upward momentum—worth watching for volume confirmation and resistance levels.
Let me know if you’d like projected targets or neckline levels next!
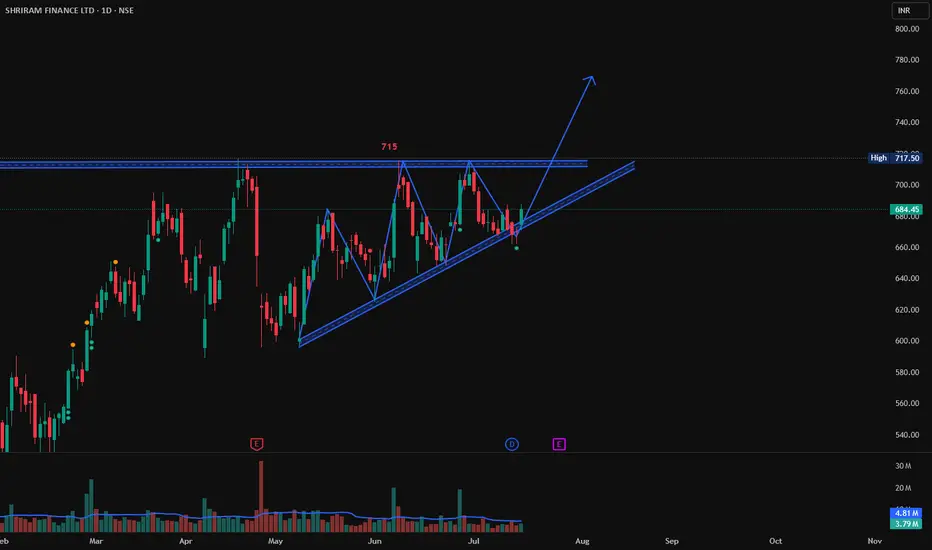
Shriram Finance following TrendLine, Long TradeShriram Finance is following the TrendLine. If it cross the high created today at 688 and shows a good Bullish candlestick patterns like Bullish Engulfing, Hammer & Inverted Hammer, Piercing Line, Morning Star, Three White Soldiers, Tweezer Bottoms or Bullish Harami. Then it may go till 715 which is strong resistance level.
Entry above 688 on Bullish Candlestick pattern.
Target: 715
Stop Loss: 680
Kotak Mahindra Bank Long Positional ViewKotak Mahindra Bank is breaks 2245 and close above 2250 then it may go long till 2300 from here.
Buy above 2250
Target 2300
SL - 2230

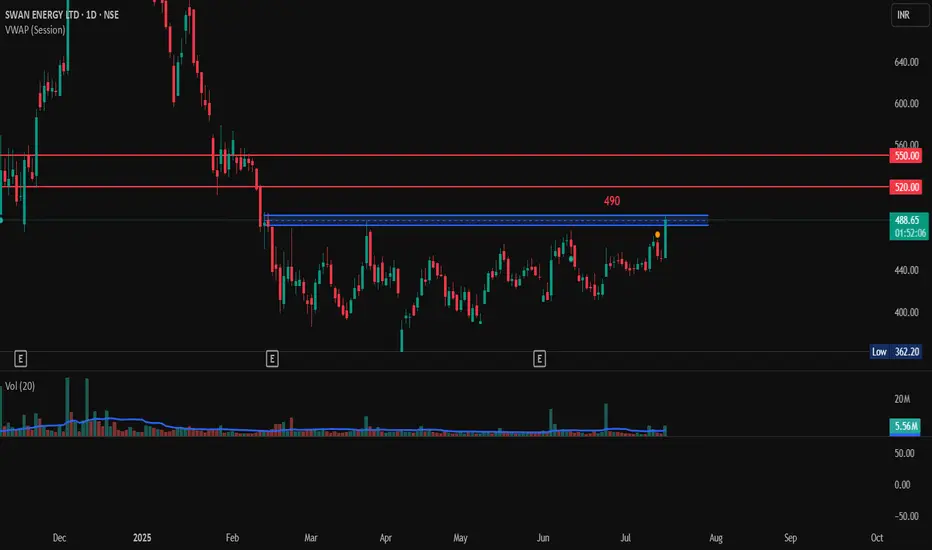
Breakout in Swan Energy, Long TargetsA nice breakout in Swan Energy, if it breaks and sustains 490 then we can see a good up move from here.
Entry above 490
SL 485
Target1: 525
Target2: 550
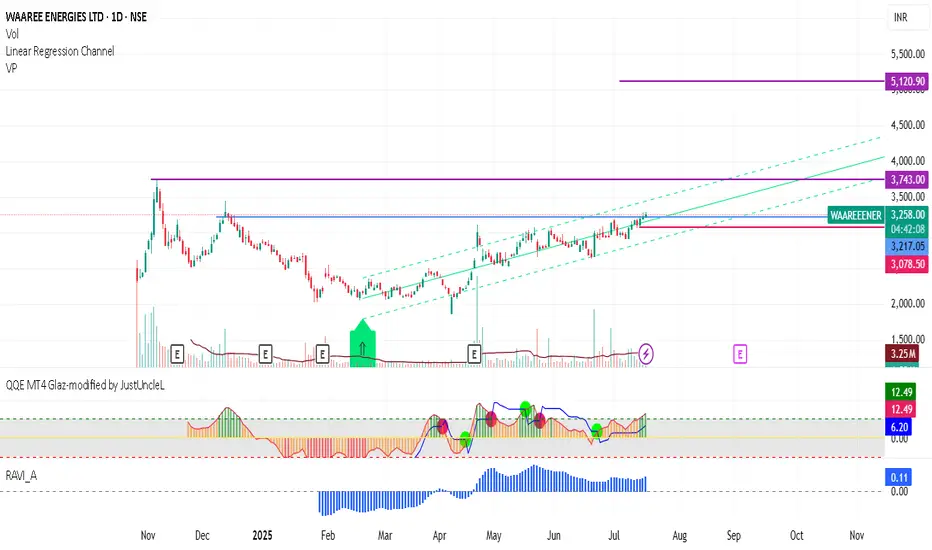
Waaree EnergiesStock crossed above mid of the channel can reach the previous high.
Added into my watchlist.
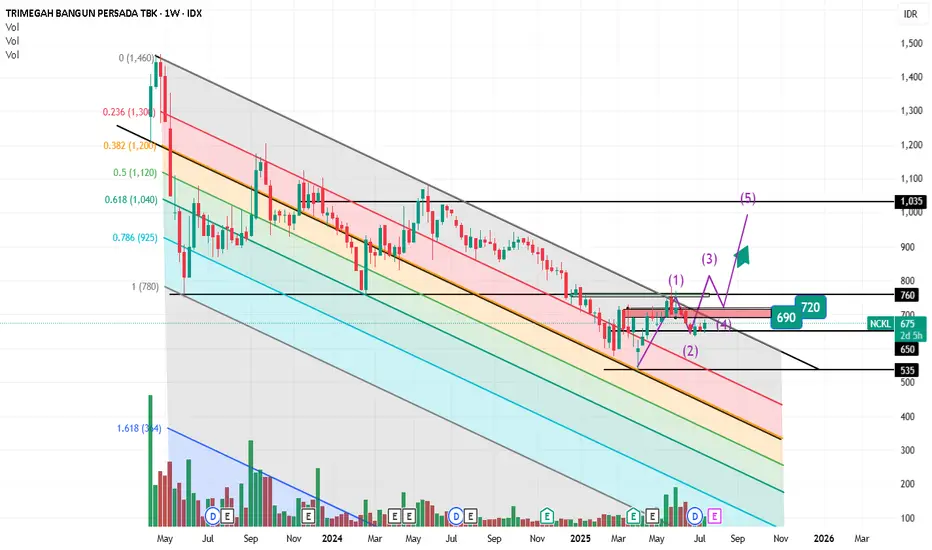
NCKLDISCLAMER !!!
You can buy now with a stop-loss below 585. If the line breaks out and becomes an uptrend, you can buy again, but you must wait for a true breakout of 760 and re-enter at 690-720.
The target is around 1,000. You can hold for the medium term, or even longer term, possibly above 1,000.
You can also take a 50% profit if the target price reaches 1,000.
I published my idea because I only remember myself, so I don't invite you to buy it.
And I also want to help all my friends, hopefully everyone will profit and be useful.
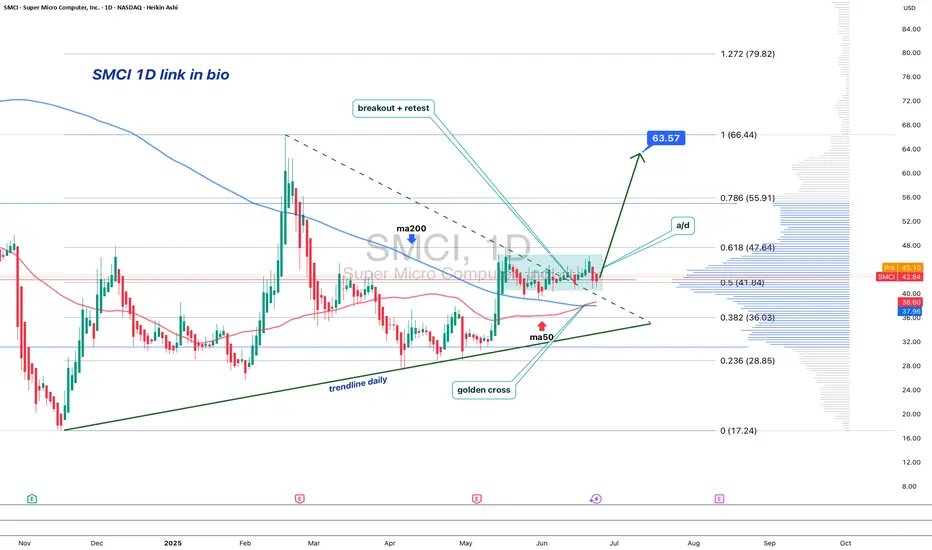
SMCI: When a chart says it’s time to reconnect with the AI hypeOn the daily chart, Super Micro Computer Inc. (SMCI) is showing a clean bullish setup. Price broke out of a descending trendline (green dashed), confirmed it with a retest, and is now consolidating above the breakout zone. The golden cross — where the MA50 crossed above the MA200 — confirms a long-term trend reversal.
Volume profile indicates strong accumulation near $41–43. The 0.5 Fibonacci level at $41.84 acted as support. Above the current range, there’s low volume resistance up to $63.57 (0.786), followed by $66.44 and a final extension target at $79.82 (1.272).
Fundamentals: SMCI is a leading server hardware manufacturer. Demand for their systems has soared with the explosion of AI infrastructure. The company maintains solid financials, with rising quarterly revenue and growing presence in the cloud sector. Institutional investors have been actively increasing their positions since late 2023 — a sign of strong long-term conviction.
Tactical plan:
— Entry: market $42–43
— Target 1: $55.91
— Target 2: $63.57
When technicals scream textbook breakout and fundamentals bring AI momentum to the table — it might just be one of the best late entries in the AI wave this summer.
APPL, Get Yourself a Good PriceHello This week we are breaking down the MAG7 starting with Apple.
This analysis is an aid to help you:
1 Find good price to add to your long term.
2 Hedge your current position.
3 Make a swing trade (we will touch on options pricing as well).
Currently Apple is 1 of 5 of the MAG 7 that had not gained a new high since Trump and the tariff scares. Many analysts have given their predictions on where Apples fair value lies and these vary. What they will not tell you is where the institutional buyers and sellers are. Not to worry, this is where we come in
Big Buyers and Big Sellers
On the chart in front of you, take a look at the 3 different buy and sell zones (otherwise known as supply and demand zones). We find these areas in using a system similar to "imbalances" if you are familiar with the footprint chart, or orderflow. If you had no idea what any of that means, not to worry, I've done the work for you.
-The lines represent the fringe of real liquidity . Using this we will be able to help you find how and when you can find a good price for your long term.
- Buyers/Sellers: strong motivated liquidity.
- Extreme Buyers/sellers Extreme demand, this is an area you could consider a steal.
1 How do you find good pricing?
Simply put - Buy with the buyers and sell with the sellers.
If you are wanting to add to your long term here are the prices. Do you want to get in ASAP? or are you willing to wait for what could be a great deal. This is important as the end of the year can greatly depend on not just picking a good stock, but finding a great price.
Buying
Fair - 192
Good - 188-187
GREAT - 180-169
Now if you are in, and maybe you want to hedge the downside (you can do this by shorting the stock, or buying put options (even more in depth you can do spreads).
For now we will just focus on Buying Put options and taking profit for swing traders.
The Burgundy line "bottom of supply" previously rejected this area twice before (May 1st, and May 14th). July 7th marks the 3rd rejection. It's important to note that the last test pushes a new high, this shows a bit of weakness from the sellers.
This weakness suggests we may see the 218-225 Sellers get tested before it comes down. The question is, How strong will the buyers be coming into this zone.
If they are aggressing this area with new REAL buyers, Then we may see this run through all these sellers and continue to run until the 245 area. If we do not find real buyers here, then likely we will reject to the pricing marked previously.
If you are holding APPLE, you can look to hedge with puts at the end of the 220-223. Since you are looking at about 5-7% downside from apple if the sellers are strong here, look to only spend 2-3% of your apple worth on puts. look for maybe 2-3 weeks out if possible.
Secondly if APPL does make a bull run to 245 you can mark this area again to hedge short term puts. look for 8-10%+ downside puts 3-4 weeks out (roughly 3-5% of your apple size)
Hedging can be very useful in wanted to keep your long term and navigate some of the ebbs and flows of the market. Notice that the risk of your puts, 2-3% & 3-5%, is half of the expected reaction from these areas. if you get a big rejection, expect these options to pay well.
NOTE: If you do not understand the implied volatility (IV's) change the price of options, it is recommended that you stay away from options until you have sufficient experience. It's also important to know how to find a good strike price, and how to know if you are getting a good price. I will be breaking down options pricing in a different time.
That's all for Apple, Stay tuned for the rest of the MAG 7!
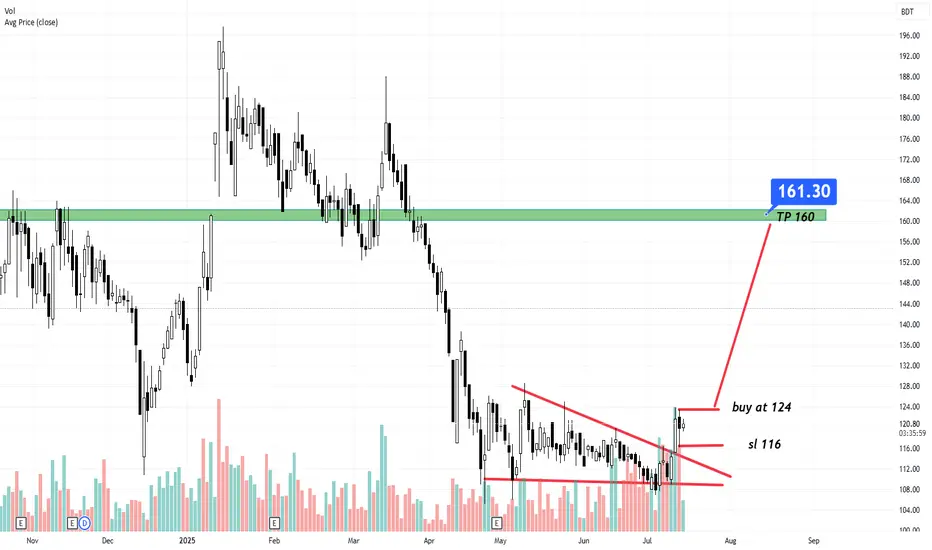
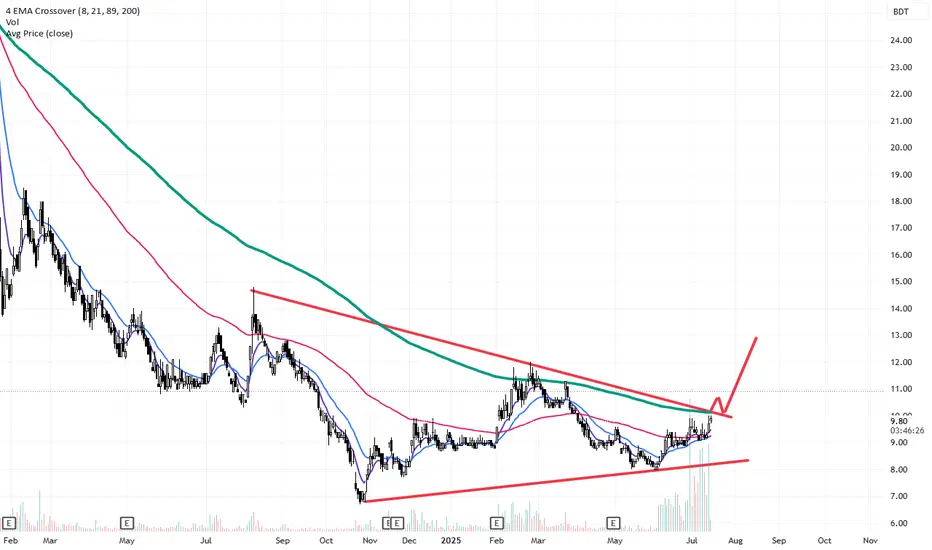
KBPPWBIL_____ breakout , retest and inside bar forming . all volume are accumulated under 40 TK level . you can buy after 124 level take profit at 160 stop loss under 116
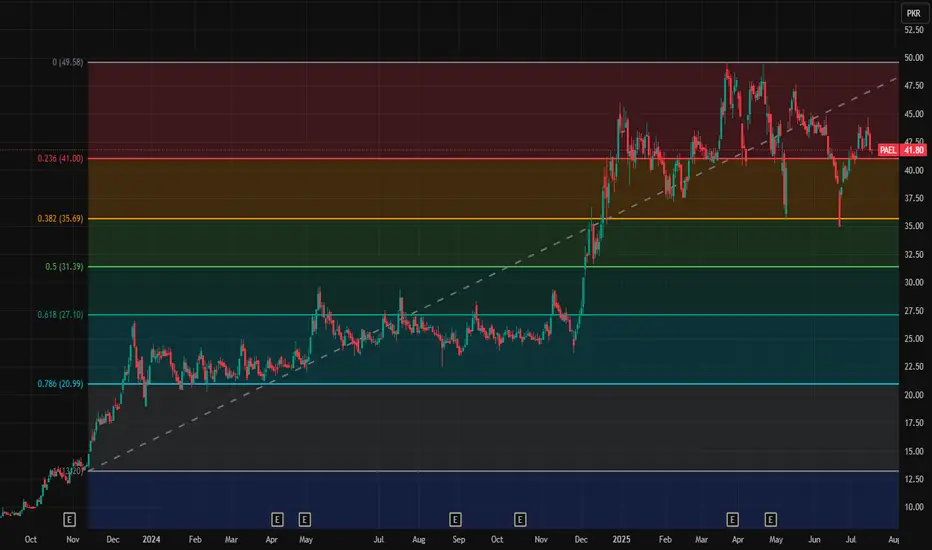
Pael Key LevelsThese are Pael key levels
31.39
35.69
41
49.58
Note: This is not a buy/sell trade call. It is an analysis.
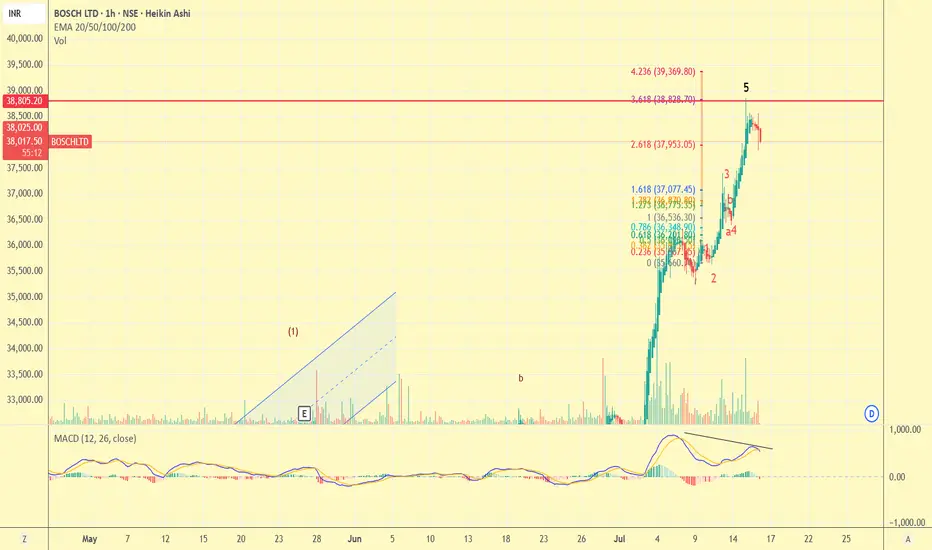
BOSCH--make profiton hourly chart target of s5th wave met and MACD also showing negative divergence profit can be taken and bought in future at 34-35000 level.
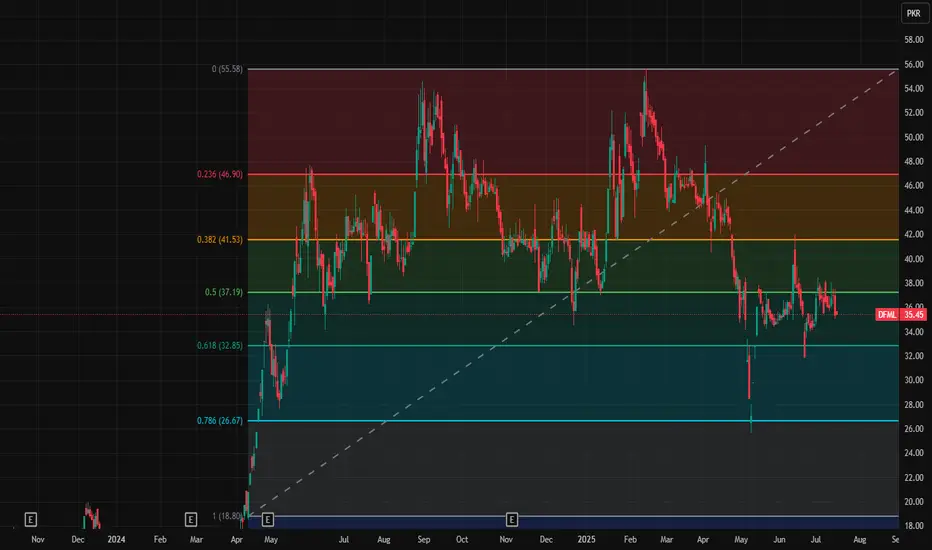
DFML Key LevelsThese are key levels of DFML
26.67, 32.85, 37.18, 41.53, 46.9 and 55.08
Note: This is not a buy/sell trade call, it is an analysis.
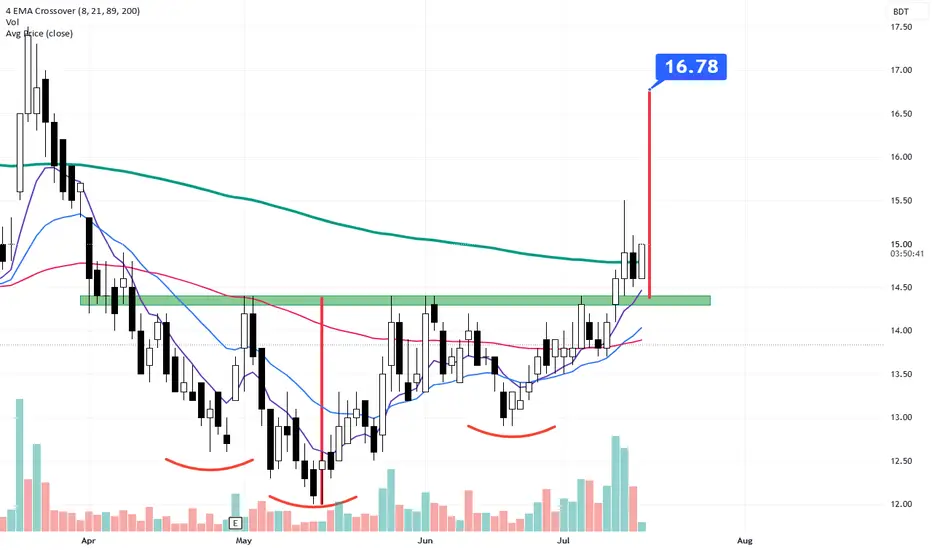
MLDYEING_____ watch the level at 10.10 triangle break out may happen , if then entry at 10.20 Tp at 13
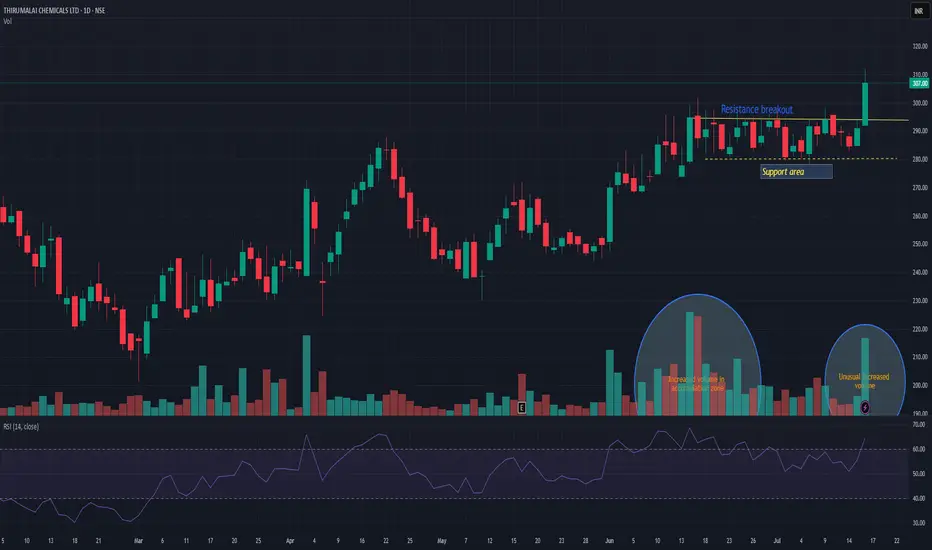
TIRUMALCHMTIRUMALCHM has given resistance breakout with decent volume. Another good thing is unusual volume increased in accumulation zone. Support can be seen near 280 levels. There is high probability that this time it may push the stock in to trend change and may take momentum to the next level. Keep it on radar.
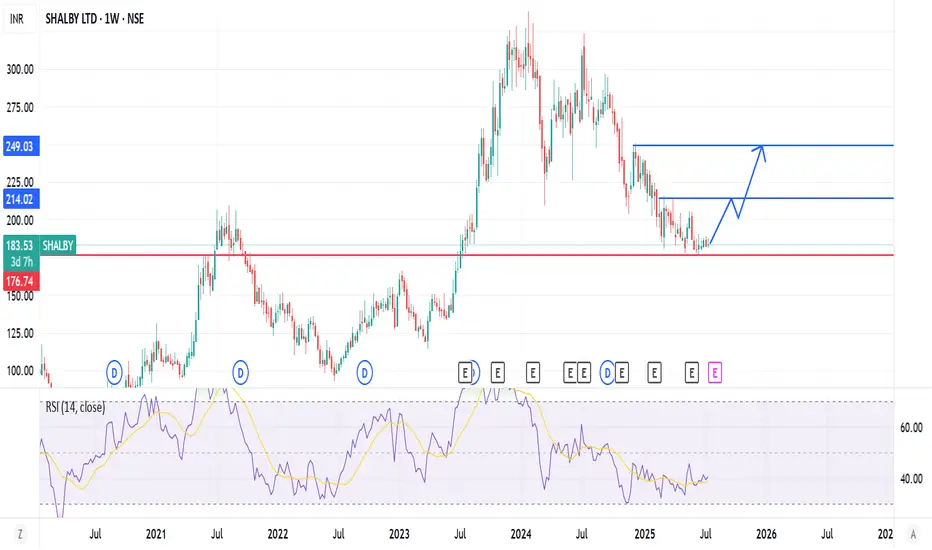
shalby ltd at good risk reward ratioshalby ltd making good foundation near support area, minor spike can add more investor .
risk reward is good over the counter.
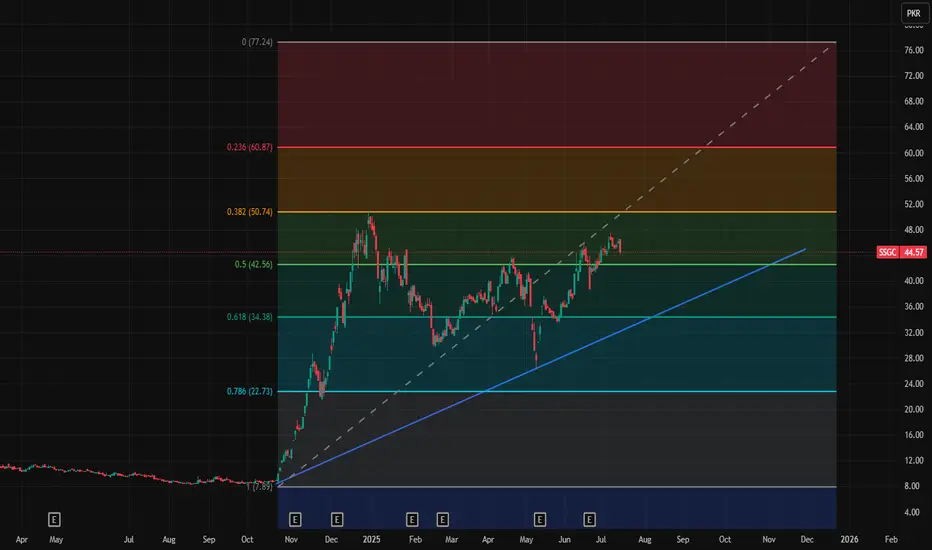
SSGC trendThis is SSGC daily chart and you can watch blue trend line is its strong support and sustainability. It is growing day by day in long term.
These are key levels 34.38, 42.58, 50.74, 60.87 and 77.24
Note: This is not a buy/sell trade call. It is an analysis.
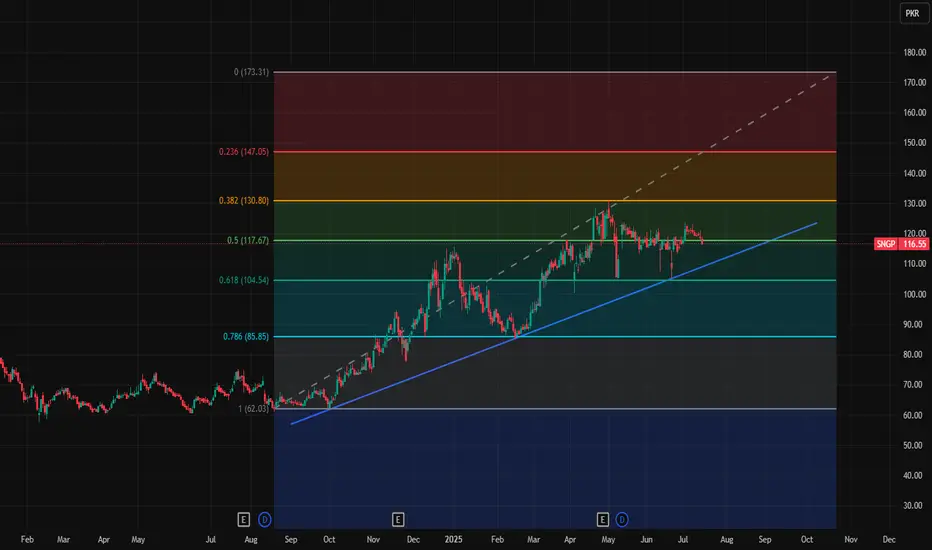
SNGP in long runThis is SNGP daily chart and blue trend line shows its positive movement and it is maintaining sustainable growth.
These are key levels 117.67, 130.8, 147.05 and 173.31
Note: This is not a buy/sell trade call, it is an analysis.