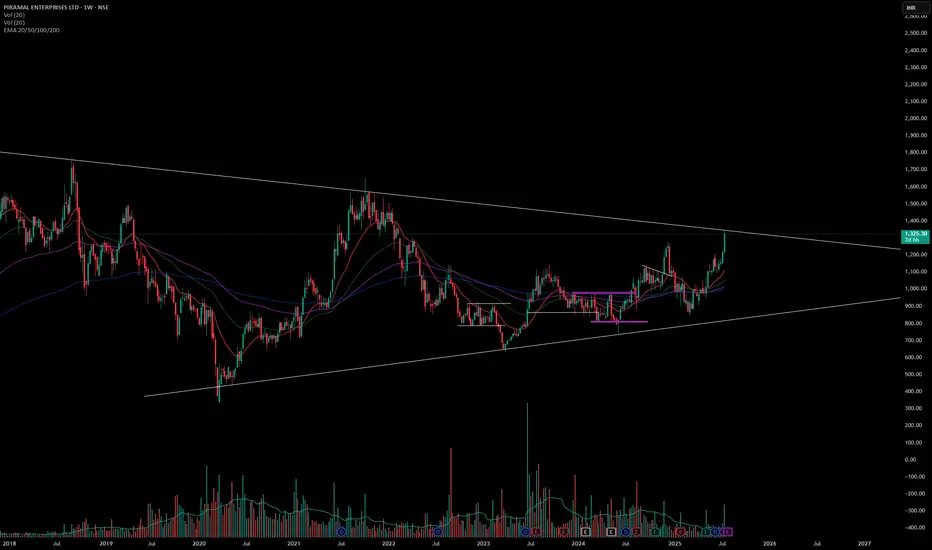
PEL Long For Swing TradeStock PIRMAL ENTERPRISES This stock is ready for multiyear breakout, it is inside symmetric triangle pattern. Look out for this stock.
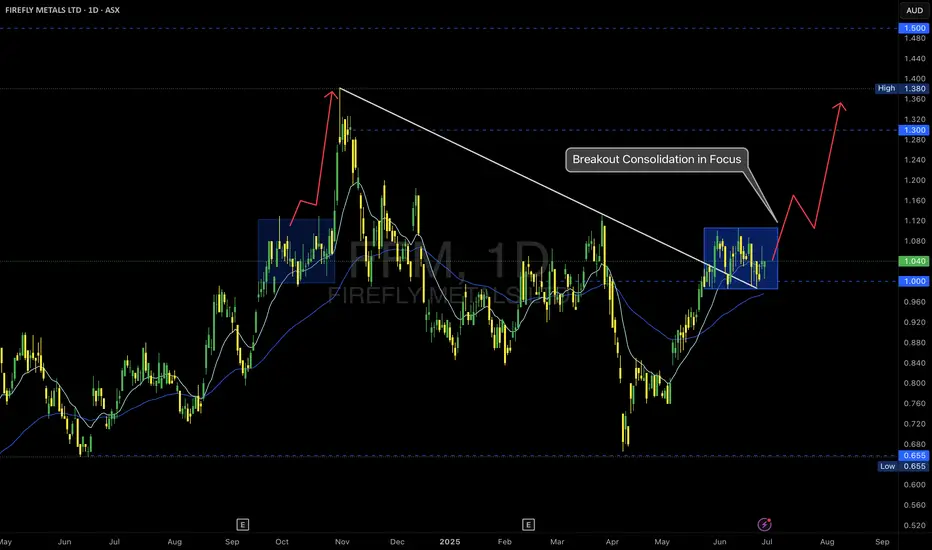
FFM -- ASX – Breakout Consolidation in Focus
📝 Description
Firefly Metals is setting up a classic breakout continuation scenario after reclaiming the $1.00 psychological level and breaking the long-term trendline resistance.
🔹 Key Observations:
• Trendline Break: The descending trendline from the prior high was decisively breached, signaling a structural shift.
• Accumulation Zone: Price has consolidated in a tight range above $1.00, forming a bullish flag or box accumulation.
• EMA Cluster Support: Both the 15 and 60 EMAs are aligned below the consolidation, providing dynamic support.
🔹 Potential Scenarios:
✅ Bullish Continuation:
A clean breakout above the top of the blue box could trigger a momentum rally toward $1.30 and ultimately the $1.38–$1.50 resistance levels.
✅ Deeper Pullback:
If price loses the $1.00 support decisively, a retracement to retest the breakout base is possible.
Trade Plan:
I am monitoring for a confirmed breakout candle with volume expansion to validate the continuation thesis.
• Entry trigger above the range high ($1.10 area)
• Stops below recent swing low / $1.00 level
• First target: $1.30 resistance
As always, risk management first—no breakout, no trade.
#MJTrading
#FFM #FireflyMetals #ASXTrading #BreakoutSetup #TechnicalAnalysis #PriceAction #TradingPlan #ChartOfTheDay #AustralianStocks #MomentumTrading #MJTrading
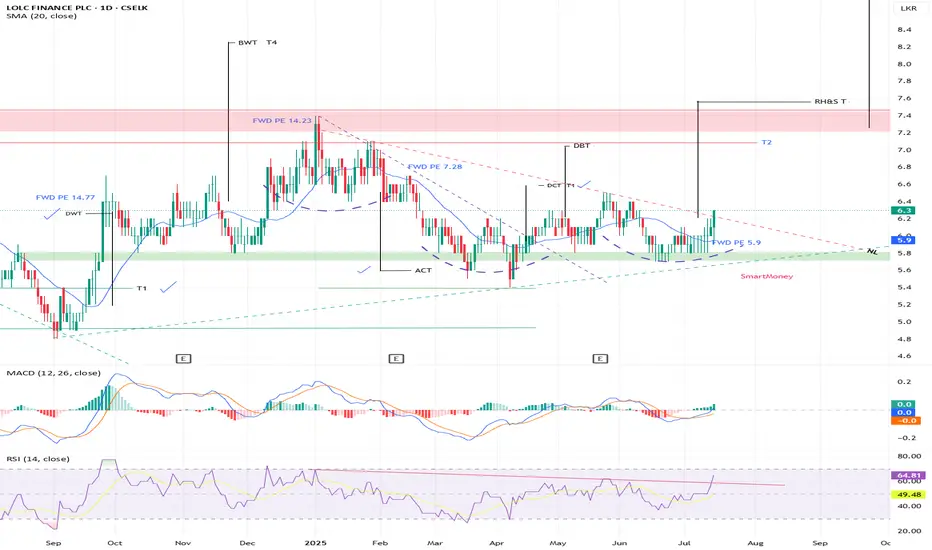
LOFC Finance PLC : LOFC.N0000 : CSETechnical Analysis (Chart Patterns)
* LOFC is breaking out from a Reverse head & shoulder pattern
* If successful target is around LKR 7.60
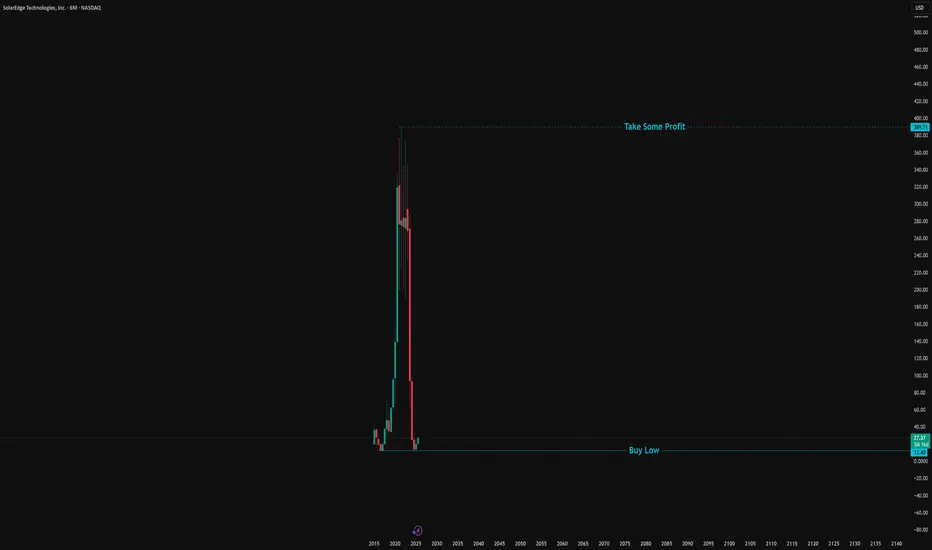
SolarI randomly scrolled through the list of stock selections here at Tradingview and lo' and behold I found a gem. This gem was buried as if by a pirate and I have unearthed it. Just look at it! Now it can function as it was made to. A proper find indeed. Stay tuned!
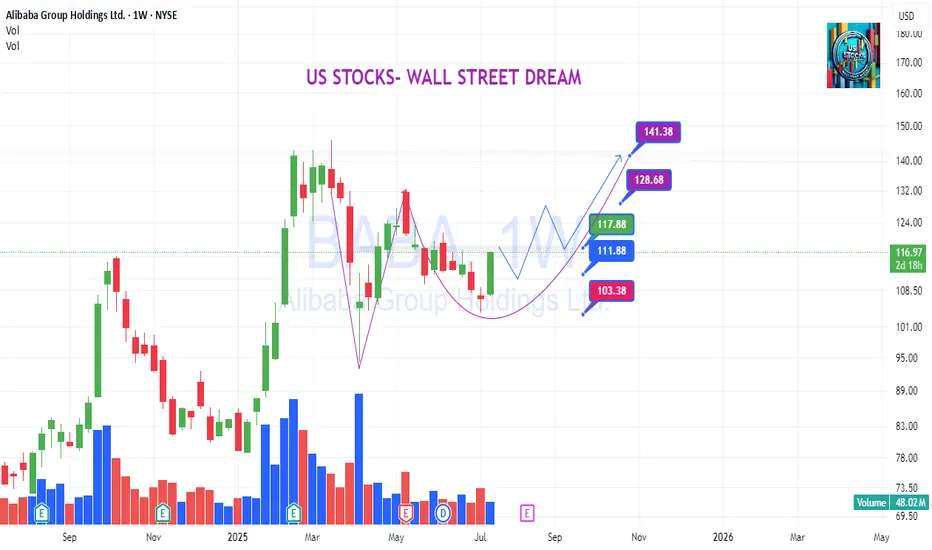
BABA: What are you seeing on this chart?BABA:
.
What are you seeing on this chart?
A perfect shakeout.
Smart money has joined at the bottom.
What's next?
.
US STOCKS- WALL STREET DREAM- LET'S THE MARKET SPEAK!
GME is ready to decide (weekly candles)I'm bullish because the market is bullish
Reasons for being Bullish
-above 200sma weekly and have held it as support
-200sma day crossed above 200sma weekly
-everyone knows about the stock, momentum could be something never seen before because of the notion of becoming rich in a day. Treating this as a casino.

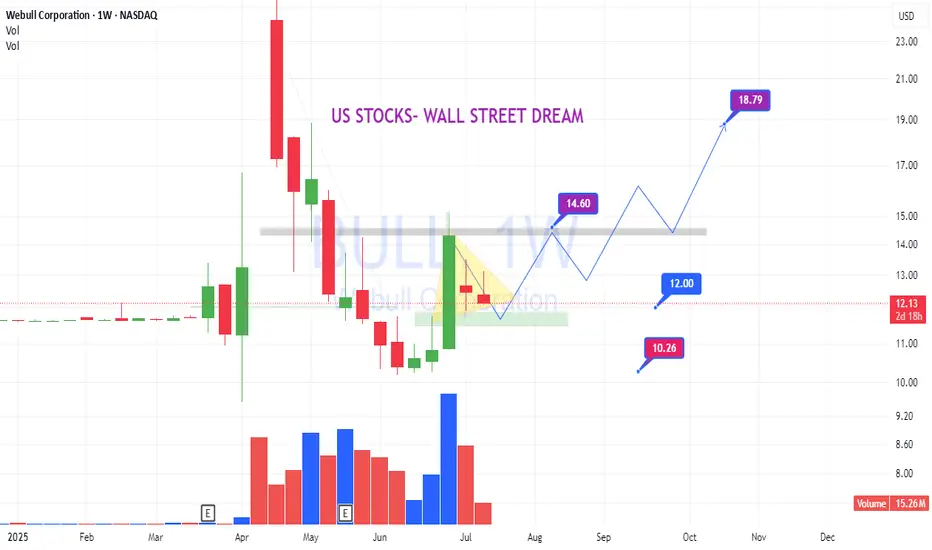
BULL: Inside bar accumulation patternBULL:
Inside bar accumulation pattern.
Less supply volume.
Wait for break and jump!
.
US STOCKS- WALL STREET DREAM- LET'S THE MARKET SPEAK!
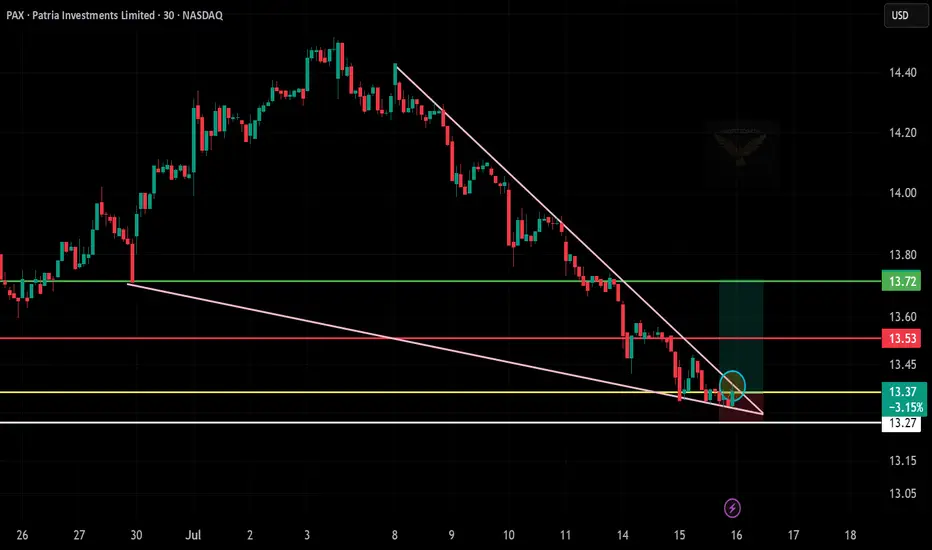
PAX Falling Wedge Breakout – Long Trade Setup
🧠 Chart Analysis Summary:
Pattern: Falling wedge breakout spotted — a classic bullish reversal pattern.
Current Price: $13.37
Support Zone:
$13.27 (white line, holding support)
Breakout Confirmation: Price is pushing out of the wedge with a small green move (circle).
📊 Key Levels:
Entry Zone: $13.35–$13.40
Target 1: $13.53 (red line – short-term resistance)
Target 2: $13.72 (green line – wedge target zone)
Stop-Loss: Below $13.25
🎯 Trade Idea (Bullish Bias):
Entry: $13.35–13.40
Target: $13.72
Stop-Loss: $13.25
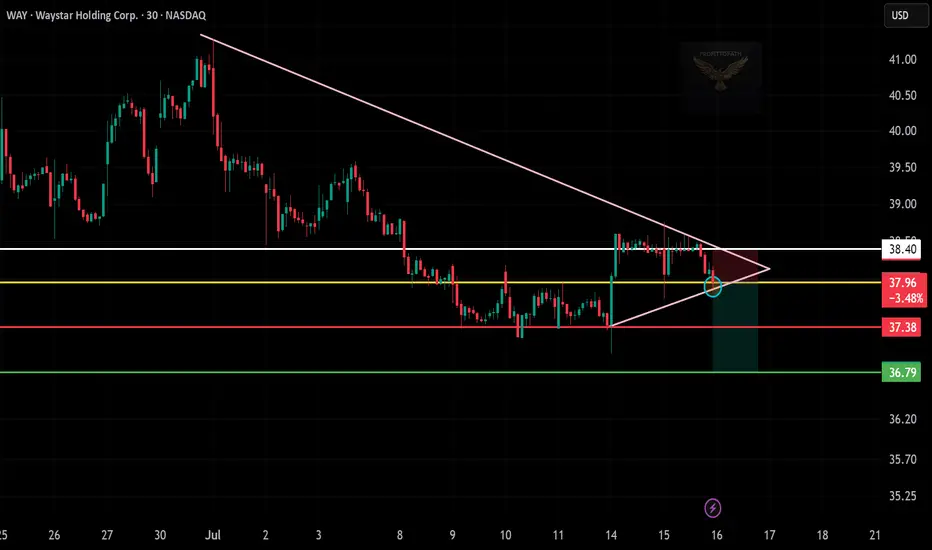
WAY Bearish Breakdown – Eyes on $36.79
🧠 Chart Analysis Summary:
Pattern: Breakdown from a symmetrical triangle (pink lines), signaling bearish pressure.
Current Price: $37.96
Breakdown Confirmation: Price broke triangle support with bearish follow-through.
Resistance Zone:
Immediate Resistance: $38.40 (white line)
Support Levels:
First: $37.38 (red line)
Final Target: $36.79 (green zone)
🎯 Trade Idea (Short Bias):
Entry: $37.90–38.00 (after breakdown confirmation)
Target: $36.80
Stop-Loss: Above $38.50
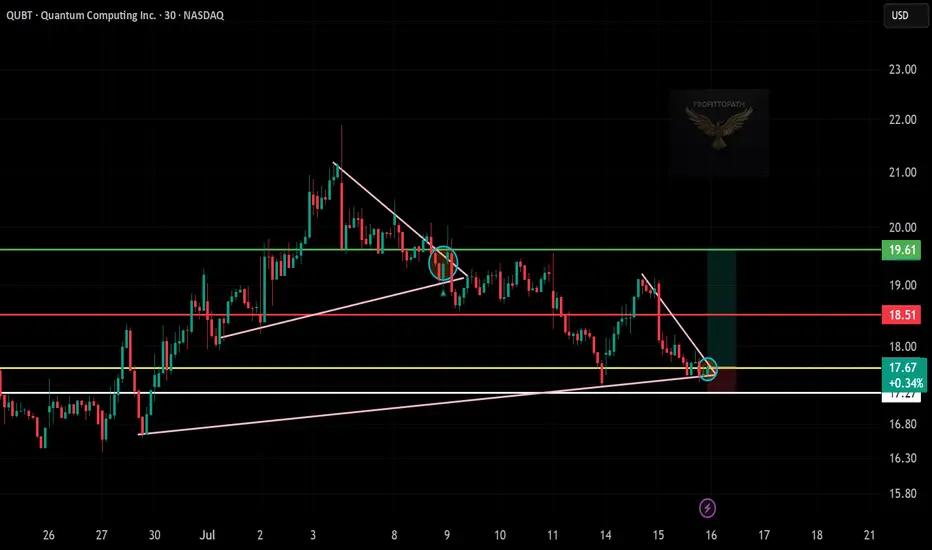
QUBT Bounces Off Trendline – Long Setup!
🧠 Chart Analysis Summary:
Setup: QUBT bounced off a long-term ascending trendline (pink), with potential reversal from support.
Current Price: $17.67
Breakout Zone: A breakout from the small falling wedge/pennant pattern appears underway.
Support Zone: Around $17.25–17.50 (white/yellow lines)
Target Zone:
First Target: $18.51 (red line)
Final Target: $19.61 (green line)
🎯 Trade Idea (Long Position):
Entry: $17.60–$17.75 (post-wedge breakout)
Target 1: $18.50
Target 2: $19.60
Stop-Loss: Below $17.20 (trendline support break)
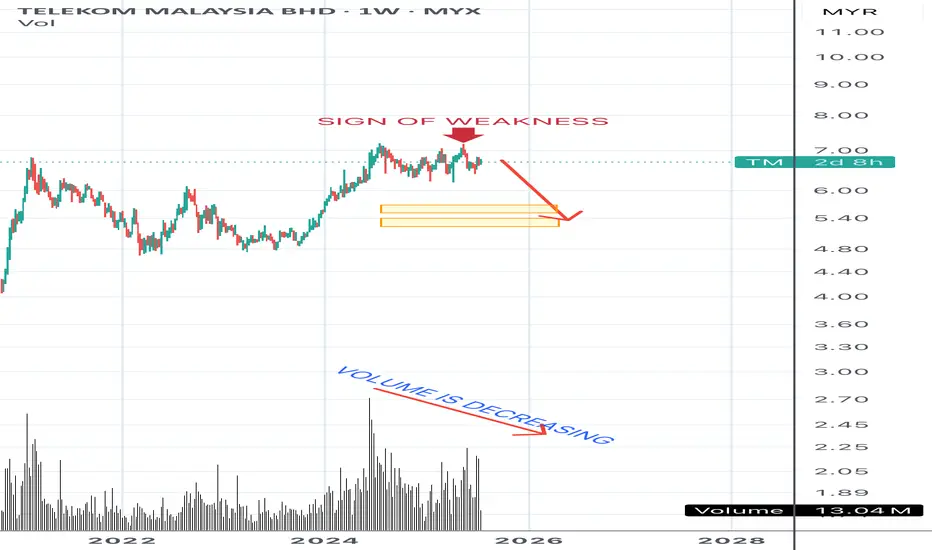
LOOKING FOR SUPPORT Chart: Uptrend on weekly timeframe
Price is in the phase of distribution.
Possible to retrace down towards 5.60 & 5.25 zone.
Volume -decreasing
#trade at your own risk
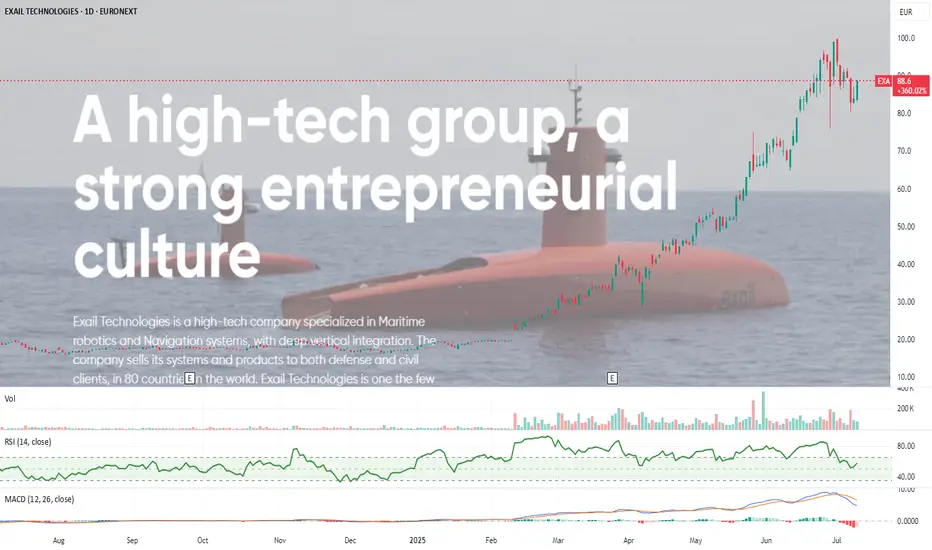
Exail Technologies European Drone Warfare and Robotics. Exail Technologies (previously Groupe Gorge S.A.) is a French tech company specializing in drones, robotics, and maritime autonomous systems, with growing exposure to defense and industrial markets.
It’s on a clear uptrend, sitting well above its 50 and 200-day EMAs with momentum firmly in play. Volume is steady, with recent trading activity picking up compared to its long-term averages, reflecting consistent investor interest.
If you’re looking for a high-growth, high-momentum play in the drone warfare / European tech space, Exail is showing strength. Just keep an eye out for a pullback, which could offer a cleaner entry without chasing the current highs.
Might be worth a watch.
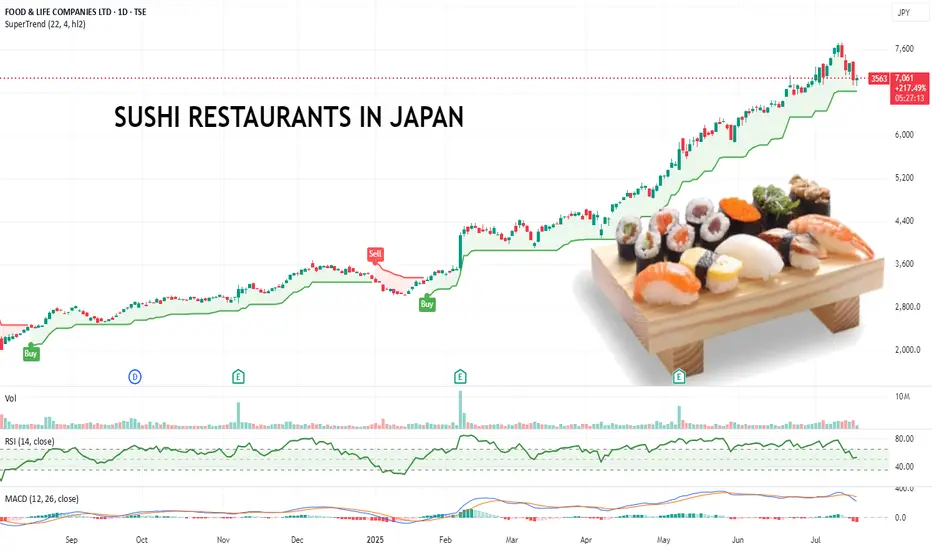
Pullback Over? This Japanese Sushi Chain Might Be Running Again.Food & Life Companies runs a major chain of sushi restaurants and is listed on the Tokyo Stock Exchange under the code 3563.TSE
From July 2025, I’ve started focusing more on scanning for high-momentum stocks globally, regardless of exchange. This one caught my eye with a clean, steady uptrend and a strong 200% move over the past year with minimal deep pullbacks.
It recently dipped, found support, and looks like it’s picking up again. That kind of price action gives a clear structure for managing risk if it rolls over. Makes it easy to identify where to put a stop loss to manage risk.
Also worth noting they’re aggressively expanding into Southeast Asia and beyond, which could help sustain the growth story.
Also. I like sushi. Wonder if there is a kebab stock...
Anyway, might be worth a watch.
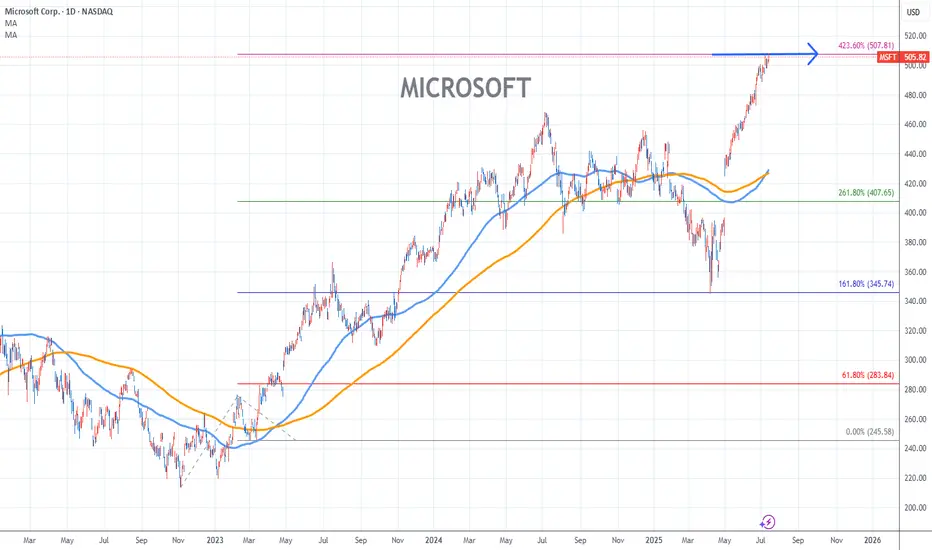
MICROSOFT Stock Chart Fibonacci Analysis 071525Trading idea - Hit the top > 507/423.60%
Chart time frame:D
A) 15 min(1W-3M)
B) 1 hr(3M-6M)
C) 4 hr(6M-1year)
D) 1 day(1-3years)
Stock progress:E
A) Keep rising over 61.80% resistance
B) 61.80% resistance
C) 61.80% support
D) Hit the bottom
E) Hit the top
Stocks rise as they rise from support and fall from resistance. Our goal is to find a low support point and enter. It can be referred to as buying at the pullback point. The pullback point can be found with a Fibonacci extension of 61.80%. This is a step to find entry level. 1) Find a triangle (Fibonacci Speed Fan Line) that connects the high (resistance) and low (support) points of the stock in progress, where it is continuously expressed as a Slingshot, 2) and create a Fibonacci extension level for the first rising wave from the start point of slingshot pattern.
When the current price goes over 61.80% level , that can be a good entry point, especially if the SMA 100 and 200 curves are gathered together at 61.80%, it is a very good entry point.
As a great help, tradingview provides these Fibonacci speed fan lines and extension levels with ease. So if you use the Fibonacci fan line, the extension level, and the SMA 100/200 curve well, you can find an entry point for the stock market. At least you have to enter at this low point to avoid trading failure, and if you are skilled at entering this low point, with fibonacci6180 technique, your reading skill to chart will be greatly improved.
If you want to do day trading, please set the time frame to 5 minutes or 15 minutes, and you will see many of the low point of rising stocks.
If want to prefer long term range trading, you can set the time frame to 1 hr or 1 day.
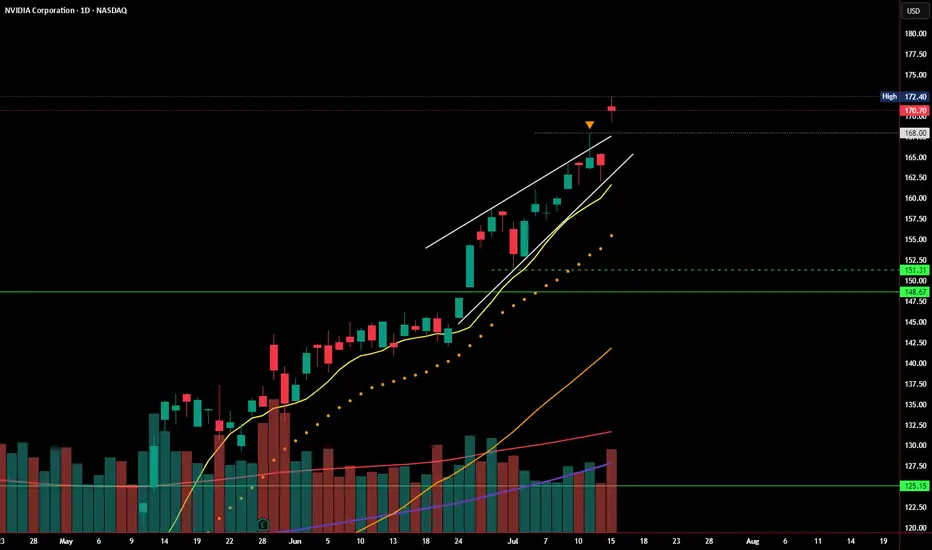
NVDA Update: Breakout Fading or Wedge Still in Play?In my last post, I highlighted the rising wedge pattern forming at the top of NVDA’s strong rally. Price briefly pushed above the upper wedge resistance and tagged $172.40, but today’s session printed a bearish close at $170.70 — just above the breakout level, but with no real follow-through.
Volume came in higher, but price action failed to extend the breakout, suggesting this could be a stall or even a false breakout in progress. RSI remains overbought, and momentum may be slowing despite the recent push.
If price slips back below $168, we could see the original wedge breakdown scenario come back into play. Watch for support around:
🔹 $151.31–148.67
🔹 Below that: $125 zone
For bulls, continuation above $172.40 with strong volume would invalidate this pattern and confirm breakout strength. Until then, caution is warranted.
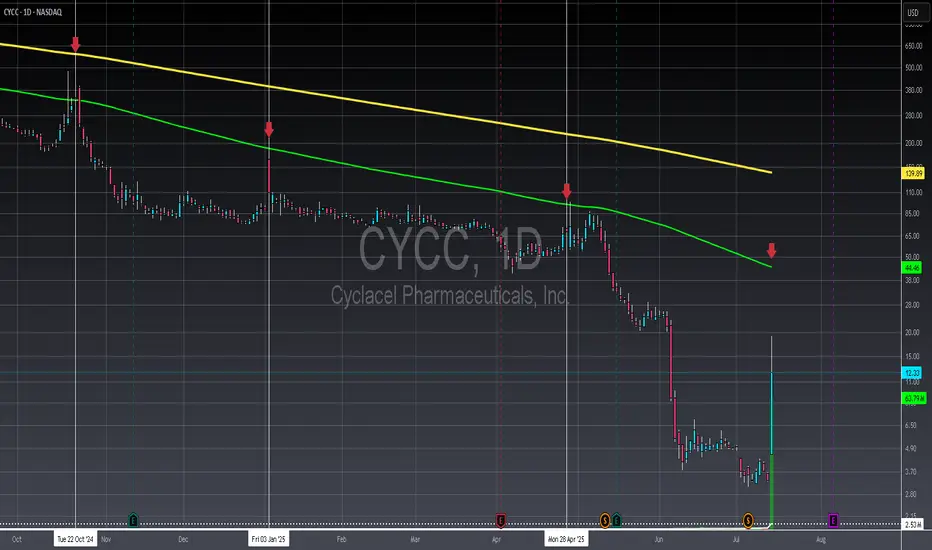
CYCC - Daily - Steer clearIf a company is being forced to split just to stay in line with exchange regulations, that's a huge warning sign right there—it's a clear indication to avoid investing. Secondly, consider this: a company that's been around since 1996 and still can't crack a $50 million market cap? That screams problems with their leadership. Financially, while there was a notable bump in net income between 2023 and 2024, it's not nearly enough to suggest they'll be consistently profitable, especially when you look back at how they were basically hemorrhaging cash from 2020 to 2023. And here's another kicker: despite some improvement in free cash flow since 2022, their cash and equivalents are almost entirely gone. This suggests they might just be shifting expenses around, which is never a good sign. Finally, while it might look like it's targeting the 100 moving average, you've got to ask yourself if you're truly willing to take the hit if it doesn't go your way. If the answer is no, then you're already on your way to being a smarter trader. Move on, there's absolutely nothing special happening here.
Not financial advice, always do your due diligence
Leave a like👍 and/or comment💬.
We appreciate and value everyone's feedback!
- RoninAITrader
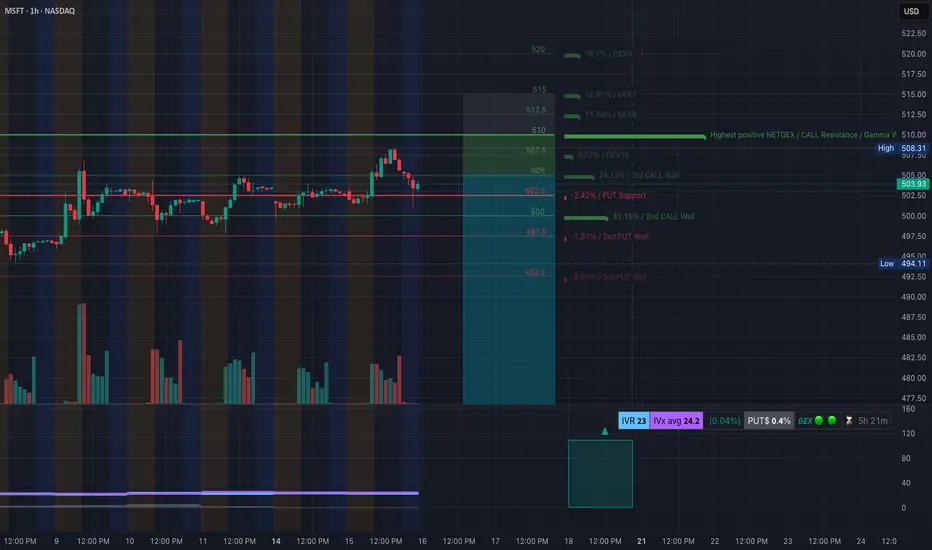
MSFT Setting Up for a Breakdown or Bounce - July 16MSFT Setting Up for a Breakdown or Bounce – Key Option Levels in Play 💥
🔹 Options GEX Analysis (Tanuki GEX View):
* Gamma Resistance (Call Wall):
→ $510 is the highest GEX level, acting as a ceiling.
→ $507.5 is the 3rd Call Wall and minor resistance.
* PUT Walls and Gamma Support:
→ $502.5 = HVL (High Volume Level)
→ $500 = key strike with heavy Put interest
→ $497.5 and $492.5 = deeper support levels
* GEX Bias:
→ IVR = 23, IVx avg = 24.2
→ 0.4% Put Skew → Neutral bias with slight downside lean
→ If MSFT trades below $502.5, dealers may start to hedge short, increasing downside gamma pressure.
🟩 Option Trade Idea:
* Bearish Put Debit Spread:
Buy $505p / Sell $495p for next week
Entry near $503, looking for breakdown to $497.
* Neutral Fade:
Sell Call spread near $507.5–510 if price stays below $504 by open.
🔹 1-Hour Chart Trading Setup (Price Action):
* Structure:
MSFT printed a CHoCH after failing to break the $507 supply zone (order block).
Price lost trendline support and is testing $502 area again.
* Smart Money Concepts:
* BOS occurred into 506s before reversal
* CHoCH confirmed at $502
* Current price is consolidating just above $502. Break below signals weakness.
* Support Zones:
* 502.5 → 500 → 497.5
* Demand at 493–488
* Resistance Zones:
* 504.5 → 506.5 → 510
* Overhead OB rejection seen on last attempt
🟦 Intraday Trade Setup:
Bearish Breakdown Setup:
* Entry: Below $502
* Target: $497.5 → $493
* Stop-loss: $504.50
Reclaim & Squeeze Setup:
* Entry: If holds above $504.5
* Target: $507.5 → $510
* Stop-loss: $502
🧠 My Thoughts:
The failed breakout and CHoCH hint that MSFT may drift down unless it reclaims $504. With options GEX neutral-to-bearish and IV low, a fade toward 497.5–493 could be in play. However, if buyers step in at HVL $502.5 and flip the trendline, we may see a gamma squeeze attempt to $507–510.
This analysis is for educational purposes only and does not constitute financial advice. Always trade with a plan and proper risk management.
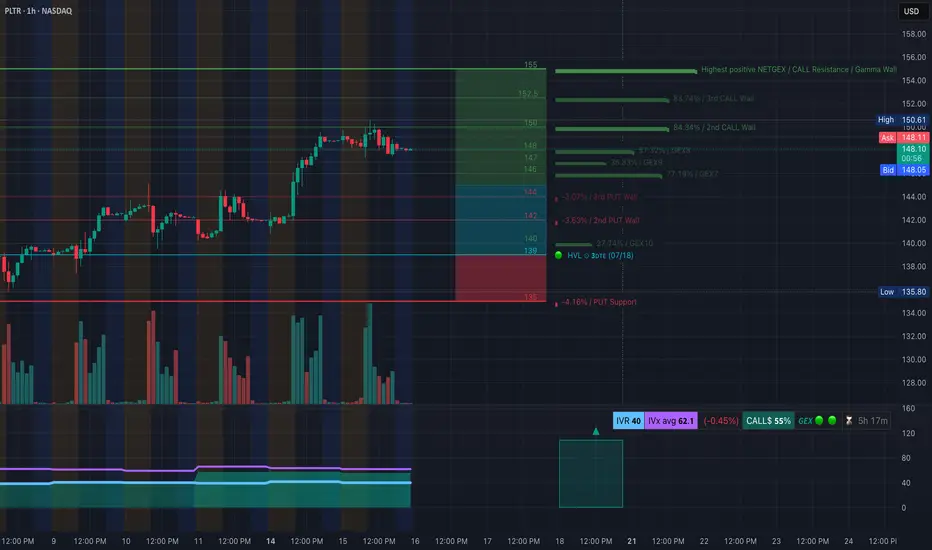
PLTR Sitting on the Edge! Will $147 Hold or Break? July 16Technical Overview:
PLTR is showing signs of a distribution top after a strong rally. The most recent 1H structure shows a Change of Character (CHoCH) just under $149 with lower highs forming and weak bullish reaction.
* CHoCH confirmed under $148.50
* Price struggling inside supply zone: $148.50–$150
* Ascending trendline now broken — possible bearish drift starting
GEX + Options Flow Analysis:
* GEX Resistance Zones:
* $150.00 (83.74% / 3rd Call Wall)
* $152.5 and $155 stacked with heavy GEX Call Resistance
* PUT Walls:
* $144 (3.07%)
* $142 (3.63%)
* Gamma Pivot: $139 = HVL + GEX10 zone
* IVR at 40, with IVx Avg 62.1 → Options relatively quiet, but favoring downside protection
* Call Bias = 55%, but weak
SMC + Price Action:
* BOS followed by CHoCH just beneath $149.15
* Price rejecting inside the OB zone from $148.50–$149.50
* Break of bullish trendline confirms bearish momentum shift
* Downward channel forming under the broken trendline
Trade Scenarios:
📉 Bearish Setup (Favored):
* Entry: $148.20–$148.50 (into supply zone)
* Target 1: $144.50
* Target 2: $139 (HVL + GEX10 support)
* Stop: $150.20
📈 Bullish Breakout (Needs Strength):
* Must break and close above $150
* Entry: Break and retest of $150.50
* Target: $152.5 → $155
* Stop: $148.20
Final Thoughts:
PLTR looks tired near the top of its rally. With GEX resistance above and CHoCH confirmed, the odds favor a pullback unless bulls can reclaim $150 with strength. Watch $147–$144 for possible bounce or breakdown.
This is not financial advice. Please trade based on your own plan and always use proper risk management.
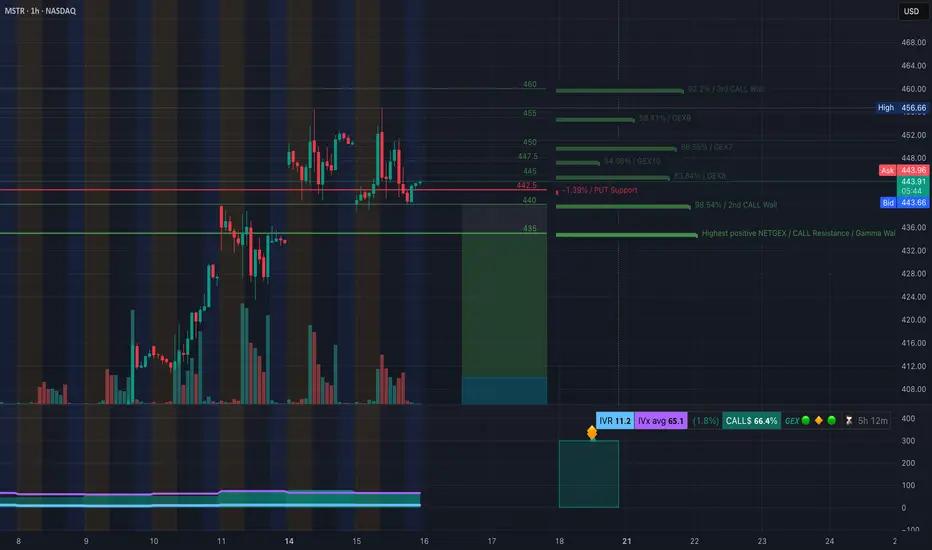
MSTR at Decision Zone! TA for July 16GEX + Price Structure Align for Breakout or Breakdown 🔸
🧠 GEX Levels & Options Sentiment (as of July 15, 2025)
* ⚠️ Key Call Resistance Levels:
• $460 (3rd Call Wall, 92.2%)
• $455 (58.41%)
• $447.5 (GEX10)
• $444.5 (GEX7) – overhead friction
* PUT Support Levels:
• $442.5 (near current price)
• $435 (Gamma Wall: highest positive NET GEX)
* Support Structure: Strong GEX support at $435
* Current IVR: 11.2 (extremely low)
* IVx Avg: 65.1
* Call Flow: 🚀 66.4% Call $ flow — strong bullish bias
* GEX Directional Lean: Bullish-neutral, but decision point is here
💡 Option Strategy Ideas:
* If MSTR holds above $444 → Target $447.5 and $455
• Play: Buy 445c or 450c (weekly expiry)
• Risk: < $442.50 closes
* If MSTR breaks $442 → Watch for slide to $435
• Play: Buy 440p or 435p
• Risk: Tight stop above $444.50 retest
📉 1H Chart Technical Analysis & Trade Plan
* Market Structure:
• Bullish channel still intact, but CHoCH just printed below $443
• Multiple Breaks of Structure (BOS) above $444 and $448.5
• Supply zone between $445–$447 acting as resistance
• Price is testing demand around $440–$442.5 (important junction)
* Trendlines: Price currently bouncing along the lower channel boundary
* Demand Zone: $428–$435 is the major support base
* If CHoCH holds and price fails to reclaim $445 → we could see a deeper retrace into $435
* If bulls reclaim and hold $445 → breakout toward $447.5 → $455 is likely
🔁 Intraday Scenarios for Tuesday (July 16):
* Scalp Long above $445.5
• Target: $447.5, $455
• Stop: below $443
* Scalp Put below $442
• Target: $435
• Stop: Above $444.50
🔚 Final Thoughts:
MSTR is at a make-or-break level, sandwiched between a GEX friction zone and key price structure support. Keep risk tight — this setup can move quickly.
This analysis is for educational purposes only and does not constitute financial advice. Always do your own research and trade responsibly.
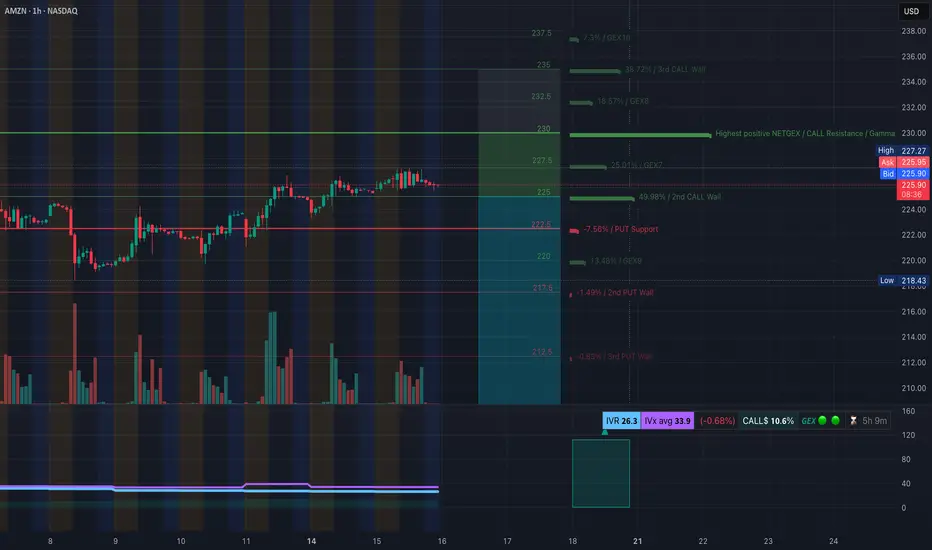
AMZN at a Crossroad! TA for July 16Options & Intraday Trading Setups to Watch This Week 🔍
🧠 GEX Analysis & Options Sentiment (Tanuki)
* GEX Sentiment: Mildly Bullish
* CALLs Volume: 10.6% → Neutral-to-Weak Bullish
* IV Rank (IVR): 26.3 → Low implied volatility rank
* IVx Avg: 33.9 → Neutral options environment
Gamma Walls / Levels to Note:
* Resistance (Call Walls):
* $230 = Highest positive NETGEX / Resistance
* $232.5 = GEX8 (18.57%)
* $235 = 3rd Call Wall
* Support (Put Walls):
* $222.5 = Strongest GEX Put Support
* $220 = GEX6 (13.48%)
* $217.5–$212.5 = Additional soft Put Walls
→ Suggested Option Plays Based on GEX:
* Bullish Scenario (above 226.5):
* Buy $230C expiring this or next week. Target resistance at $230–$232.
* Avoid heavy premium; use spreads for low IV.
* Bearish Scenario (breaks 222.5):
* Buy $220P if price loses $223 with volume confirmation.
* Add $217.5P runner if 220 breaks.
📉 1-Hour Chart Technical Setup (SMC, CHoCH, BOS)
* Market Structure:
* Still in Uptrend but showing early weakness.
* Recent CHoCH formed at 225.80 area, BOS confirmed below intraday trendline.
* Key Price Zones:
* Support Zone: 222.5–219.7 (Demand + GEX Put wall)
* Resistance Zone: 226.6–230.0 (CHoCH supply + GEX CALL wall)
* Trendline Watch: Bullish channel tested, rising diagonal support still holds.
* Breakdown Risk: Below 223 could flip structure to bearish short-term.
📊 Trading Plan Based on Price Action:
If Bullish:
* Entry above 226.6 (hold above BOS + reclaim trendline).
* Target: 230 → 232.5
* Stop-loss: Below 225.3
If Bearish:
* Entry below 223.3 with candle close.
* Target: 220 → 219.7
* Stop-loss: Above 225.5
Scalpers: Watch for liquidity sweeps at 225–226 for fast rejection or reclaim setups.
Swing traders: Wait for clean direction post-break of 230 or 222.5.
🧭 Final Thoughts:
AMZN is consolidating under gamma resistance at $230 while sitting on soft structure. Options are pricing in a neutral bias, but a breakout could cause a gamma squeeze above $230. Watch the CHoCH and BOS areas closely this week. Stay reactive — let price lead.
Disclaimer: This analysis is for educational purposes only and does not constitute financial advice. Always do your own research and manage risk responsibly.
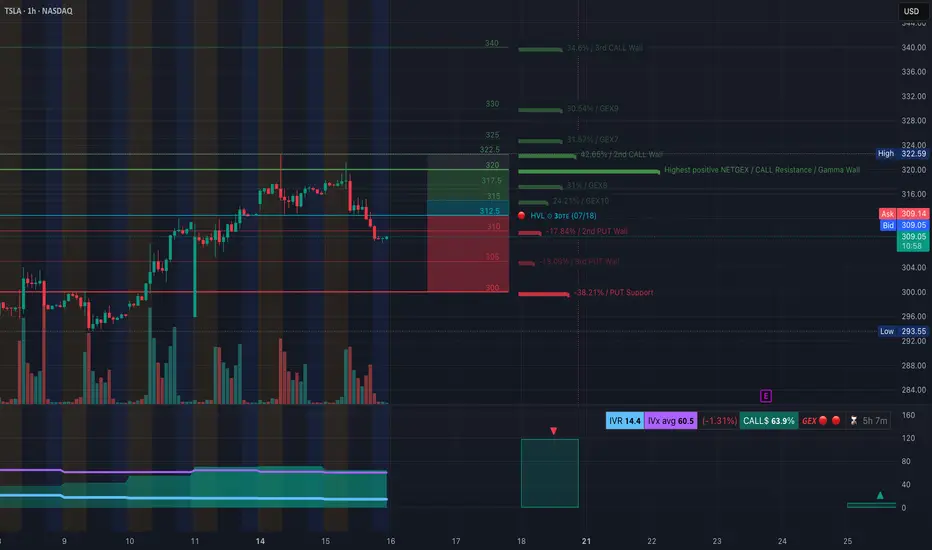
TSLA at a Turning Point. Gamma Flip + Price Breakdown? TAJuly 16🔍 GEX Analysis (Options Sentiment)
* Key Call Walls (Resistance):
* $322.5: +42.65% GEX — Major resistance and 2nd Call Wall
* $325 / $330: More overhead call resistance
* $317.5: Minor resistance
* Gamma Flip Zone (Highest Net GEX / Resistance):
* Around $320–322.5, price is likely to face supply pressure from dealers hedging short calls.
* PUT Walls (Support):
* $305: 2nd PUT Wall (−17.84% GEX)
* $300: PUT Support (−38.21% GEX)
* HVL (High Volume Level):
* $312.5: High-volume strike for this week’s expiration – significant battleground.
* IVR/Flow:
* IVR is 14.4 – low implied volatility.
* Call bias dominates: Calls 63.9% vs Puts.
* GEX sentiment = 🟥 Bearish leaning.
💡 Options Strategy Based on GEX
* Bearish Play:
* Buy 305P or 300P for short-term swing into the gamma void.
* Best risk:reward as dealers are likely to unwind positive gamma, accelerating downside toward PUT walls.
* Neutral-to-Bearish Strategy:
* Bear Call Spread around $317.5–$322.5 (above HVL, inside call wall congestion).
* Expect price rejection below $317.5 if no reclaim happens.
* Avoid CALLs unless price reclaims and holds above $317.5 with strong volume and momentum shift.
📈 1-Hour Chart Technical Analysis
* Structure:
* Bearish CHoCH and confirmed Break of Structure (BOS) below $310.
* Price dropped from the upper OB and failed retest confirms supply zone around $317–$321.
* Trendlines:
* Descending wedge forming with lower highs and current support at $307.97 and $305.
* Watch for bounce-to-fail retests at $312.5 or breakdown continuation.
* Zones to Watch:
* Bearish Order Block (OB): $316–$321 (purple zone) = Sell zone.
* Demand/Support Zone: $293–$296 (green box) – likely bounce zone.
📌 Trade Scenarios
* Bearish Intraday Trade Setup:
* Entry: Below $309 or retest rejection from $312.5
* Target: $305 → $300
* Stop: Above $313 or OB invalidation at $317.5
* Bullish Counterplay (Only if confirmed):
* Entry: Hold above $317.5
* Target: $322.5 → $325
* Stop: Break below $315
🎯 Final Thoughts
TSLA looks weak and in distribution after sweeping local highs. The current GEX map favors bearish continuation, and the 1H BOS confirms breakdown structure. Unless $317.5 is reclaimed, bears have the upper hand.
Disclaimer: This analysis is for educational purposes only and not financial advice. Always do your own research and manage risk before trading.
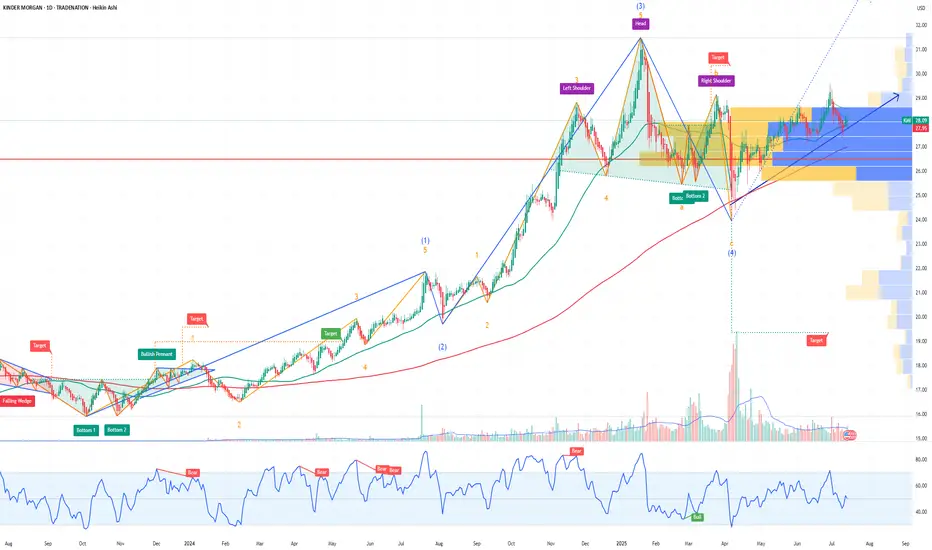
KMI Kinder Morgan Options Ahead of EarningsAnalyzing the options chain and the chart patterns of KMI Kinder Morgan prior to the earnings report this week,
I would consider purchasing the 28.5usd strike price Calls with
an expiration date of 2025-7-18,
for a premium of approximately $0.25.
If these options prove to be profitable prior to the earnings release, I would sell at least half of them.
Disclosure: I am part of Trade Nation's Influencer program and receive a monthly fee for using their TradingView charts in my analysis.