AMZN at a Crossroad! TA for July 16Options & Intraday Trading Setups to Watch This Week 🔍
🧠 GEX Analysis & Options Sentiment (Tanuki)
* GEX Sentiment: Mildly Bullish
* CALLs Volume: 10.6% → Neutral-to-Weak Bullish
* IV Rank (IVR): 26.3 → Low implied volatility rank
* IVx Avg: 33.9 → Neutral options environment
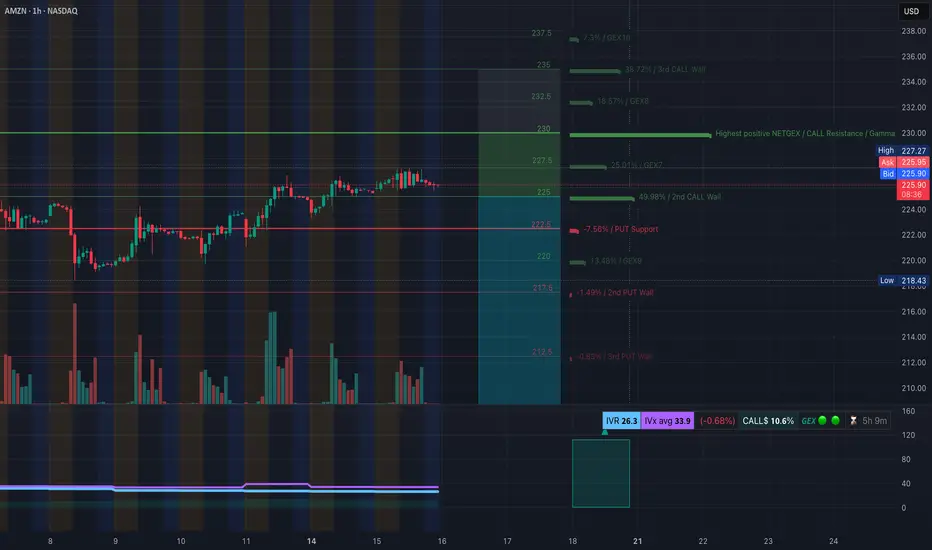
Gamma Walls / Levels to Note:
* Resistance (Call Walls):
* $230 = Highest positive NETGEX / Resistance
* $232.5 = GEX8 (18.57%)
* $235 = 3rd Call Wall
* Support (Put Walls):
* $222.5 = Strongest GEX Put Support
* $220 = GEX6 (13.48%)
* $217.5–$212.5 = Additional soft Put Walls
→ Suggested Option Plays Based on GEX:
* Bullish Scenario (above 226.5):
* Buy $230C expiring this or next week. Target resistance at $230–$232.
* Avoid heavy premium; use spreads for low IV.
* Bearish Scenario (breaks 222.5):
* Buy $220P if price loses $223 with volume confirmation.
* Add $217.5P runner if 220 breaks.
📉 1-Hour Chart Technical Setup (SMC, CHoCH, BOS)
* Market Structure:
* Still in Uptrend but showing early weakness.
* Recent CHoCH formed at 225.80 area, BOS confirmed below intraday trendline.
* Key Price Zones:
* Support Zone: 222.5–219.7 (Demand + GEX Put wall)
* Resistance Zone: 226.6–230.0 (CHoCH supply + GEX CALL wall)
* Trendline Watch: Bullish channel tested, rising diagonal support still holds.
* Breakdown Risk: Below 223 could flip structure to bearish short-term.
📊 Trading Plan Based on Price Action:
If Bullish:
* Entry above 226.6 (hold above BOS + reclaim trendline).
* Target: 230 → 232.5
* Stop-loss: Below 225.3
If Bearish:
* Entry below 223.3 with candle close.
* Target: 220 → 219.7
* Stop-loss: Above 225.5
Scalpers: Watch for liquidity sweeps at 225–226 for fast rejection or reclaim setups.
Swing traders: Wait for clean direction post-break of 230 or 222.5.
🧭 Final Thoughts:
AMZN is consolidating under gamma resistance at $230 while sitting on soft structure. Options are pricing in a neutral bias, but a breakout could cause a gamma squeeze above $230. Watch the CHoCH and BOS areas closely this week. Stay reactive — let price lead.
Disclaimer: This analysis is for educational purposes only and does not constitute financial advice. Always do your own research and manage risk responsibly.
TSLA at a Turning Point. Gamma Flip + Price Breakdown? TAJuly 16🔍 GEX Analysis (Options Sentiment)
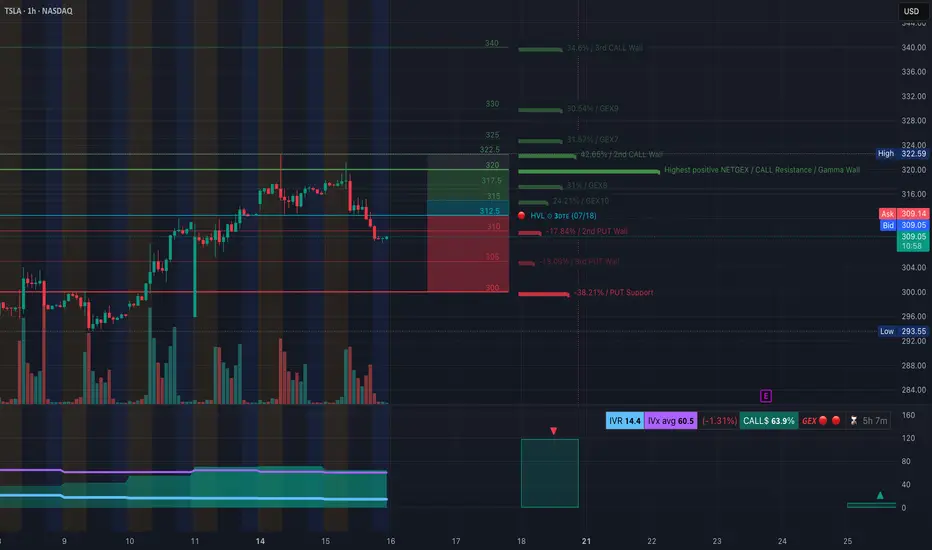
* Key Call Walls (Resistance):
* $322.5: +42.65% GEX — Major resistance and 2nd Call Wall
* $325 / $330: More overhead call resistance
* $317.5: Minor resistance
* Gamma Flip Zone (Highest Net GEX / Resistance):
* Around $320–322.5, price is likely to face supply pressure from dealers hedging short calls.
* PUT Walls (Support):
* $305: 2nd PUT Wall (−17.84% GEX)
* $300: PUT Support (−38.21% GEX)
* HVL (High Volume Level):
* $312.5: High-volume strike for this week’s expiration – significant battleground.
* IVR/Flow:
* IVR is 14.4 – low implied volatility.
* Call bias dominates: Calls 63.9% vs Puts.
* GEX sentiment = 🟥 Bearish leaning.
💡 Options Strategy Based on GEX
* Bearish Play:
* Buy 305P or 300P for short-term swing into the gamma void.
* Best risk:reward as dealers are likely to unwind positive gamma, accelerating downside toward PUT walls.
* Neutral-to-Bearish Strategy:
* Bear Call Spread around $317.5–$322.5 (above HVL, inside call wall congestion).
* Expect price rejection below $317.5 if no reclaim happens.
* Avoid CALLs unless price reclaims and holds above $317.5 with strong volume and momentum shift.
📈 1-Hour Chart Technical Analysis
* Structure:
* Bearish CHoCH and confirmed Break of Structure (BOS) below $310.
* Price dropped from the upper OB and failed retest confirms supply zone around $317–$321.
* Trendlines:
* Descending wedge forming with lower highs and current support at $307.97 and $305.
* Watch for bounce-to-fail retests at $312.5 or breakdown continuation.
* Zones to Watch:
* Bearish Order Block (OB): $316–$321 (purple zone) = Sell zone.
* Demand/Support Zone: $293–$296 (green box) – likely bounce zone.
📌 Trade Scenarios
* Bearish Intraday Trade Setup:
* Entry: Below $309 or retest rejection from $312.5
* Target: $305 → $300
* Stop: Above $313 or OB invalidation at $317.5
* Bullish Counterplay (Only if confirmed):
* Entry: Hold above $317.5
* Target: $322.5 → $325
* Stop: Break below $315
🎯 Final Thoughts
TSLA looks weak and in distribution after sweeping local highs. The current GEX map favors bearish continuation, and the 1H BOS confirms breakdown structure. Unless $317.5 is reclaimed, bears have the upper hand.
Disclaimer: This analysis is for educational purposes only and not financial advice. Always do your own research and manage risk before trading.
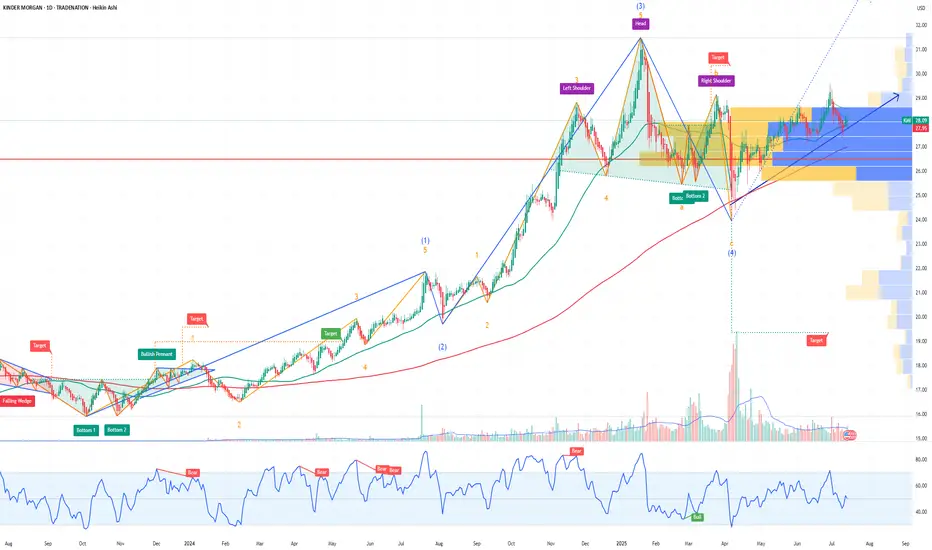
KMI Kinder Morgan Options Ahead of EarningsAnalyzing the options chain and the chart patterns of KMI Kinder Morgan prior to the earnings report this week,
I would consider purchasing the 28.5usd strike price Calls with
an expiration date of 2025-7-18,
for a premium of approximately $0.25.
If these options prove to be profitable prior to the earnings release, I would sell at least half of them.
Disclosure: I am part of Trade Nation's Influencer program and receive a monthly fee for using their TradingView charts in my analysis.
GOOGL Ready to Recharge or Break? TA for July 16📊 GEX Sentiment & Options Outlook (Based on July 15 Data)
* Key Resistance Zone:
‣ 184–185: Highest Positive NET GEX, 3rd Call Wall → Strong gamma resistance
‣ 190–192.5: Additional call wall cluster—unlikely to break without strong momentum
‣ 195: GEX10 level (top bullish magnet if a breakout triggers)
* Support Zone:
‣ 180: Minor call wall, near current price
‣ 177.5: HVL zone for July 18 expiration — gamma cushion
‣ 172.5 / 167.5: Key PUT walls — heavy gamma support
* GEX Bias:
→ Neutral-to-Bullish skew with 43.11% Call Wall support near 180, and strong upward pressure up to 185 if price stays above 180.
* Options Sentiment:
* IVR: 38.8 (moderate)
* Calls Dominance: 27% of total options flow
* Bias: Bullish if price remains above 180 base; bearish break under 177.5 may open path to PUT zones.
📈 1-Hour Chart Smart Money Price Action (SMC-Based Analysis)
* Market Structure:
* Strong BOS (Break of Structure) confirms trend
* Minor CHoCH pullback near 180–182 zone showing healthy consolidation
* Holding mid-channel support trendline
* Key Zones:
* Purple Supply Zone at 182.5–183.5 — expect reactions
* Demand Zone near 174.5–172.5 — major support and rebuy area
* Trendline Support: Still intact, price respecting channel so far
* Trade Scenarios:
🔹 Bullish Setup:
* Entry: Break and hold above 183
* Target: 185 → 187.5
* Stop: Below 180
* 🔻 Bearish Setup:
* Entry: Loss of 180 and breakdown under 177.5
* Target: 174.5 → 172
* Stop: Above 182.5
* Bias: Consolidating, leaning bullish if it defends trendline and clears purple supply. Look for a reclaim of 183 with volume for next leg.
🎯 Final Thoughts
If GOOGL holds above 180, there's potential for a gamma squeeze into 185–187.5. However, a break below 177.5 flips sentiment short, targeting the demand zone around 174–172. Wait for structure confirmation before chasing.
This analysis is for educational purposes only and does not constitute financial advice. Always do your own research and manage your risk before trading.

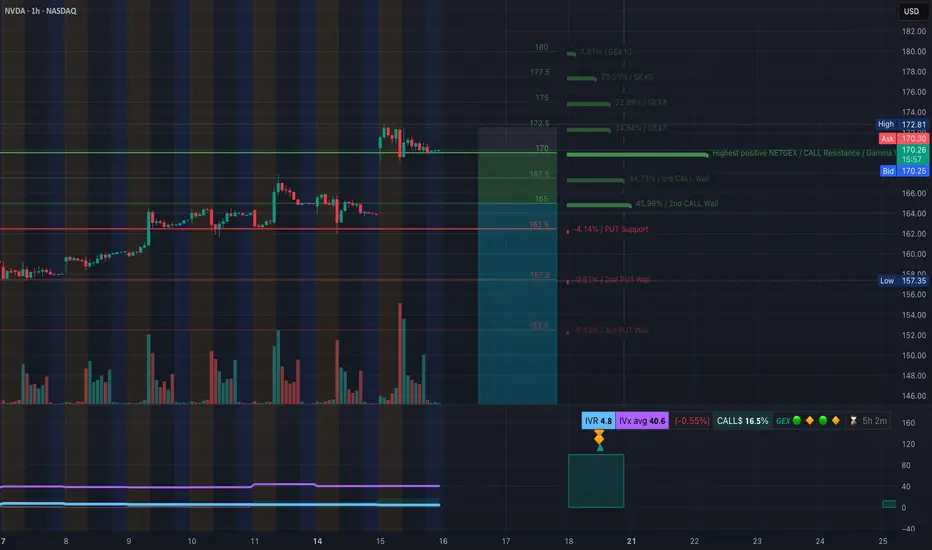
NVDA Bulls in Control Above $170? TA for July16Options Flow and Technical Setup🔥
🧠 GEX & Options Flow Analysis
* GEX Map Summary:
* Highest Call Wall & Gamma Resistance: $172.50
* Major GEX Clusters: $175–$178 → Layered GEX zones, strong positive sentiment
* PUT Support: $162.5 — This is the highest negative NetGEX zone and key downside defense
* IVR: 4.8 (Low)
* IVx: 40.6 (Decaying vol environment)
* Options Skew: 16.5% CALL-dominant bias — Traders leaning bullish.
🧩 Options Trading Suggestions:
* Bullish Play (Preferred Bias):
* Above $170, bulls can look for a push into $172.5 → $175 range.
* Suggested Strategy:
* Buy: $172.5 or $175 CALL (0DTE or 7/19 expiry)
* Condition: NVDA must hold above $170.00 on pullbacks
* Risk: Use $167.5 as a mental stop
* Target: $175–$178 possible gamma magnet if volume kicks in
* Bearish Hedge (if 170 fails):
* Below $167.5, NVDA could revisit $165 or $162.5 PUT wall
* Put Entry Idea: $165 PUT (7/19)
* Only if price shows CHoCH + BOS confirmation
🧠 1H Chart + SMC Price Action Breakdown
* Market Structure: BOS continuation → price consolidating below BOS high
* Current Box: NVDA trapped in a tight SMC range between $167.89–$172.81
* CHoCH Zone: None yet. We’re in a healthy bull flag consolidation pattern
🔍 Trading Scenarios:
* Bullish Setup:
* Wait for breakout above $172.5
* If price closes above and retests → long to $175, $178
* Alternatively, accumulate calls if price bounces from $170 with strength
* Bearish Setup:
* Watch $167.89 → a CHoCH and BOS below this opens $165, $162.5
* Be cautious: this is a bullish structure unless macro news hits
✅ Final Thoughts:
NVDA remains one of the strongest charts on the board. The consolidation under $172.5 is healthy, and GEX flow shows bullish momentum building. As long as $170 holds, this setup favors long trades, especially toward $175–$178.
Disclaimer: This analysis is for educational purposes only and not financial advice. Always do your own due diligence and manage risk properly.
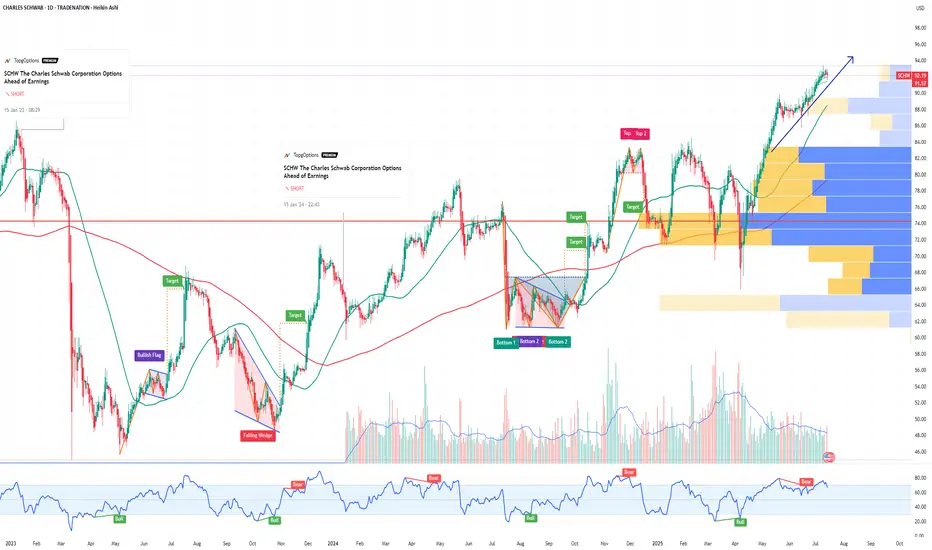
SCHW The Charles Schwab Corporation Options Ahead of EarningsIf you haven`t sold SCHW before the sell-off:
Now analyzing the options chain and the chart patterns of SCHW The Charles Schwab Corporation prior to the earnings report this week,
I would consider purchasing the 92.5usd strike price Calls with
an expiration date of 2026-1-16,
for a premium of approximately $7.15.
If these options prove to be profitable prior to the earnings release, I would sell at least half of them.
Disclosure: I am part of Trade Nation's Influencer program and receive a monthly fee for using their TradingView charts in my analysis.
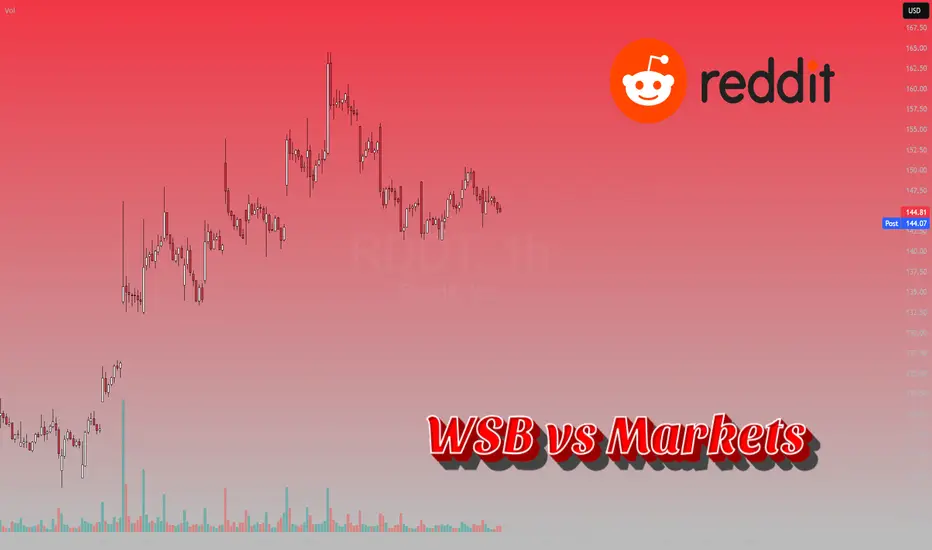
Wallstreetbets and Markets: Is there a correlation? Preface:
As a self proclaimed “market statistician”, I like to do a lot of random research, sometimes useful, sometimes not so useful.
Here is a post about some “not so useful” research I did. Though not so useful, the results are truly interesting.
The results of this analysis are, in my opinion, pertinent in a post GME and AMC world, where retail have gained huge momentum and presence within the market as a whole and have been able to even tackle hedge funds and win!
Purpose and Aim:
The aim of this was to identify whether Wallstreetbets (heretofore referred to as WSB) data had any meaningful impact on market mechanics, moves, volume etc.
I have been tracking WSB data for some time and have amassed a database of over 300 saved files, consisting of exactly 104 trading days of data.
This is a great amount to actually run analysis on and run some predictive tests!
The main questions I wanted answered are:
a) Does WSB data impacted market moves and Volume? If so,
b) Is WSB reactive to market moves (i.e. the market moves and the ticker trends); or
c) Is WSB proactive in moving the market (i.e. mentions increase and the market move follows).
These questions can be somewhat answered, albeit not flawlessly, using math.
Approach:
To analyze the data, I used:
a) Regression (simple linear);
b) Correlation;
c) Lagged correlation; and
d) Granger Causality
Tickers chosen
I quickly scripted an algorithm to scan through all of the 300+ WSB data and identify the top 10 tickers that were consistently mentioned across all saved data. The data Spans from mid 2024 to current.
The results were as follows, the top 10 tickers which were present in every single saved datafile were:
1 AAPL 104
2 AM 104
3 AMD 104
4 DTE 104
5 GOOG 104
6 MSFT 104
7 NVDA 104
8 PLTR 104
9 QQQ 104
10 SPY 104
Selection for Analysis were:
AAPL, AMD, PLTR and SPY
Raw Results:
NASDAQ:AAPL
NASDAQ:AMD
NASDAQ:PLTR
AMEX:SPY
Oh yeah, let’s see how retail competes with huge indices, this should be really good!
Explanations and Implications
The data presented is all incredibly “mathy”, but let’s break it down to what we can ascertain.
First and foremost, let’s outline the major limitations:
In this analysis, I used large cap stocks and limited to only 4 stocks. The results for these will be greatly different from, say, doing this on small cap or penny stocks (which will be a potential study next!).
As well, we are shy of 1 full year of trading data, which would have more impact on analysis. I do plan to repeat this study with approximately 1 full trading year of WSB data (i.e. 252 days).
So essentially 148 more days and I will have collected 1 full trading year for analysis.
Now that we have that out of the way, let’s discuss what we can say from these results, what we are unsure of and what are the implications for the broader group of traders, MMs and everyone in between.
What we Know
WSB logically has a strong relationship with trade volume. We can see that in most of the analyzed tickers. The correlations tend to be positive and tend to be substantial. More mentions (i.e more hype) leads to greater trade volume, likely as a result of people following the most mentioned or “hot” ideas on WSB.
This is not hard to fathom and its easy to accept as a logical consequence of trending tickers to a large audience of market participants ready to jump at anything.
What we are unsure of
This title is kind of a misnomer. While I phrase it as “what we are unsure of”, the fact remains that we can deduct that there is a significance and a relationship exists; but we can’t be sure as to how deep and profound this relationship extends, owning to the limited amount of data available.
But what we are unsure of is the extent to which WSB is impacting returns and market movement.
In 2 out of 4 tickers, we see that there is a pretty substantial lagged correlation between stock movement/returns and WSB trending status. This implies that WSB may be pushing market movement. However, in both of these cases, the results are short lived. This could be the result of either:
a) The greater market taking over and profit taking on the WSB pump; or
b) The WSBers taking profits themselves after pushing the stock in a direction.
The 2 cases were of AMD and SPY. The results indicated effect of roughly 2 consecutive days before tapering off.
The other 2 tickers, PLTR and AAPL, did not show a very strong relationship or evidence of WSB greatly impacting stock movement, but of WSBers likely “trend following” momentum.
What this means for the broader market?
Its no secret that retail is having a substantial impact on the market and changing the way market dynamics work.
For “experienced” or “senior” traders who have been trading for longer than 4 years, these people would tend to notice that the market dynamics have changed this year and have been changing slowly over the recent years.
One could offer the explanation of changing market sentiment; but perhaps the real explanation is an influx of retail and social media.
If you think about the number of “pump and dump” scams that were successful through the use of social media over the last few years, it’s not hard to believe that the advent of social media and easy access to markets can be a recipe for “disrupting” a routine and destabilizing the market that one once knew.
The NYSE is traded by millions worldwide. Its not just Americans participating, but those globally, leading to participants that surpass even the US population. As we advance in a global information highway that is the internet and social media, its not hard to rally forces to impact change, be it political or financial.
So what does this all mean?
The face of markets is changing and changing fast. No longer are markets strictly influenced by the elite, but by the average Joe who likes to read social media and buy a few options or shares. The implication is essentially the democratization of the market, removed from the grasps of the bourgeoisie and shifted to that of the layman.
Implications for Further Research
This should be repeated on low cap, low float, penny stocks to really analyze the impact of social media on markets and the implications of manipulation and “pump and dump” scams.
Thank you for reading!
This information is for interest sake only and not suggestive of any financial advice of suggestions.
Trade at your own risk and use your own strategies!
Used for this analysis:
R Language
Tradstie API
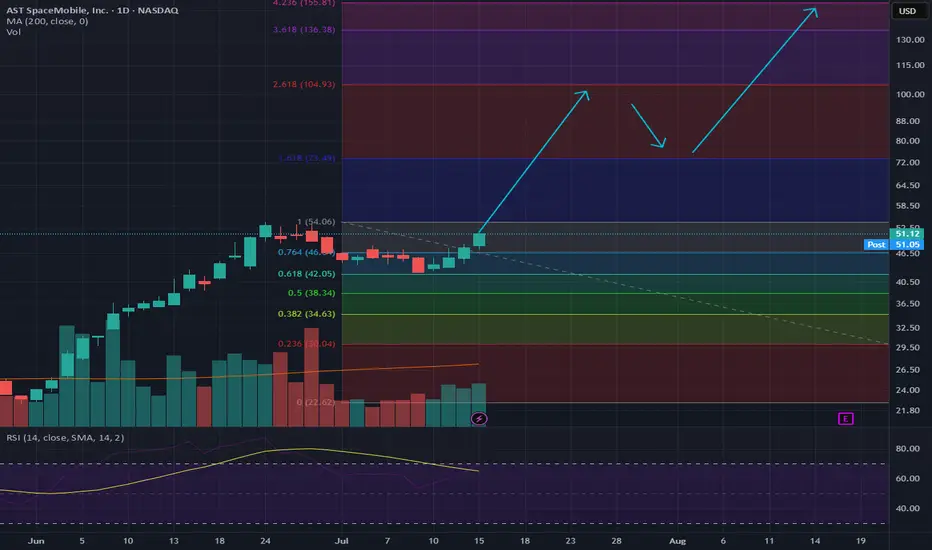
LONG-TERM $ASTSYou can't spell Sats without ASTS
This will be a trillion dollar company - here's the next few years, cheers!
HOOD - Get Great PricingNASDAQ:HOOD and I have had a mixed relationship over the years. I have had my biggest win on the HOOD brokerage (5,000% options trade, $1200 into 60k) and at the same time I was present for the Derogatory removal of the GME button (of which I had sold before they took that button).
After many years and brokerages, I find myself returning to HOOD but this time much more experience... To my surprise, I love the platform, and I still recommend it for new traders for the ease and UI. Honestly, unless you are dealing with BIG Volume or Hot-Keying out of Low float Penny stocks, It will suit you just fine.
Now Let's Talk HOOD.
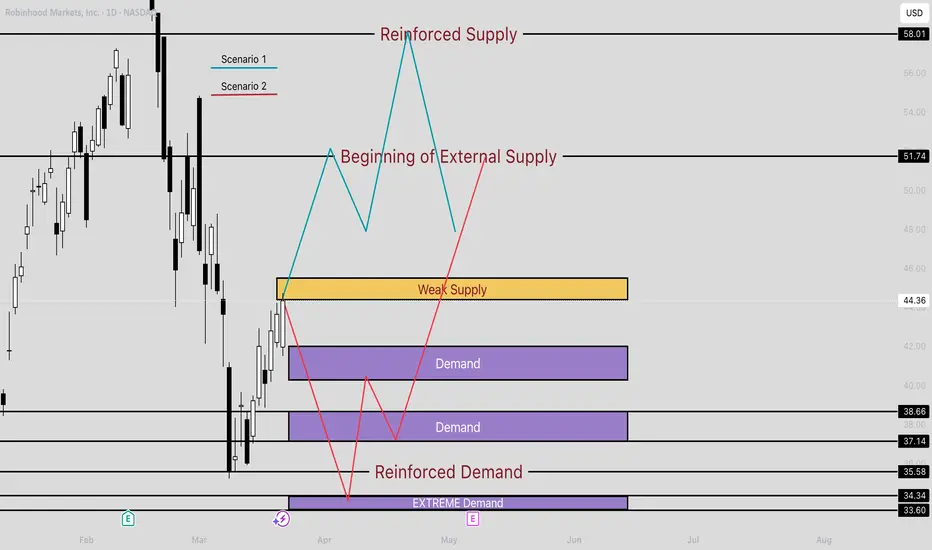
In this MASSIVE range we are looking at High $67, and a Low of $35. Thats a 47% drop!
Although we have recovered a bit, Many are eager to find a way to get in the range. Here I have put together 2 scenarios to help you play your position with confidence.
Better Price = Better psychology
Whether we are shopping at grocery store, or if we are buying a car. Getting a good deal feels better. But how do you feel when you know you overpaid?
TLDR: The best deals are the lowest purple zone "Extreme Demand" if you are Long, "Reinforced Supply" (at the top) if you are looking to get short or take profit.
Under the HOOD
Currently Robinghood is running into a little bit of a supply zone labelled "Weak Supply"
This is a new player, and we don't yet know how just how big this player is. So far they have absorbed some of that buying pressure coming in, but I would not be surprised if they we overtaken or even gapped above come Monday. This brings us to our first Scenario
Scenario 1: Blue line
With the break above "weak supply", there is headroom all the way until 51.74. This is where we will see some supply initially and maybe a small rejection.
Why would it not reject back down to a demand area like 41? Great question.
If this overtakes that "Weak Supply" zone, this will make a strong case that there is momentum behind the wheels here. I think there will be a new player reinforcing this buying if this happens all the way to the Finale at $58.01. From here I would consider taking some profits, maybe partials, or looking for some Puts.
Scenario 2: Red line
Getting Rejected by "Weak supply" would be evidence that this move was fluff. Those two demand zones may try to hold a bit, but with the lack of buying interest in the
$45 area, this won't make those buyers feel confident.
This is different story when comparing to the "Extreme Demand" zone (lowest purple zone). Buyers here have PROVEN that this is something they are very interested and they are not done accumulating yet. So from this location buyers feel confident that they are getting a good price*( see fn. )
From here this should drive demand up again, crushing shorts, and sending another nice squeeze to test that supply at 51.71
WHEW! if you made it this far, I appreciate your time!
Upvote/Follow if you enjoyed this idea, there are many more to come!
Happy trading!
* (This is a good price, because buyers are showing that it is. Although, if it did come down here, this would be the 4th test of this area. I still think there will be strong demand here, but this isn't the best tests. 2nd and 3rd were stronger.)
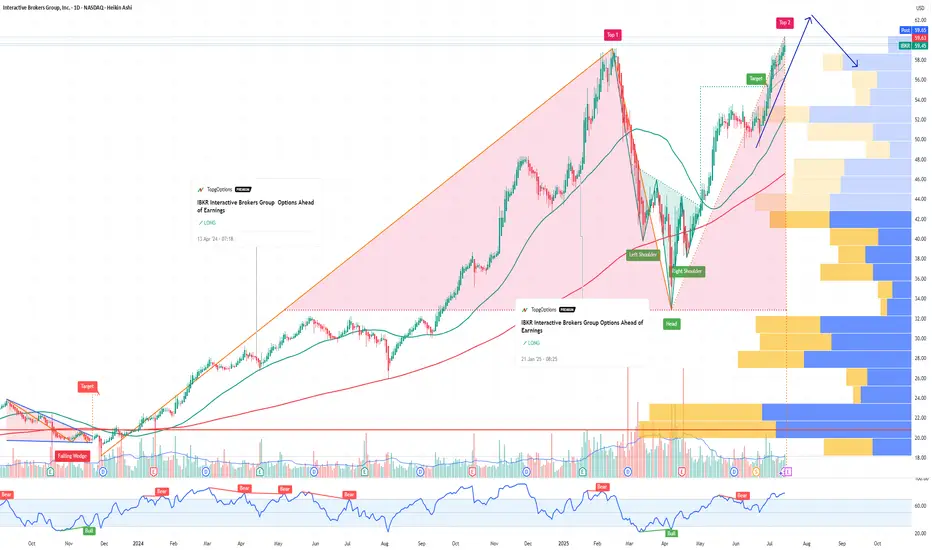
IBKR Interactive Brokers Group Options Ahead of EarningsIf you haven`t bought IBKR before the rally:
Now analyzing the options chain and the chart patterns of IBKR Interactive Brokers prior to the earnings report this week,
I would consider purchasing the 60usd strike price Calls with
an expiration date of 2025-9-19,
for a premium of approximately $3.90.
If these options prove to be profitable prior to the earnings release, I would sell at least half of them.
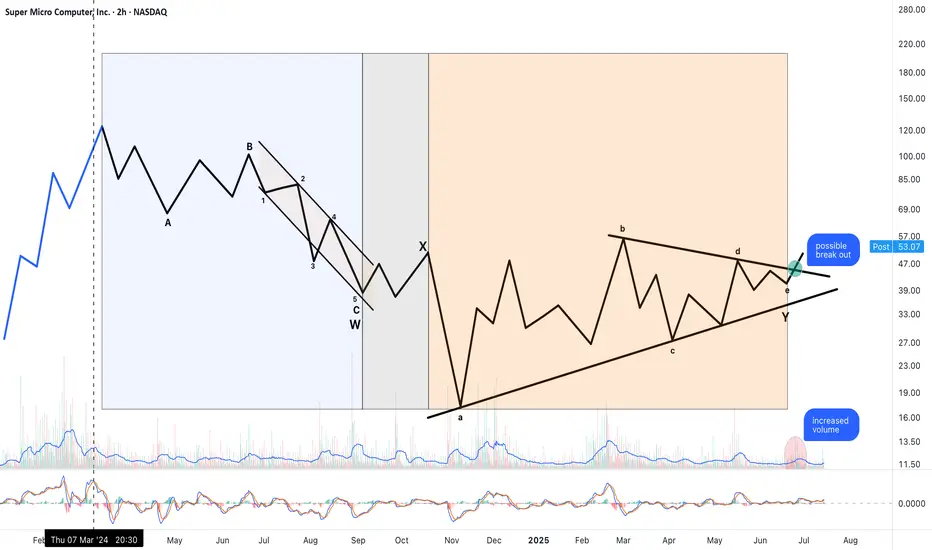
NeoWave Structure: Flat–X–Triangle Combination - break outThis chart illustrates a possible NeoWave-style corrective combination: a Flat–X–Triangle structure, likely completed and followed by a breakout.
W Wave: A well-structured Flat correction (labeled A–B–C) with a clean internal 5-wave impulse in C. Balanced time and volume across subcomponents suggest structural completion.
X Wave: A simple, proportionally shallow X connector, in line with NeoWave time and price minimums.
Y Wave: A textbook contracting triangle (labeled a–b–c–d–e), with near-perfect Fibonacci relationships between legs:
• Wave b retraces approximately 61.8% of wave a
• Wave d retraces approximately 78.6% of wave c
• Time symmetry is preserved
• Volume compresses into the apex, a classic triangle behavior
Breakout Observed:
• Price has moved above triangle resistance
• Volume increased at breakout
• MACD shows positive crossover and rising momentum
Interpretation:
This may mark the end of a prolonged corrective structure and the beginning of a new impulsive sequence. Triangle projection targets suggest the $77–80 area as a minimum, with higher Fibonacci extensions possible (e.g., 1.618 or 2.618 of prior moves) if this evolves into a 3rd wave.
Technical Approach:
This analysis follows NeoWave principles (Glenn Neely), emphasizing structural clarity, wave proportion, time-price balance, and breakout behavior.
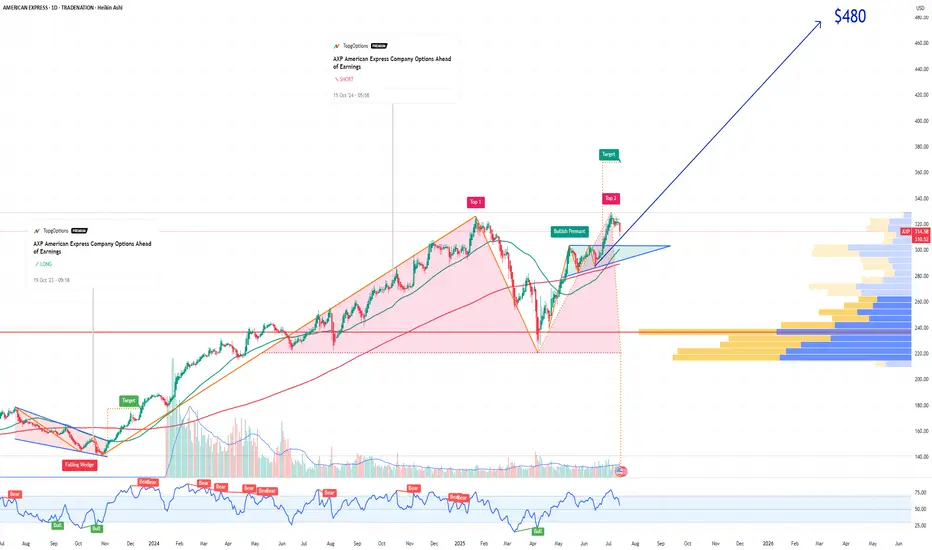
AXP American Express Company Options Ahead of EarningsIf you haven`t bought AXP before the rally:
Now analyzing the options chain and the chart patterns of AXP American Express Company prior to the earnings report this week,
I would consider purchasing the 480usd strike price Calls with
an expiration date of 2027-1-15,
for a premium of approximately $6.25.
If these options prove to be profitable prior to the earnings release, I would sell at least half of them.
Disclosure: I am part of Trade Nation's Influencer program and receive a monthly fee for using their TradingView charts in my analysis.
HIVE / 4hAccording to the prior analysis, NASDAQ:HIVE may have developed a sequence of Minor degree waves, in which the waves of 1 and 2 both were completed, and impulse 3 has remained in progress.
Wave Analysis >> The correction in wave iv (circled) may have been thoroughly done in a flat formation. An impulsive wave v(circled) of the Minor degree wave 3 might be extended towards the Fib-extension target >> 3.84
NASDAQ:HIVE CRYPTOCAP:BTC MARKETSCOM:BITCOIN
#CryptoStocks #HIVE #BTCMining #Bitcoin #BTC

WULF / 3hAs a second alternative, NASDAQ:WULF may have developed a five-wave impulsive sequence as the Minor degree wave C, in which its 4th wave correction in a triangle appears to be over at 4.82.
So, the final advance by 15% in the same degree wave v(circled) lies ahead to conclude the Minor degree wave C of the entire correction in an A-B-C zigzag as a countertrend advance in Intermediate degree wave (B).
Trend Analysis >> The countertrend advance as Intermediate degree wave (B) will probably change to decline in the same degree wave (C) very soon!! And it'll likely last until the end of the year.
#CryptoStocks #WULF #BTCMining #Bitcoin #BTC
NASDAQ:WULF CRYPTOCAP:BTC MARKETSCOM:BITCOIN

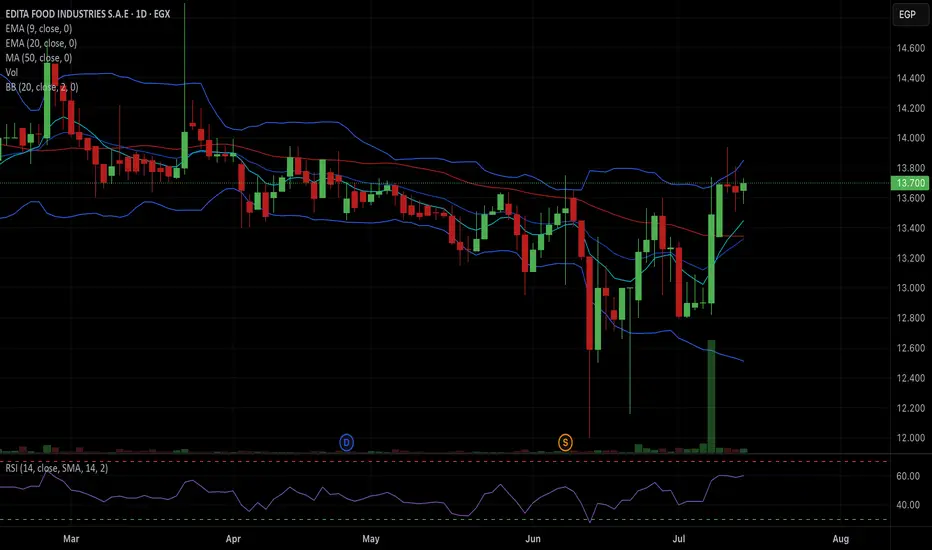
EFID Trade plan🔹 Entry: Above 13.85 (confirmed breakout of upper BB and resistance zone)
🔹 Stop-Loss: 13.33
🔹 Profit Target:
• TP1: 14.20 (next resistance zone – upper wick from mid-March)
• TP2: 14.60 (monthly resistance)
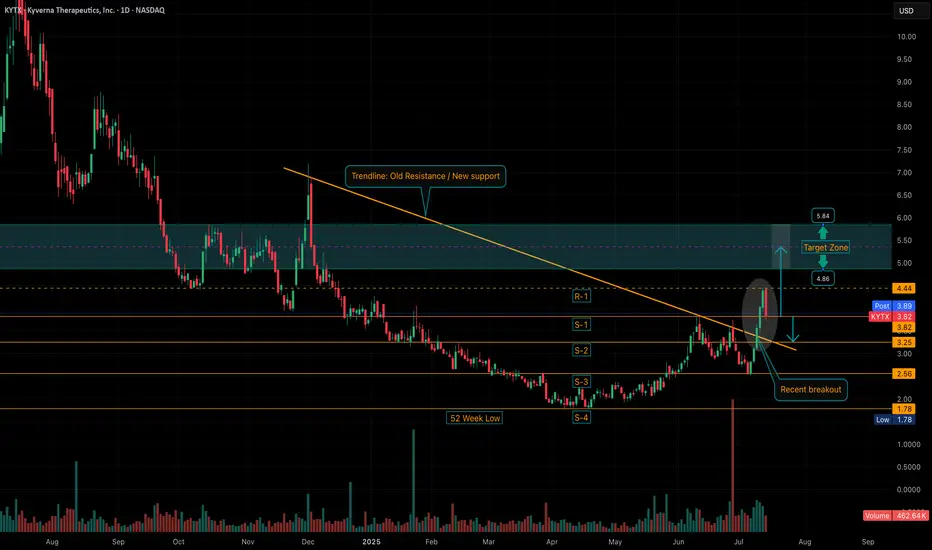
KYTX: Healthy Retracement After Strong Move – Key Support LevelsChart update: We tagged resistance at $4.44 (R-1) before pulling back and closing right at S-1 support ($3.82). After the strong multi-day run from the $2.50 zone, this kind of retracement is normal... even healthy.
If we see further downside, I’m watching $3.25 (S-2), which lines up well with the reclaimed trendline that should now serve as support.
Still viewing this as digestion, not distribution. Setup’s intact, IMO. Stay tuned.
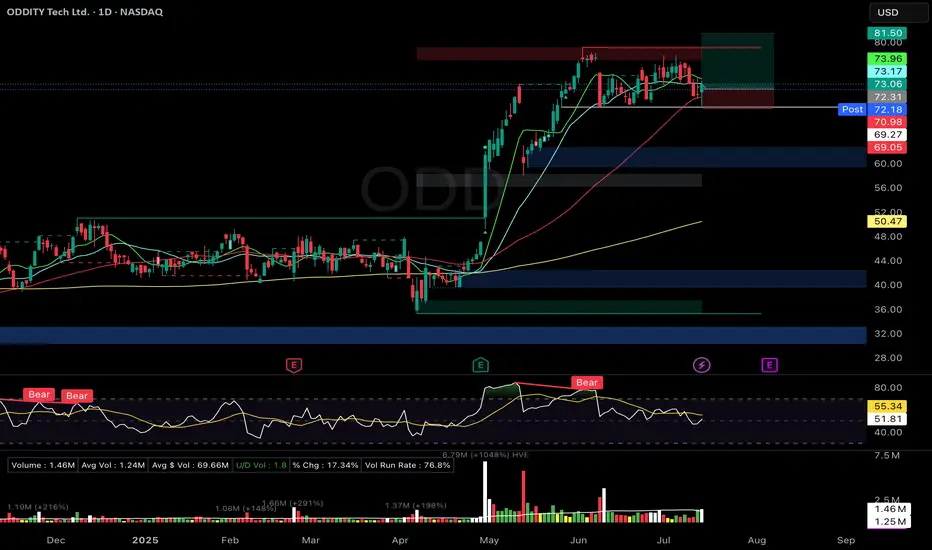
ODD Flat Base (Stage 2) – Support ReversalOddity Tech Ltd. ( NASDAQ:ODD )
🚀 Entry: $72.31
📊 Setup: Flat Base (Stage 2) – Support Reversal
🛑 Stop: $69.05
🎯 Target: $89.50
🔑 Why I Entered:
Solid 6-week flat base (~13% depth) with a bullish hammer candle reversal off the 50-DMA and key support.
Moving averages (10/21/50 DMA) are coiling tightly, indicating a potential breakout.
Strong institutional accumulation signals backed by increasing volume.
Exceptional fundamentals: EPS growth at 79%, RS Rating at 95, Composite at 97 (per IBD).
🎯 What's Next:
Watching for a decisive breakout above the $79.18 pivot on high volume for a potential scale-in.
Earnings due in two weeks—staying vigilant for any unusual volatility ahead of the announcement.
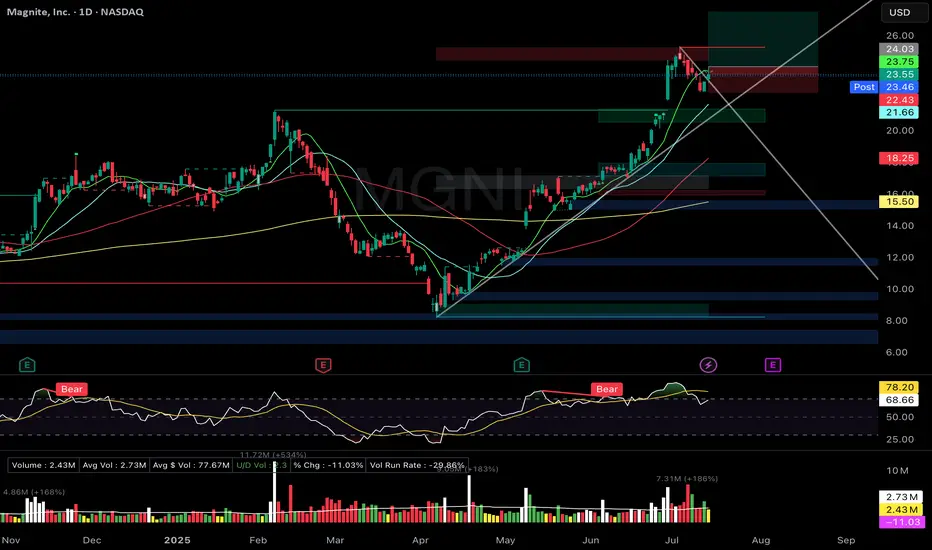
MGNI Zanger-style Bull Flag Breakout PullbackMagnite Inc. (MGNI)
🚀 Entry: $24.03
📊 Setup: Zanger-style Bull Flag Breakout Pullback
🛑 Stop: $22.43
🎯 Target: $27.50
🔑 Why I Entered:
Picture-perfect bull-flag pullback pattern with volume drying significantly, tapping precisely on the rising trendline.
Price action holding strong above rising short-term EMAs (9/21).
Excellent relative strength, reflecting a previous strong-volume breakout move.
🎯 What's Next:
Seeking strong volume surge confirmation to confirm continuation of the breakout.
Earnings report in three weeks—ready to take partial profits if price significantly appreciates ahead of the event.
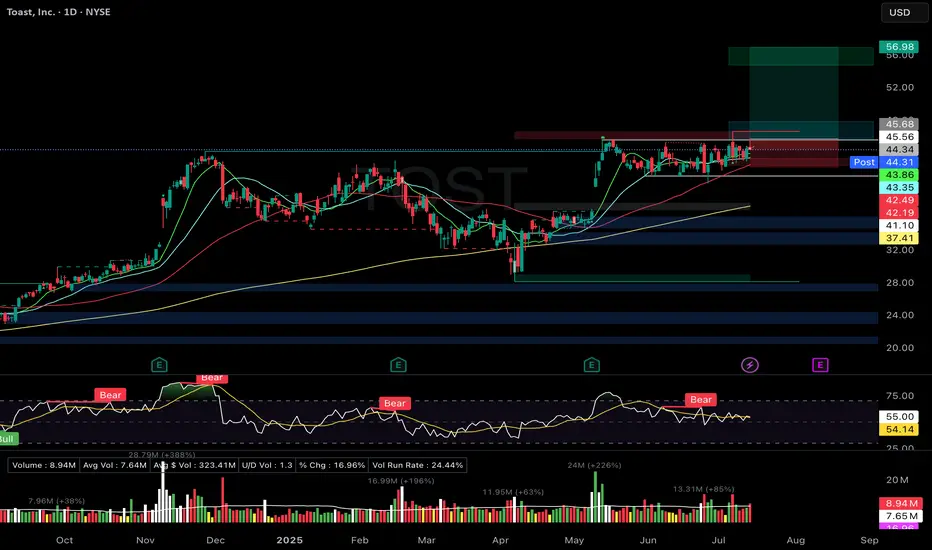
TOST Flat Base Breakout AttemptToast Inc. (TOST)
🚀 Entry: $45.68
📊 Setup: Flat Base Breakout Attempt
🛑 Stop: $42.19
🎯 Target: $56.98
🔑 Why I Entered:
Ideal flat base formation, tight consolidation under $45.56 pivot with volume drying up neatly between key moving averages.
Clear bullish moving average stack (rising 10/21/50/200 DMA).
Strong relative strength rating (92) with accelerating EPS growth signaling fundamental leadership.
🎯 What's Next:
Confirming breakout with strong volume above $46.00 pivot; will tighten stops accordingly once confirmed.
Earnings expected in four weeks—will closely manage the position as the event approaches.
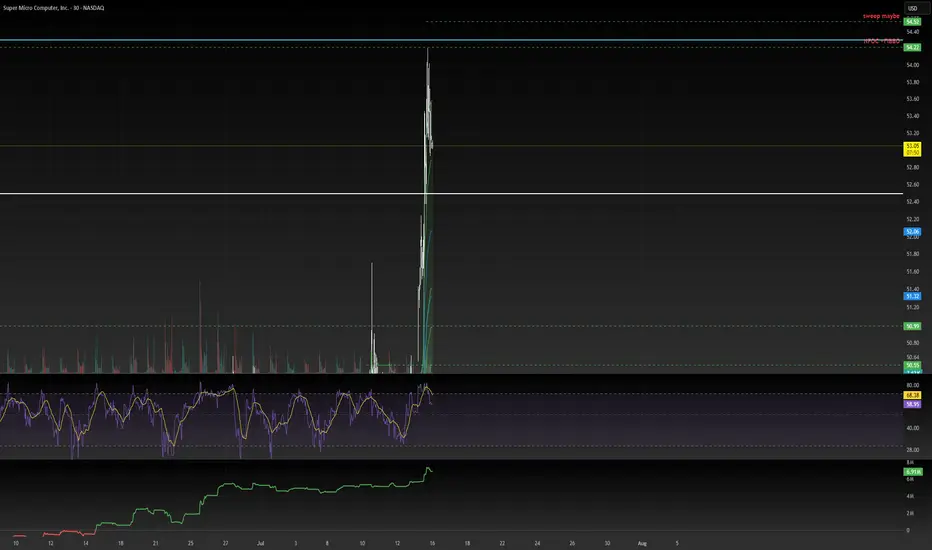
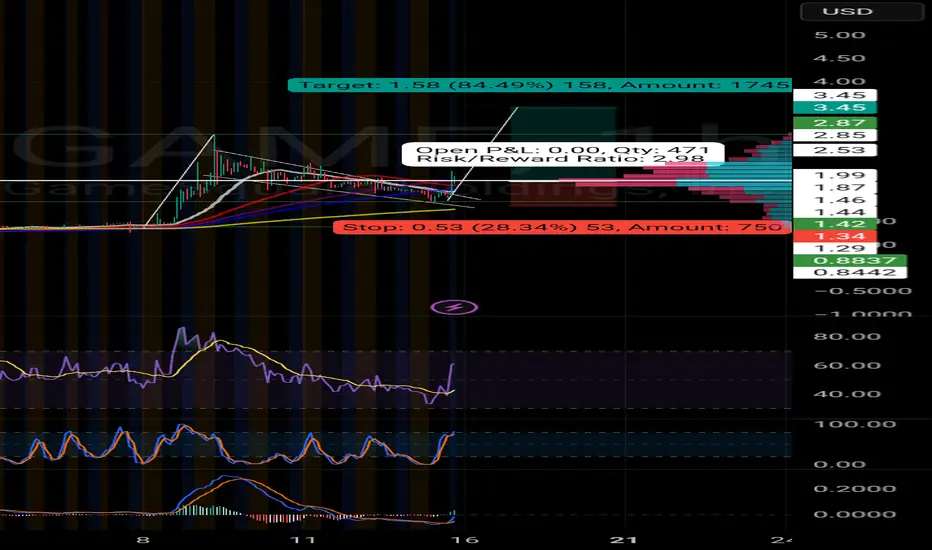
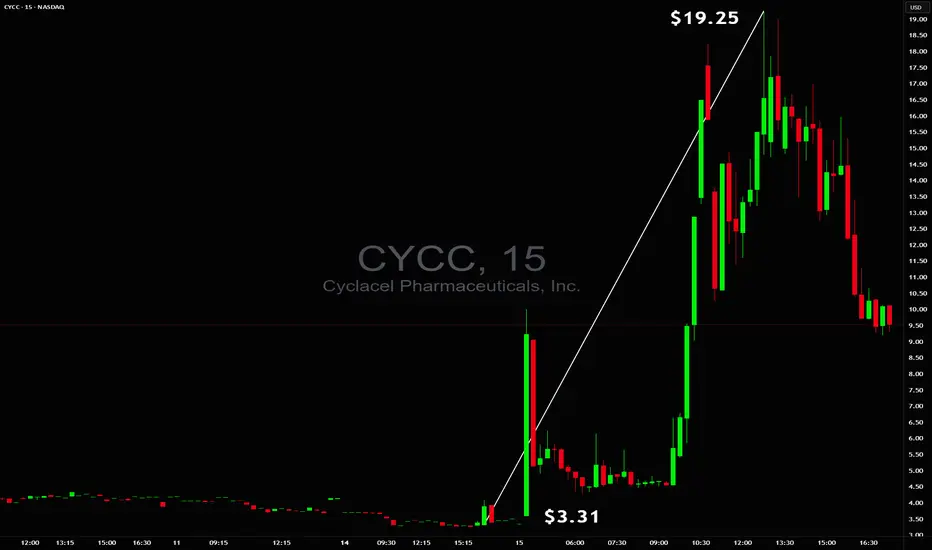
$3.31 to $19.25 in minutes$3.31 to $19.25 in minutes 🚀 but without a safe trade setup ❌ NASDAQ:CYCC
Too unstable to trade early while end of day there was a chance for power squeeze but even on 60M+ volume, tiny float and huge borrow fee they were able to reverse it so safe stop had to be respected ✔️
Got filled at the bugattiMy hedge short is filled
continuation of my other chart
IF this is good the target it the!!....
key levels will be longed if data aligns.