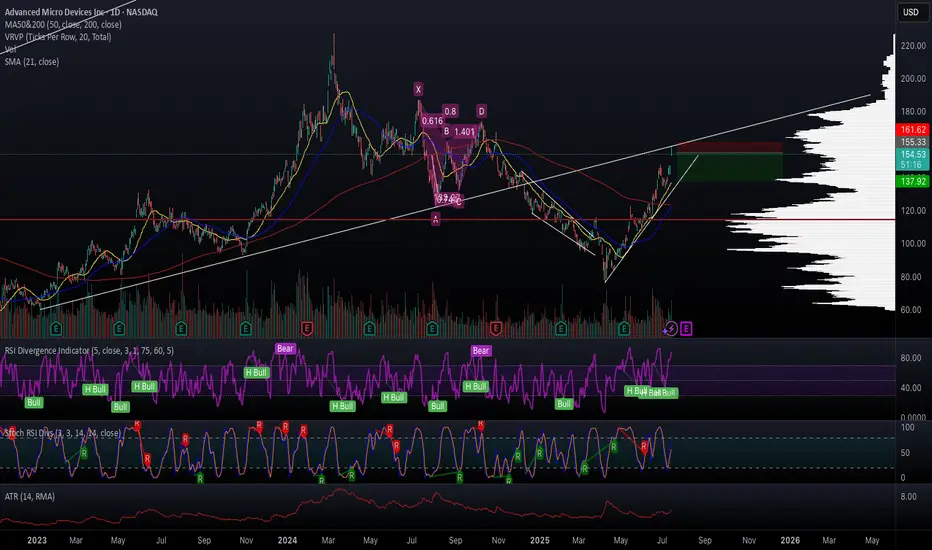
AMD is a strong buyAs mentioned, NVIDIA is overbought RSI over and other indicators. Put your bets on AMD.
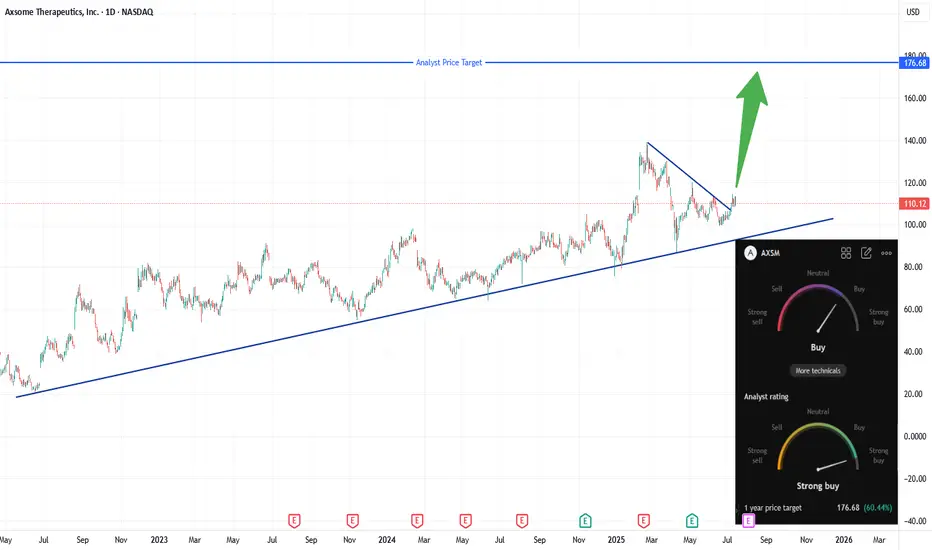
Axsome Therapeutics (AXSM) Breaks Out — Targeting Analyst Price Axsome Therapeutics (AXSM) has just broken out of a multi-month descending trendline, signaling renewed bullish momentum. I will buy at the open, targeting the analyst price target of $176.68 for a potential strong upside move. My stop will be set just below the prior resistance line (~$110), which should now act as support. This setup offers a favorable risk/reward, with the trendline breakout confirming renewed interest and upside potential.
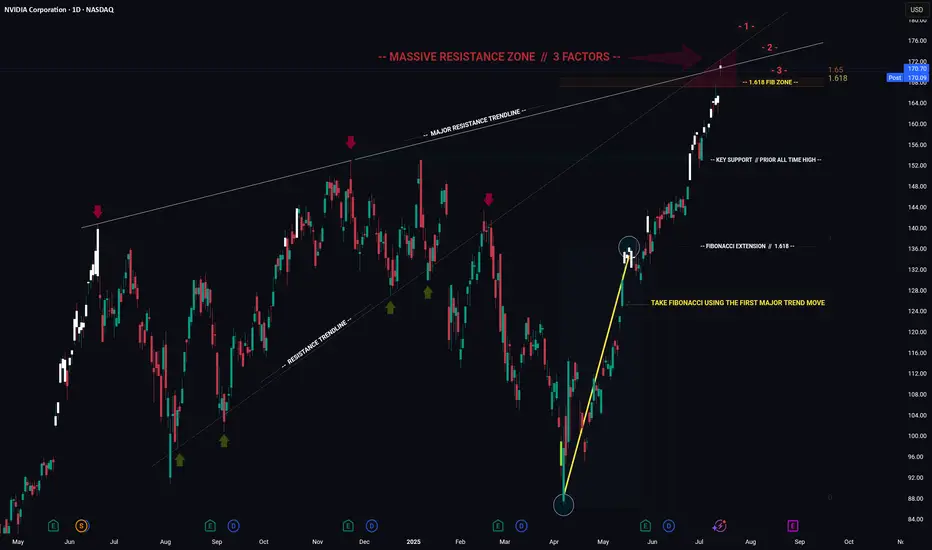
NVIDIA -- Major Resistance // Confluence of 3 FactorsHello Traders!
WOW... This chart is quite incredible I must say.
It's amazing how price is currently at an exact point where 2 major trendlines converge which also nearly coincides with the 1.618 Fibonacci extension. Price closed almost to the penny just above the major trendline connecting the prior highs. It will be very interesting to see what price does over the next few days.
What Does These Converging Trendlines Mean?: Think of a trendline like a wall... Depending on how "strong" the trendline is, this wall could be made from wood all the way through to vibranium straight from Captain Americas shield! These two trendlines converging would likely resemble a steel wall and would be extremely hard to penetrate. (Although there are no gurantees in trading)
What To Watch For: I will be watching to see if price can both break and confirm above both resistance trendlines. It will take MEGA buying pressure to accomplish this and would likely mean continuation to the upside. If price cannot break and confirm above then we will likely see a large retrace to support.
Thanks everyone and best of luck on your trading journeys!
Alibaba - A remarkable reversal!🛒Alibaba ( NYSE:BABA ) reversed exactly here:
🔎Analysis summary:
Recently Alibaba has perfectly been respecting market structure. With the current bullish break and retest playing out, there is a very high chance that Alibaba will rally at least another +20%. But all of this chart behaviour just looks like we will witness a major bottom formation soon.
📝Levels to watch:
$110, $135
🙏🏻#LONGTERMVISION
Philip - Swing Trader

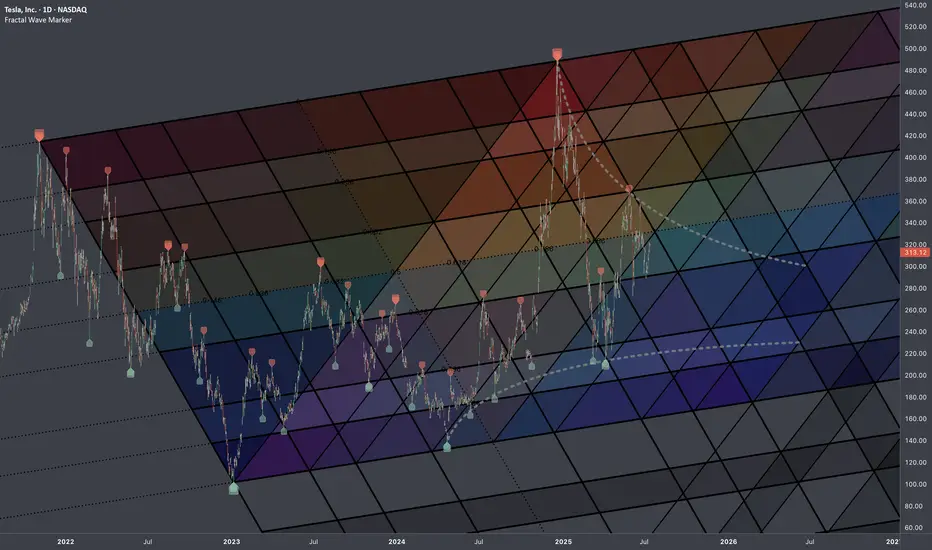
Tesla -> The all time high breakout!🚗Tesla ( NASDAQ:TSLA ) prepares a major breakout:
🔎Analysis summary:
Not long ago Tesla perfectly retested the major support trendline of the ascending triangle pattern. So far we witnessed a nice rejection of about +50%, following the overall uptrend. There is actually a quite high chance that Tesla will eventually create a new all time high breakout.
📝Levels to watch:
$400
🙏🏻#LONGTERMVISION
Philip - Swing Trader

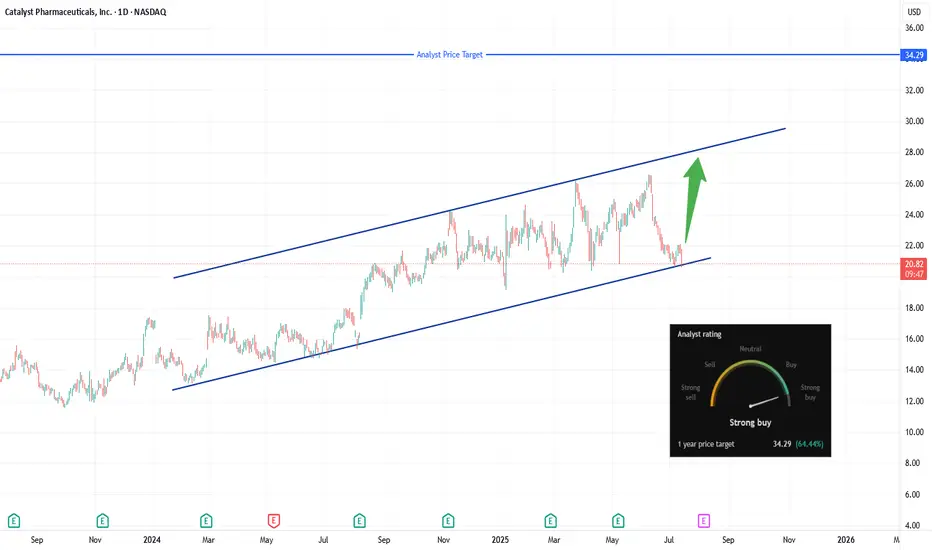
CPRX breakout watch: Eyes on $22.10, channel support intactCatalyst Pharmaceuticals (NASDAQ: CPRX) remains poised at the lower trendline of a well-defined ascending channel, trading in the $20.60–$21.00 area. The setup to monitor now is a daily close above $22.10, which would signal a real breakout through the $21.82–$22.11 resistance zone. A decisive push above that level opens the door for a test of the channel’s upper boundary near $27–$28.
💡 Trade Plan:
Trigger: Go long on a confirmed daily close above $22.10
Targets:
First: Mid-channel resistance around $24.50
Stretch: Upper-channel target of $27–$28
Stop‑Loss: Place below the channel base, ideally under $20.50 to manage risk
Why It Works:
Clear structure: Ascending channel with multiple supports provides clarity on entries and exits .
Momentum catalyst: Breaching the $21.8–$22.1 zone suggests fresh upside momentum.
Reward setup: A small stop near channel support offers a favorable risk/reward targeting channel top.
TL;DR:
Watching for a breakout above $22.10—that’s your entry trigger. Aim for $24.50, then $27–$28, with a stop under $20.50 if support fails.
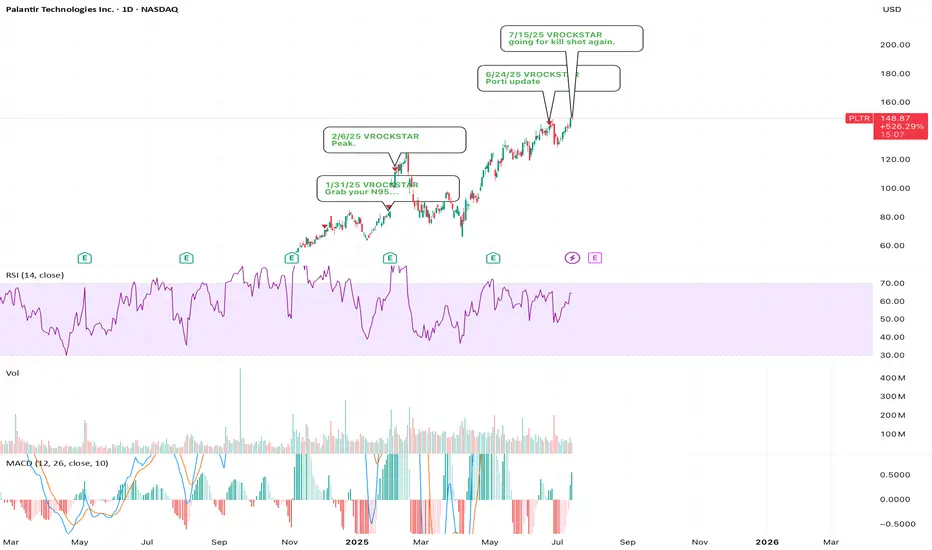
7/15/25 - $pltr - going for kill shot again.7/15/25 :: VROCKSTAR :: NASDAQ:PLTR
going for kill shot again.
- using the 2x levered meme etf PTIR to buy P's
- there are no logical explanations anymore for me to justify valuation "yeah V valuation doesn't matter"... you'll see what i mean, kid
- even 2x'ing FCF over the next 2 yrs and this thing with decelerating growth and the emergence of super intelligence means more competition, more vendors... again "you'll see kid"
- so does this go down tmr idk idc. this is a great hedge on my long book and it's done in a way where i'll roll it, pull it off, whatever.. it's not a core position in any capacity
- but it's already looking weak
- good luck holding this thing up. it wants to reset lower before it can make new highs is my armchair take (and tbh, this is secondary in my process anyway vs. the guys who just draw lines and "trust me bro" energy -- gl w that)
V
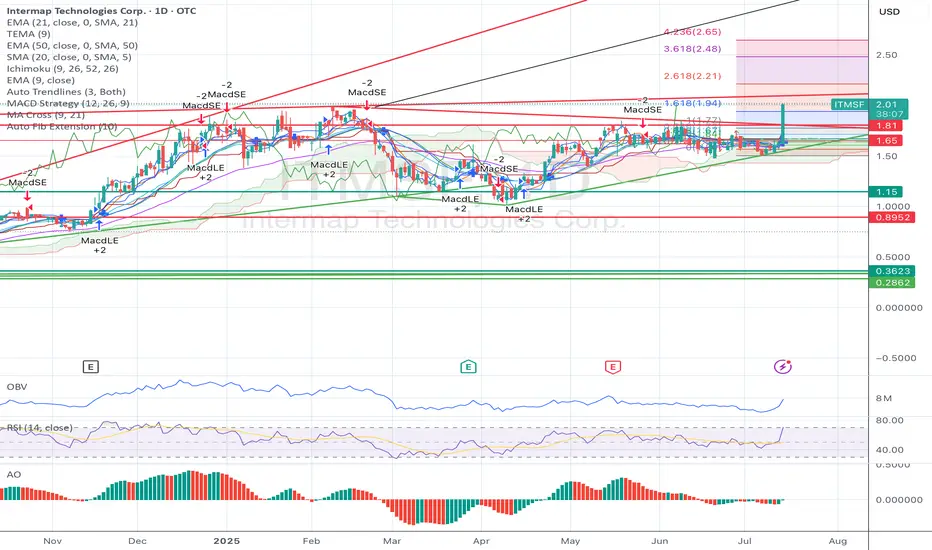
HUGE BULL FLAG BREAKOUT with Stifel Coverage initiation at $5.Been preaching this for a couple years, but just pour through this chart with amazing fundamentals, Govt contracts, and $200M Indonesian contract... just lovely...
Raising the bar for SpotifySpotify has been my favorite stock so far this year. Primarily because resilience in uncertain economies. Subscription-based services, especially freemium models, are seen as defensive. Spotify is the number one music streaming service in the world and unless that changes people will keep using it every single day in their lives.
They will generate revenues based on advertisements and subscriptions which are in my opinion reasonable and conducive of a strong business model. I am raising my price target to $985. This is not unreasonable considering the intrinsic value of the stock is between $400 and $2900. I am confident Spotify will find ways to stay ahead of its competitors and dominate the music streaming industry. While keeping its customers happy and loyal.

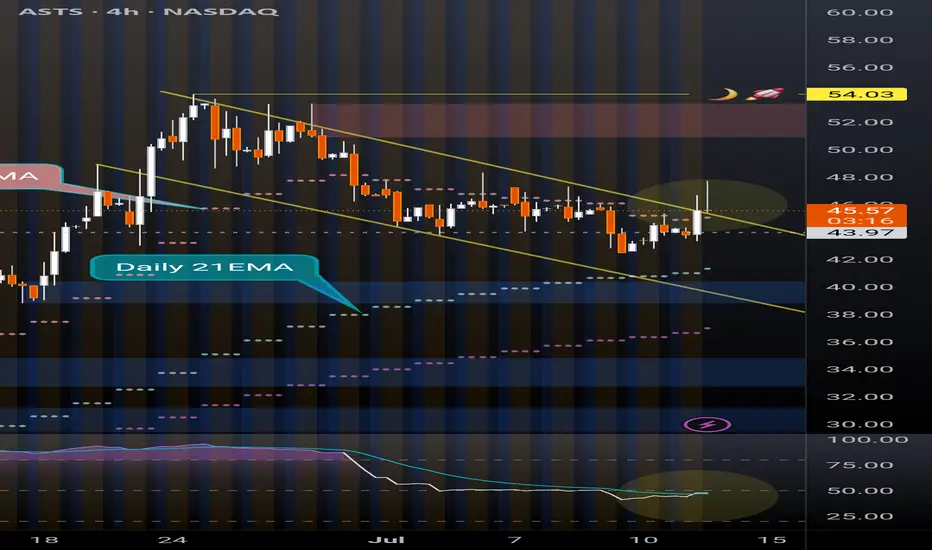
ASTS massive daily bull flagWith the cult like following on this ticker, a 4H break out and hold of this bull flag to the upside could see massive retail money piling in to send the price back to $54 ATH. RSI is also showing potential bullish confluence. The 4H chart has daily EMAs overlayed. The price is currently sitting above the daily 7EMA. Breakout above ATH and it's clear blue skies with no resistance. Huge potential.
7/15 AMD short AMD just reached a major resistance level and is expected to pull back toward the $135 area. While it may not signal a full trend reversal, a retracement from today’s high is likely.
If the 7/15 candle forms a red shooting star, it would provide further confirmation.
May the trend be with you.
Review and pln for 16th July 2025Nifty future and banknifty future analysis and intraday plan.
This video is for information/education purpose only. you are 100% responsible for any actions you take by reading/viewing this post.
please consult your financial advisor before taking any action.
----Vinaykumar hiremath, CMT

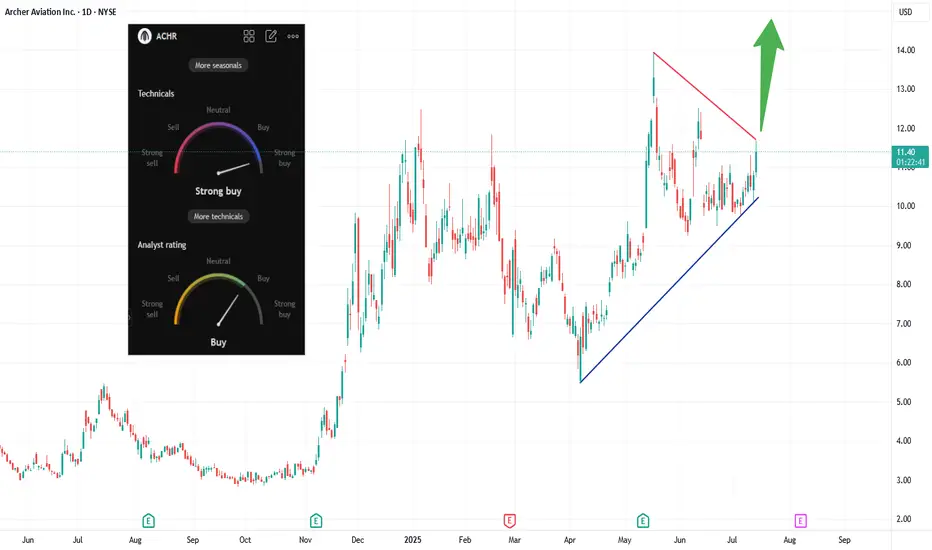
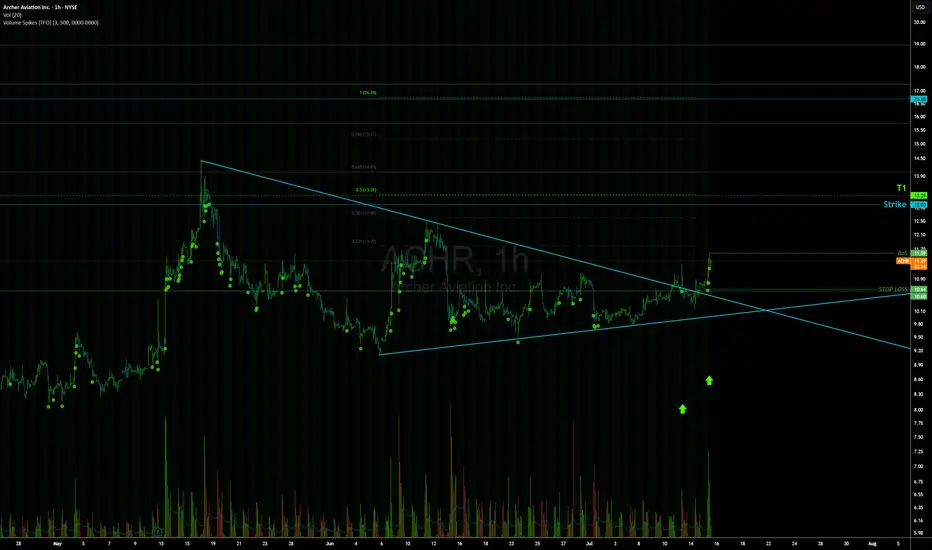
ACHR Eyes Breakout: eVTOL Sector Surges on Regulatory Tailwinds The eVTOL space is lighting up today, ACHR included. Shares have rallied ~7%, tapping into a bullish breakout off its ascending triangle and challenging its descending resistance (see chart). Analyst ratings lean strong‑buy, and technicals support further gains.
📈 Why the excitement?
A Trump executive order is fast‑tracking drone and air taxi regulations, boosting investor confidence across the sector.
Archer recently secured ~$850M in funding to accelerate U.S. rollout — fortifying its balance sheet and manufacturing plans.
The company is part of a new global alliance aiming to streamline eVTOL certification, joining forces with the FAA and five countries.
🚁 What’s next?
If ACHR breaks the red trendline resistance near ~$12, we could see a sharp move toward $14+ (green arrow on chart) as momentum builds. Watch closely for strong volume on the breakout — it could offer a clean entry.
Bottom line:
eVTOL is flying high today, and Archer stands poised to lead the charge. A breakout here could spark a fast move — keep it on your watchlist.
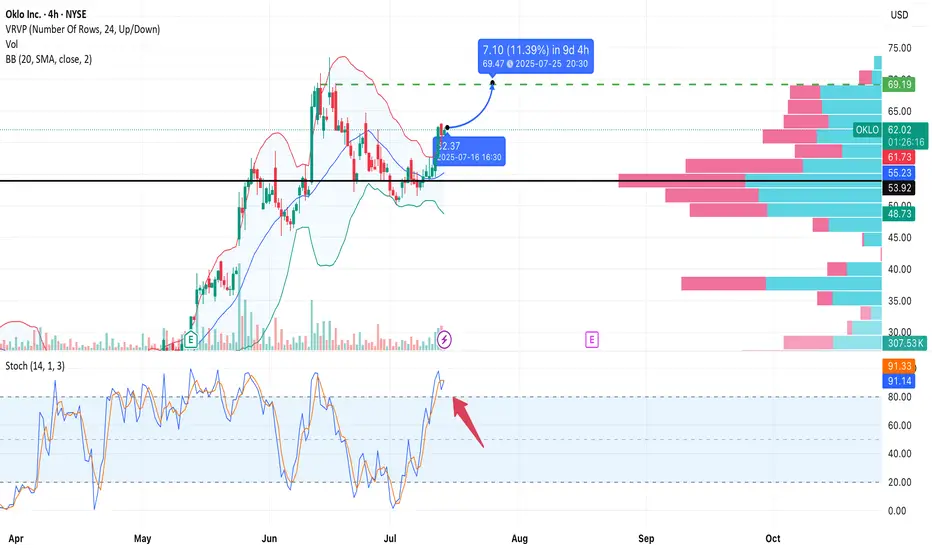
OKLO – Upside Potential Ahead of EarningsNYSE:OKLO
Type: Swing/positional
Timeframe: 4H
Style: No stop-loss, technically driven
Target: 69.50
Risk: Moderate (earnings volatility risk)
Overview:
Oklo is forming a bullish continuation pattern after consolidating above the 55.00 support area.
The price has broken above the Bollinger Band basis and reclaimed the 61.78 resistance zone.
Stochastic shows overbought conditions, but the trend remains strong.
The volume profile reveals a low-resistance zone up to ~69.50, offering clean air for upward momentum.
Entry Zone:
• Entry near 62.2 (market price)
• The setup remains valid while price stays above ~61.5
• Upcoming earnings (July 19) may act as a catalyst
Target:
• Take Profit: 69.50
Expected move: +11%
No Stop? Then Watch Closely:
Soft invalidation if price breaks below 59.50 (4H close)
Analyzing GOOGL's Path: Breakouts and Critical Support• Strong Upward Trendline : The chart clearly displays an ascending trendline (light blue) from early April, indicating a robust bullish trend. The price has consistently found support at or near this line, reinforcing its significance as a key technical level.
• Recent Breakout and Potential Retest : The price has recently broken above a notable resistance zone around the $181-$183 mark (highlighted in green). The dotted white lines suggest a potential retest of this newly formed support level before a continuation of the upward movement, a common pattern following a breakout.
• Identified Price Targets Ahead : Two distinct target zones are identified above the current price: the $181 to $183 range as the "1st Target" (already reached/broken out of), and a higher "2nd Target" between $191 to $193. These represent areas where upward momentum might face resistance or profit-taking.
• Critical Support Zone for Drop Scenarios : In the event of a price drop, the chart indicates a critical support zone from $171 to $173. This area aligns with the ascending trendline, making it a crucial level to watch for potential bounces if the price pulls back.
• Confirmed Retested Support Below : Further down, the chart highlights a retested support zone between $161 and $163. The repeated testing and holding of this level affirm its strength as a reliable base for the price in the longer term.
Disclaimer:
The information provided in this chart is for educational and informational purposes only and should not be considered as investment advice. Trading and investing involve substantial risk and are not suitable for every investor. You should carefully consider your financial situation and consult with a financial advisor before making any investment decisions. The creator of this chart does not guarantee any specific outcome or profit and is not responsible for any losses incurred as a result of using this information. Past performance is not indicative of future results. Use this information at your own risk. This chart has been created for my own improvement in Trading and Investment Analysis. Please do your own analysis before any investments.

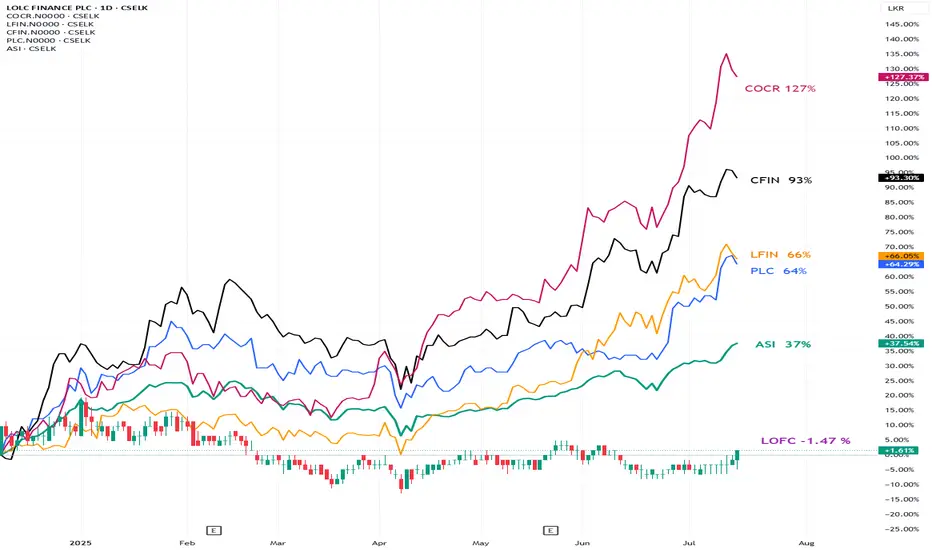
YTD Performance: Large NBFIs of CSE vs. ASI & LOFCOverview
All major Non-Bank Financial Institutions (NBFIs) listed on the Colombo Stock Exchange (CSE) have significantly outperformed the All Share Index (ASI) in Year-to-Date (YTD) terms—with one exception.
YTD Returns (2025)
Institution / Index | YTD Performance
----------------------------------------------
ASI 37%
COCR 127%
CFIN 93%
LFIN 66%
PLC 64%
LOFC -1.47%
Underperformance of LOFC
LOLC Finance (LOFC), the largest NBFI on the CSE, not only underperformed its sector peers but also delivered a negative return of -1.47%, diverging sharply from the broader market trend.
While the divergence was visible since Feb. 2025, underperformance during recent months probably due to share buyback executed at LKR 6.
Sector Tailwinds
The NBFI sector's strong performance is largely attributed to the anticipated revival of the vehicle leasing segment, following the government’s decision to permit vehicle imports. This policy shift has fueled investor optimism across the financial leasing landscape.
Strategic Implication
Given its scale and market position, LOFC should theoretically be the primary beneficiary of this resurgence.
Will there be a catch-up trade?
As buy back is now closed, we should pay close attention for a Catchup trade opportunity together with other shares of the group.
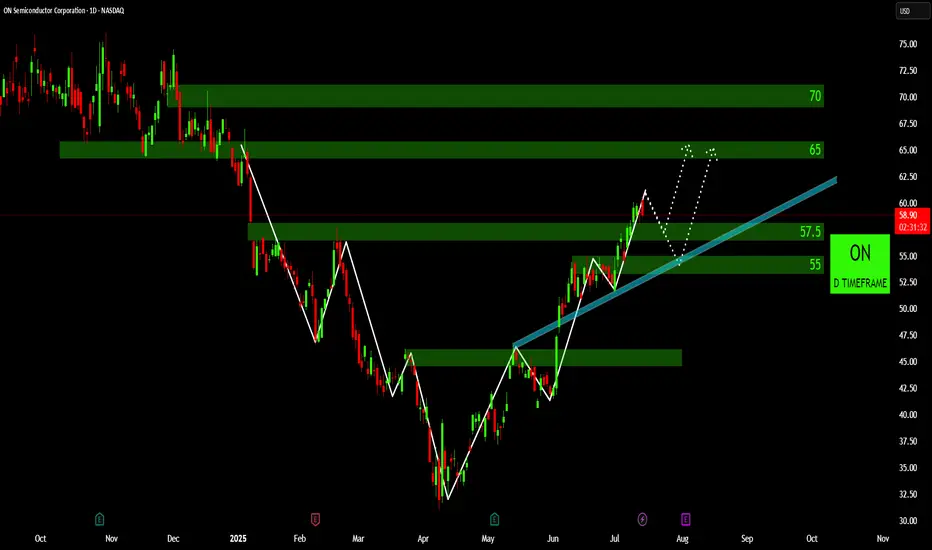
A Technical Review of ON: Trendlines and Potential TargetsBullish Trendline in Play : The price action since late April/early May clearly demonstrates an upward-sloping trendline (highlighted in light blue), indicating a sustained bullish momentum. The price has respected this trendline on multiple occasions, suggesting its significance as dynamic support.
Recent Breakout and Retest of Resistance : The chart shows a recent decisive breakout above the 57.50 level, which previously acted as resistance. Following the breakout, the price has seen a retest of this level, successfully holding above it, which is often a bullish confirmation.
Identified Supply Zones Ahead : There are two distinct green-highlighted zones above the current price, marked at 65 and 70. These represent potential supply zones or resistance levels where profit-taking or increased selling pressure could occur.
Potential for ABCD Harmonic Pattern : The dotted white lines indicate a potential ABCD harmonic pattern formation. Should this pattern play out, it suggests a possible corrective move towards the 55-57.50 zone before a further upward trajectory towards the 65 and then potentially 70 levels.
Key Support Zone Established : The green-highlighted area around the 55 level, coinciding with the bullish trendline, appears to be a significant support zone. A sustained breakdown below this level would invalidate the current bullish structure and warrant a re-evaluation of the trend.
Disclaimer:
The information provided in this chart is for educational and informational purposes only and should not be considered as investment advice. Trading and investing involve substantial risk and are not suitable for every investor. You should carefully consider your financial situation and consult with a financial advisor before making any investment decisions. The creator of this chart does not guarantee any specific outcome or profit and is not responsible for any losses incurred as a result of using this information. Past performance is not indicative of future results. Use this information at your own risk. This chart has been created for my own improvement in Trading and Investment Analysis. Please do your own analysis before any investments.
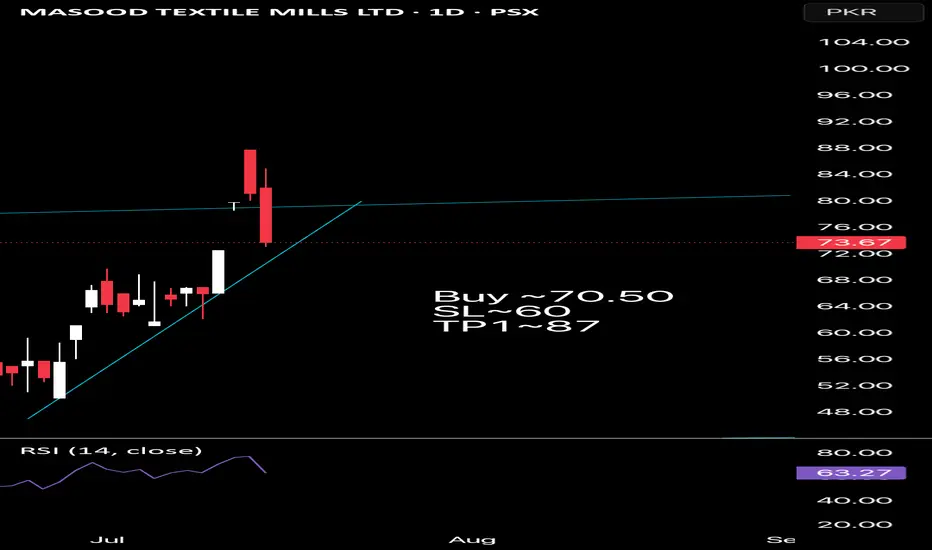
MSOT-Buy at current discounted priceSo seems it has broken the trendline and retraced...Filled the gap..So Buy~70.5, SL~60.50 TP1~87...And from thereon it can easily cross recent high
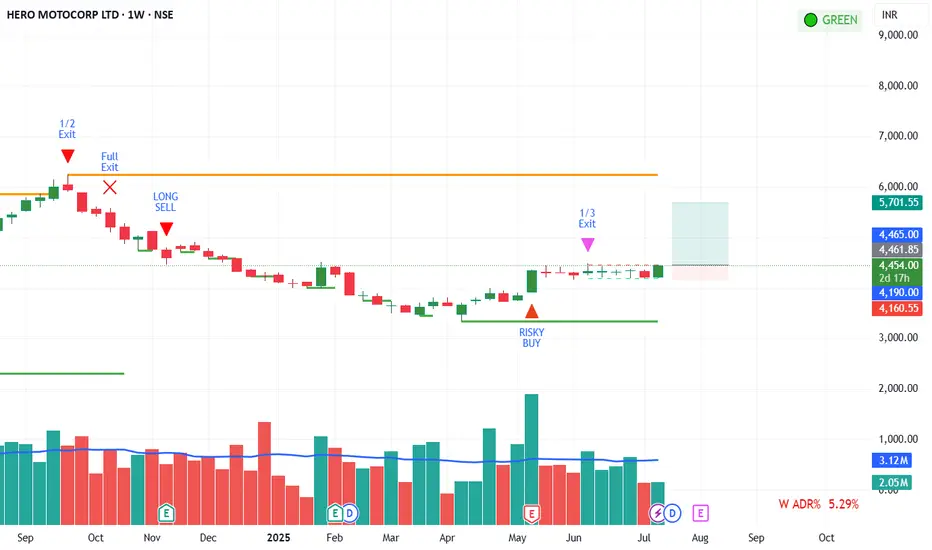
HERO MOTOCORP LTD looks Good HERO MOTOCORP LTD our Private indicator give signal earlier few weeks ago. Now it seems looks more constractive, and can be Take position stoploss according to chart.
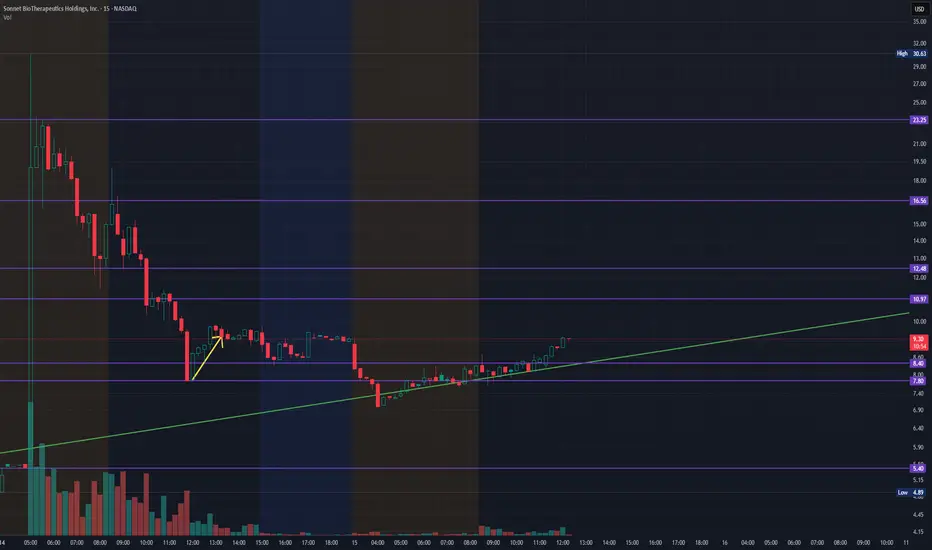
SONN - Sonnet BioTehrapeutics - Continuation to $16 50% FibAfter SONN broke out to $30.63 from $4.20 in yesterday's pre-market, after announcing entering an agreement to become a Public Cryptocurrency Treasury Company. We entered NASDAQ:SONN at $8.28 this morning in's pre-market during the completion of consolidation and convergence on the EMAs from the Consolidation Downtrend. Looking for a $16 PT / 50% Fib Retrace Retest on the 15-Min.
FINANCIAL NEWS:
Sonnet BioTherapeutics shares climbed after the oncology-focused biotechnology company said it entered into an agreement to become a public cryptocurrency treasury company.
Shares more than doubled to $13.50 on Monday. Shares were up 78.5% over the past year.
Sonnet BioTherapeutics , which entered the business combination agreement with Rorschach and other sponsors, said it plans to build a reserve of HYPE, the token of the Hyperliquid Layer-1 blockchain.
Sonnet BioTherapeutics will transform into a new entity called HyperLiquid Strategies at the agreement's close. The new company is expected to hold 12.6 million HYPE tokens and gross cash invested of at least $305 million , for a total assumed closing value of $888 million .
The company will name David Schamis , chief investment officer and co-founder of Atlas Merchant Capital , as chief executive of HyperLiquid Strategies.
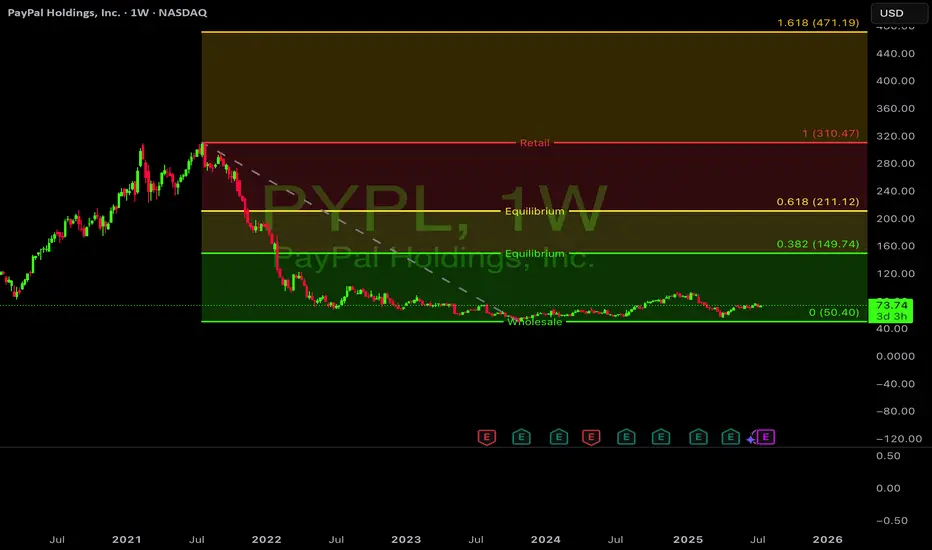
$PYPL should be in your kids kids accountNASDAQ:PYPL breaking out! PayPal forming solid base above $70 after 3-month consolidation. Recent upgrade from Seaport Global signals shifting sentiment. Chart shows golden cross with volume confirmation.
Key resistance at $75 once broken, path to $85+ looks clear.
Long-term target: $141 .
Ultimate goal: reclaim ATH of $275.51! Digital payments growth story intact! #PayPal #Fintech #BullishBreakout
$TSLA: Fib InterconnectionsResearch Notes
Examining interconnection type with regressive angle:
Critical points:
Mapping with 3 fibonacci channels: