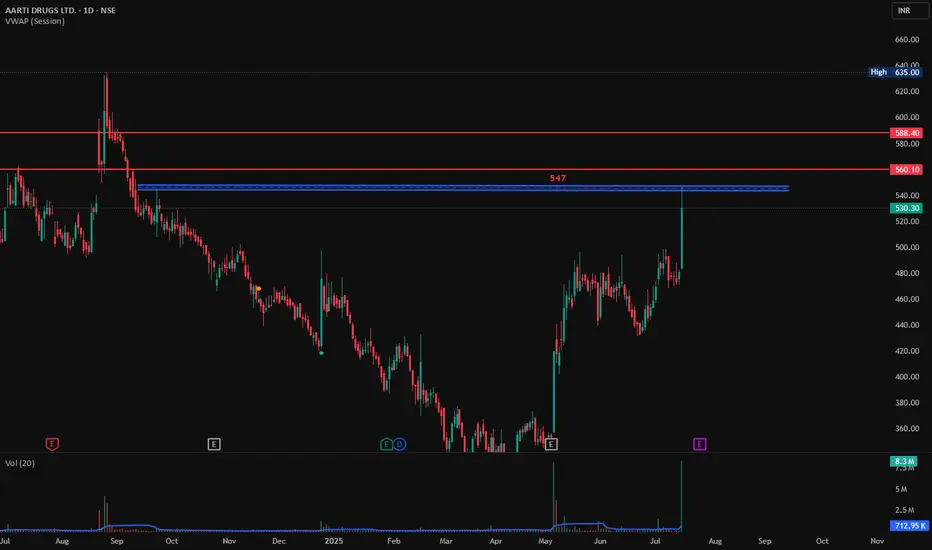
Aarti Drug Good Volume, breakout in 1D Time Frame, Long PositionAarti Drugs has shown a good upward move of 10% today with good volumes on 1 Day time frame. If its breaks the resistance at 547 with Bullish candlestick patterns like Bullish Engulfing, Hammer & Inverted Hammer, Piercing Line, Morning Star, Three White Soldiers, Tweezer Bottoms or Bullish Harami, then chances of going higher from here will increase.
Entry at 547 on Bullish Candlestick Pattern.
Target1: 560
Target2: 588
Stop Loss: 540
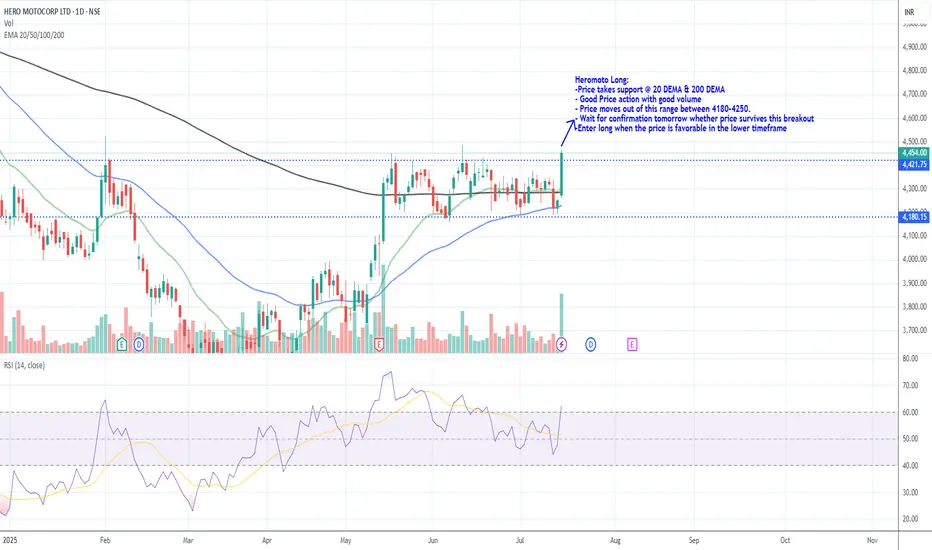
Heromoto Long_Support @ 20 DEMAHeromoto Long:
-Price takes support @ 20 DEMA & 200 DEMA
- Good Price action with good volume
- Price moves out of this range between 4180-4250.
- Wait for confirmation tomorrow whether price survives this breakout
-Enter long when the price is favorable in the lower timeframe
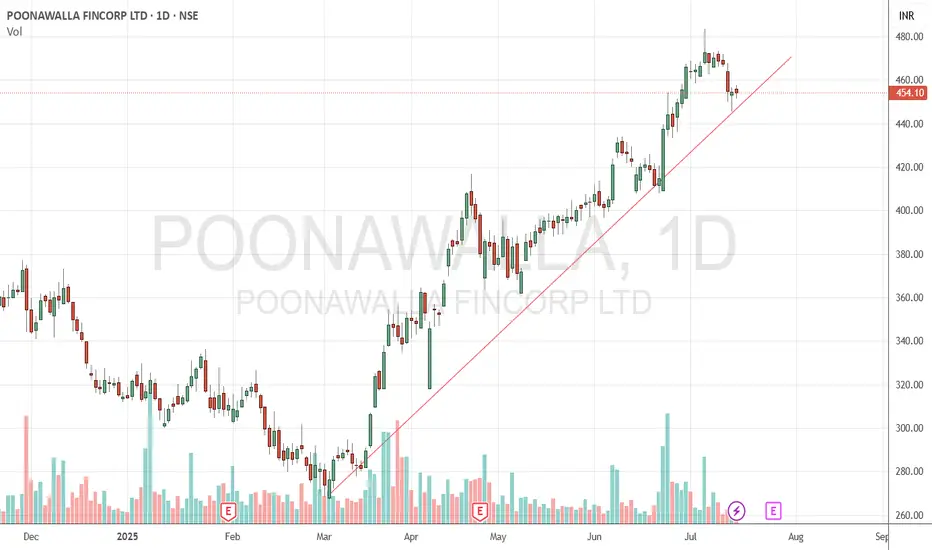
Poonawalla Fincorp BuyPoonawalla Fincorp seems to take support at trend line. Buy @CMP (455) with SL of 445 and Target of 475 & 500.
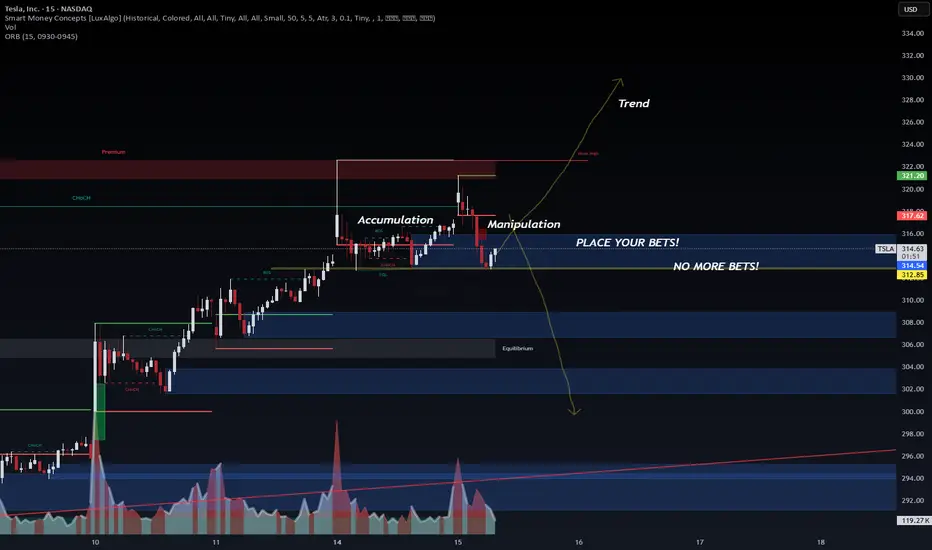
Classic accumulation, manipulation and trend @ TSLA.Looks like someone knows something, or is it just me hallucinating. Can't be both :D
Please see the chart for pattern analysis of what it seems to be a accumulation followed by manipulation, and now the stock is looking for its trend. Whatever happens, I think we are going to see a big move either direction. I am betting on the bullish side with 335 C contracts. Light position, starter.
Front-test, not fin advice.
Is it right time and choice to buy UNH Stock - {15/07/2025}Educational Analysis says that UNH Stock (USA) may give trend Trading opportunities from this range, according to my technical analysis.
Broker - NA
So, my analysis is based on a top-down approach from weekly to trend range to internal trend range.
So my analysis comprises of two structures: 1) Break of structure on weekly range and 2) Trading Range to fill the remaining fair value gap
Let's see what this Stock brings to the table for us in the future.
Please check the comment section to see how this turned out.
DISCLAIMER:-
This is not an entry signal. THIS IS FOR EDUCATIONAL PURPOSES ONLY.
I HAVE NO CONCERNS WITH YOUR PROFIT OR LOSS,
Happy Trading.

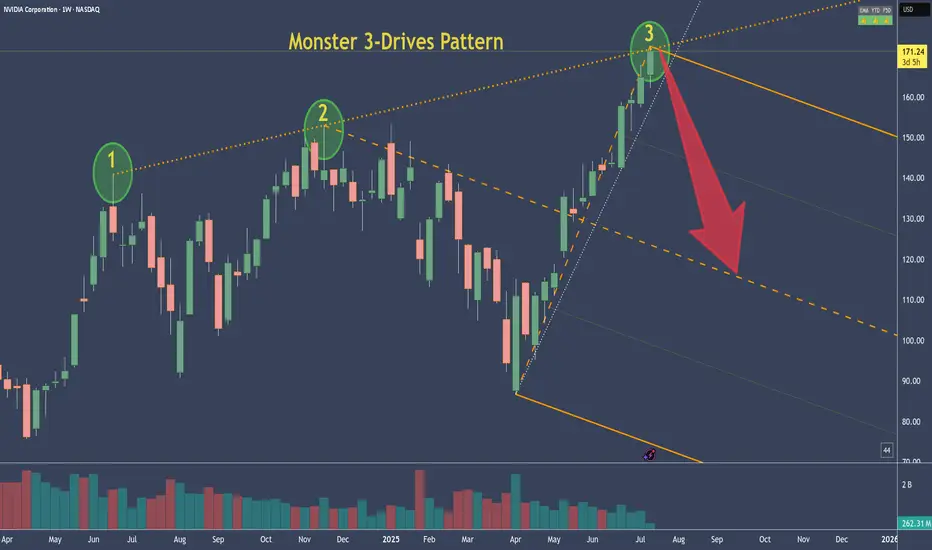
NVDA - NVIDIA's 3-Drive Pattern target if it plays outThis is the weekly chart of NVDA.
We can clearly see a 3-Drives pattern forming.
If this pattern plays out, the centerline would be my target. Of course, it's still too early to short.
But I’ve got my hunting hat on and I'm watching for signals on the daily chart.
One would be a break of the slanted trendline—but there are a couple of other conditions that need to align as well.
Always ask yourself: What if?
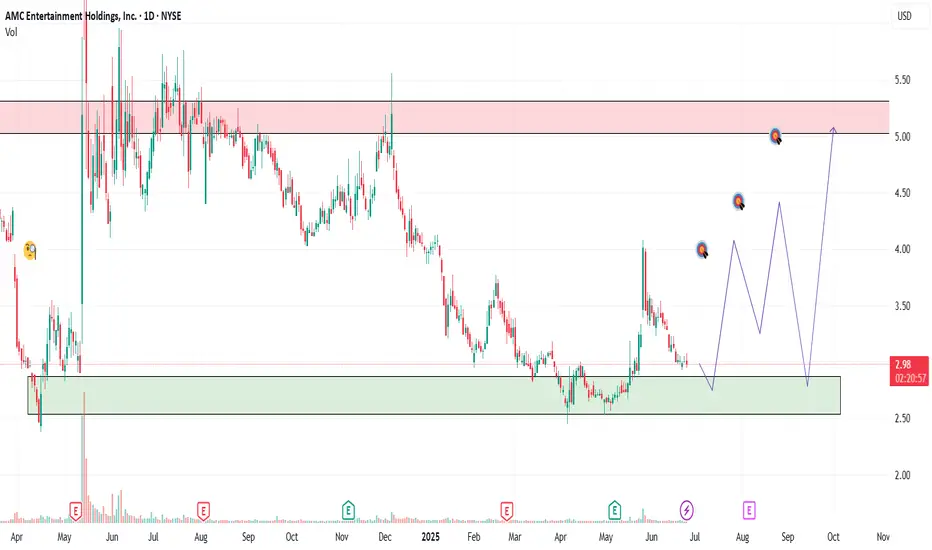
AMC | Long-Term Setup BrewingAMC has been a battlefield stock for retail traders, and while the meme frenzy has calmed, the chart shows signs of a long-term consolidation that may lead to a breakout.
We’re not chasing hype we’re playing levels. The current zone offers asymmetric risk/reward for patient swing or position traders looking for a reversion move back toward key psychological and technical levels.
🔍 Entry Zones:
✅ Market Price: ~$2.99 (initial momentum position)
🧲 Pullback #1: $2.75 (former pivot + fib level)
🧨 Pullback #2: $2.50 (key support floor and high-risk/reward entry)
🎯 Profit Targets (Swing/Position):
🎯 TP1: $3.30 – reclaim of early resistance
🎯 TP2: $4.00 – volume spike zone
🎯 TP3: $5.00+ – potential sentiment surge / short squeeze zone
📢 Disclaimer: This is not financial advice. Always manage your own risk and do your own due diligence.
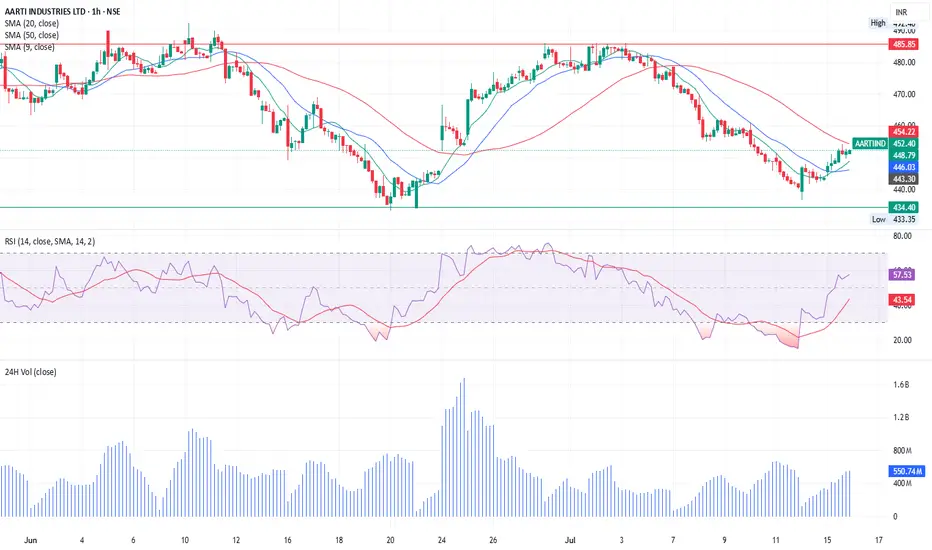
What a beautiful Wave!AARTIIND is showing a potential short-term bullish reversal after a prolonged decline, supported by RSI momentum, moving average crossover, and rising volume. A breakout above ₹486 could give a further rally toward ₹490+ Bullish Bias (If price sustains above ₹454):
Target: ₹486 → ₹492
The push will take place once the price moves above the 50 SMA - ₹474. Two cross overs have been executed. The third should bring smiles. Unless external forces act otherwise this should be an interesting trade. The rising volume speaks volumes.
Cup and handle formation. The handle is currently being completeCup and handle formation. The handle is currently being completed.
The support level is at 1.60

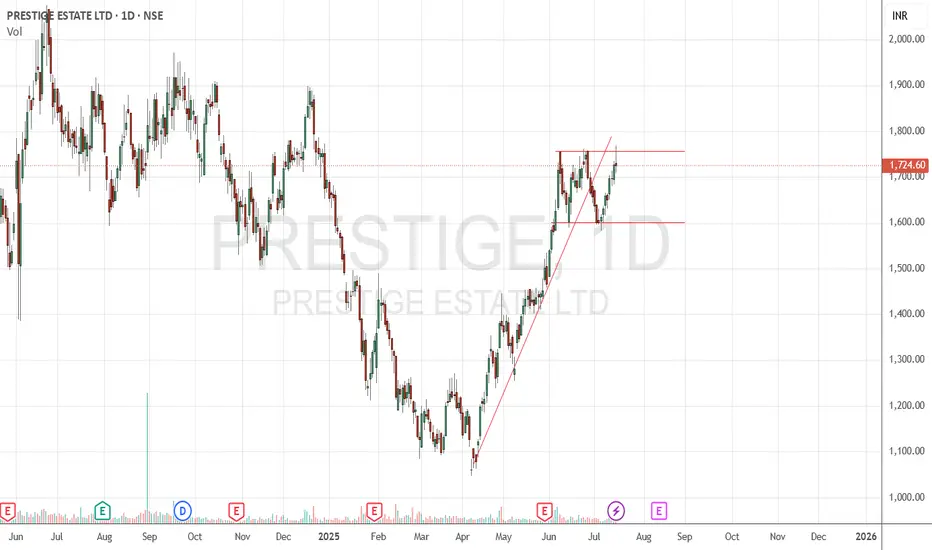
Prestige Estate SellPrestige Estate breaks below trend line and trading in a range. Sell @CMP (1725) with SL of 1770 and Target of 1600.
Sunpharma I'm not a SEBI REGISTERED ANYLISIS
just for learning purpose
above the blue line close in D chart candle i will buy and put strictly SL to below red line...once candle close below Red line in D chart...i will close the Trade...
Note: 1
Breakout candle should close time 6 or below 6 points I will buy same day or I will wait for the blue line price to re-trace)
Note:2
If previous volume is buyers(for ex- 10k) Breakout candle volume should be low in present day with buyers volume(below 10k for ex- 9k like this)
target check the chart
WAIT FOR ENTRY......then after
WAIT FOR TARGET...... or
WAIT FOR STOPLOSS
educational purpose only
oits simple ORB WITH VOLUME BREAKOUT STRATEGY...with small condition apply for selecting the stocks
owt not response for your profit and loss

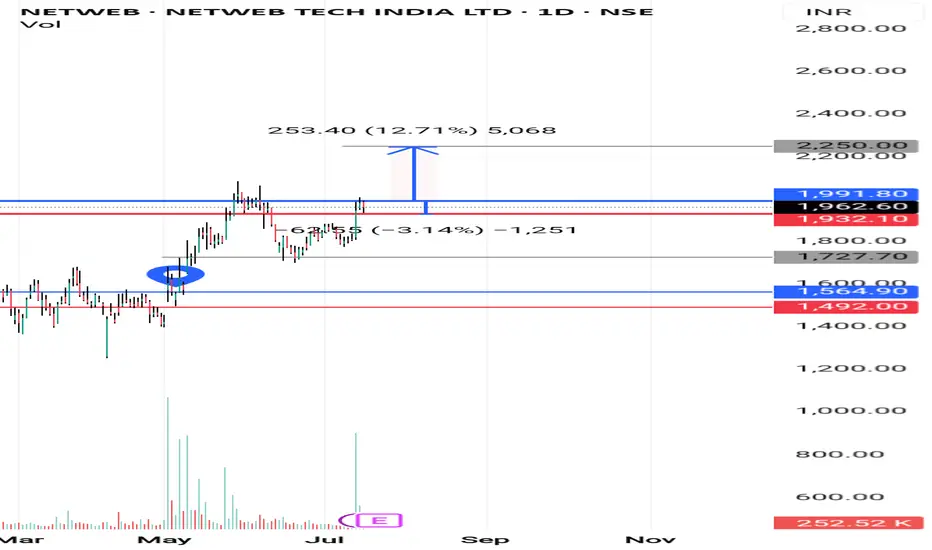
Netweb technology I'm not a SEBI REGISTERED ANYLISIS
just for learning purpose
above the blue line close in D chart candle i will buy and put strictly SL to below red line...once candle close below Red line in D chart...i will close the Trade...
Note: 1
Breakout candle should close time 6 or below 6 points I will buy same day or I will wait for the blue line price to re-trace)
Note:2
If previous volume is buyers(for ex- 10k) Breakout candle volume should be low in present day with buyers volume(below 10k for ex- 9k like this)
target check the chart
WAIT FOR ENTRY......then after
WAIT FOR TARGET...... or
WAIT FOR STOPLOSS
educational purpose only
oits simple ORB WITH VOLUME BREAKOUT STRATEGY...with small condition apply for selecting the stocks
owt not response for your profit and loss
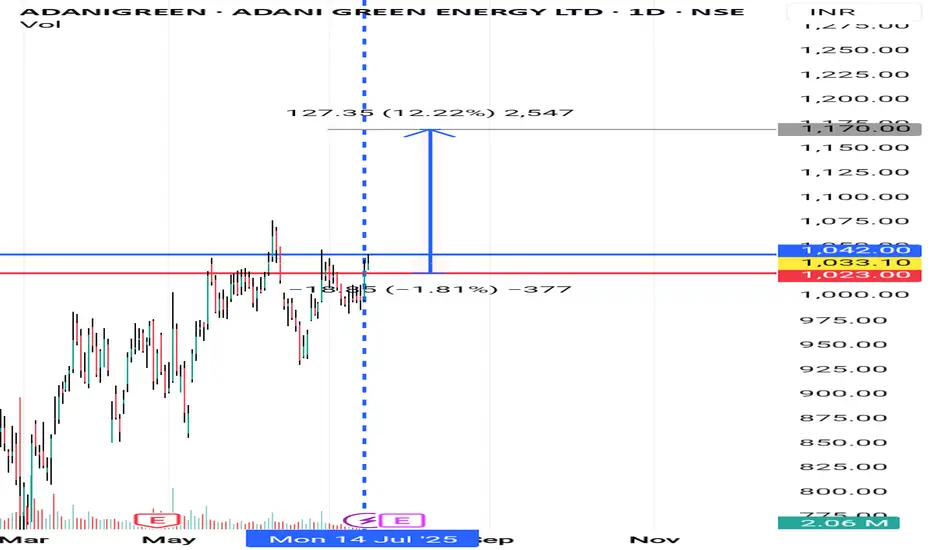
Adanigreen I'm not a SEBI REGISTERED ANYLISIS
just for learning purpose
above the blue line close in D chart candle i will buy and put strictly SL to below red line...once candle close below Red line in D chart...i will close the Trade...
Note: 1
Breakout candle should close time 6 or below 6 points I will buy same day or I will wait for the blue line price to re-trace)
Note:2
If previous volume is buyers(for ex- 10k) Breakout candle volume should be low in present day with buyers volume(below 10k for ex- 9k like this)
target check the chart
WAIT FOR ENTRY......then after
WAIT FOR TARGET...... or
WAIT FOR STOPLOSS
educational purpose only
oits simple ORB WITH VOLUME BREAKOUT STRATEGY...with small condition apply for selecting the stocks
owt not response for your profit and loss
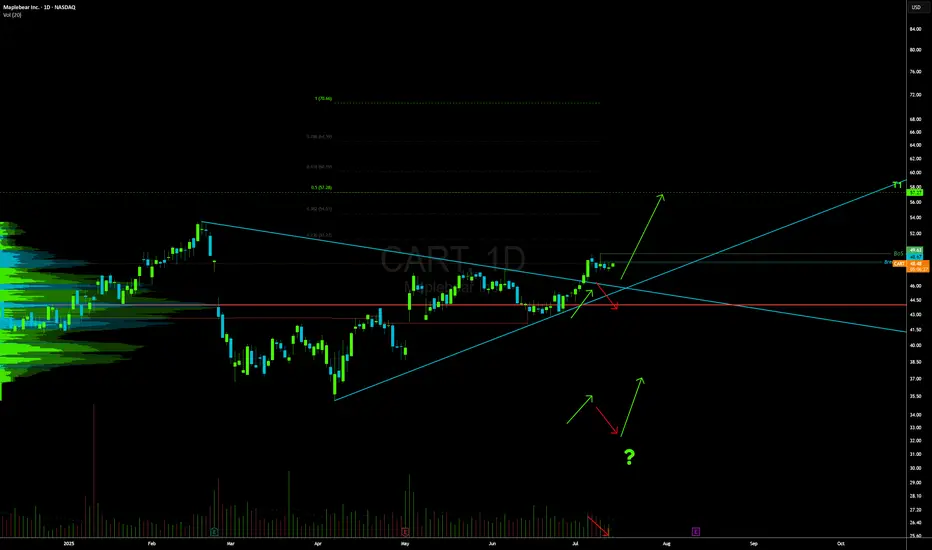
CART LONG
Strong Profits
The company makes solid money on what it sells. It keeps a high percentage of revenue as profit, with strong margins all around. It also generates good returns from the money it invests.
No Debt, Plenty of Cash
The company has almost no debt and a strong cash position. It has more than enough to cover short-term needs and stay financially stable.
Earnings Are Growing
Earnings more than doubled over the last year and are expected to grow again next year. Big investors like mutual funds and institutions are buying more of the stock, which is a good sign.
Business Has an Edge
The company has very high profit margins, which suggests it has pricing power or a business model that’s hard to compete with.
HIGH INSTITUTIONAL OWNERSHIP 66.15%
-Broke Out of a Wedge
The stock recently broke out of a wedge pattern, which often means it's ready to move higher.
-Pulling Back Gently
After the breakout, the stock is easing back on light trading volume INTO THE 8ema. That usually means sellers aren't too aggressive and a move higher could be coming.
Looking Toward the Mid-Fifties
Based on the current setup, the stock looks like it could climb to around 57 if momentum holds up.
-Momentum is Positive
The stock is trending above its key moving averages and has gained a lot over the past year. The trend is still strong.
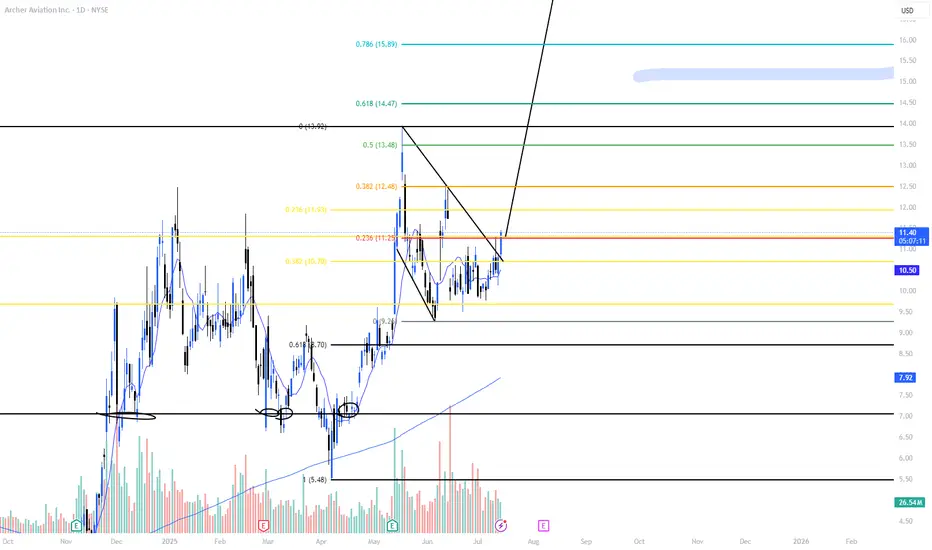
15 near term?NYSE:ACHR has been consolidating very well in this range, and today we saw a very strong candle with a lot of volume. This can be used as confirmation that it's breaking out of this channel to move higher. My first target is 12.48, then the ATH. After that, we should quickly reach the 14.5-15.8 range.
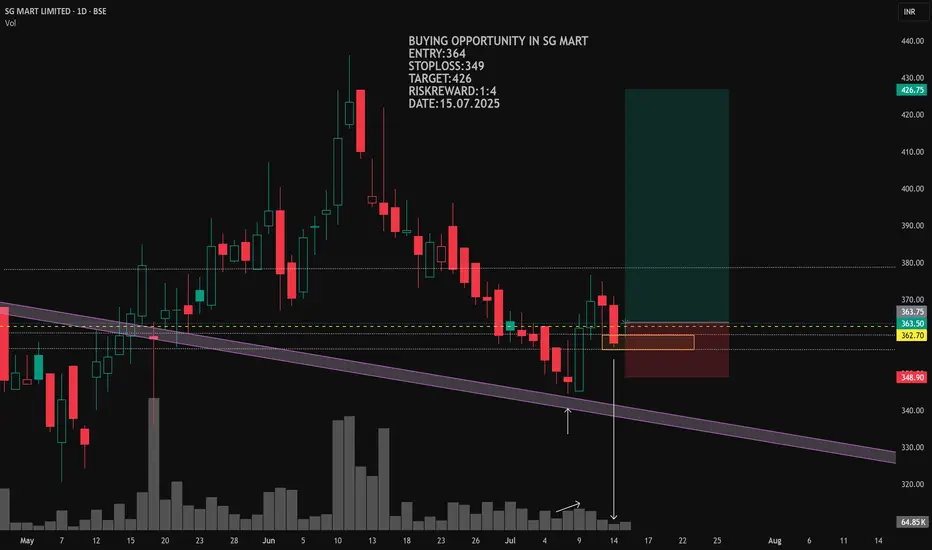
buying opportunity at sg mart stockbuying opportunity at sg mart stock
ENTRY:364
STOPLOSS:349
TARGET:426
RISKREWARD:1:4
DATE:15.07.2025
KALV FDA approval rallyKALV received FDA approval this week for a new drug, has $220mln in cash, and just bounced off the daily 21EMA (overlayed on this 4H chart).
Recently rejected off the monthly 100ema two times (overlayed on this 4H chart). Breakout beyond the monthly 100ema and first target is $20. Numerous price target increases, most notably, one at $27 and another increased from $32 to $40.


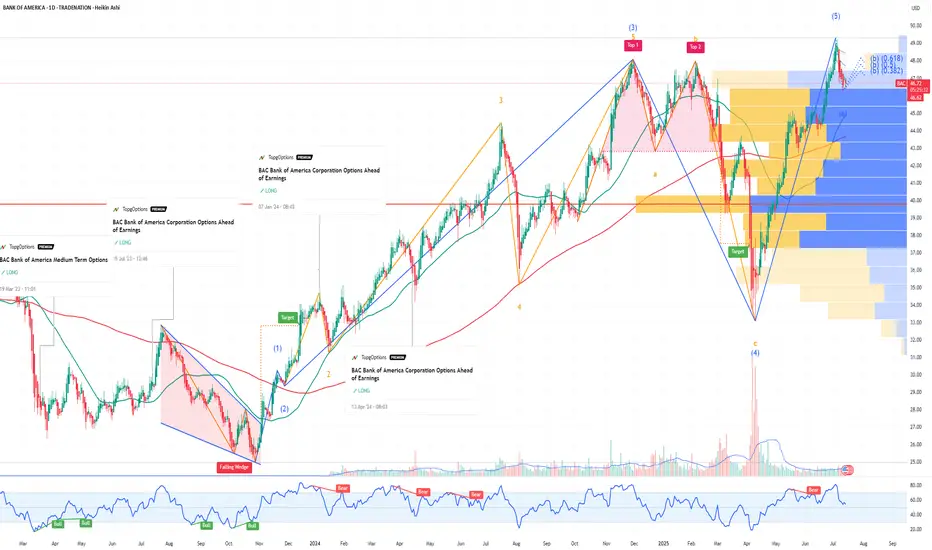
BAC Bank of America Corporation Options Ahead of EarningsIf you haven`t bought BAC before the rally:
Now analyzing the options chain and the chart patterns of BAC Bank of America Corporation prior to the earnings report this week,
I would consider purchasing the 48usd strike price Calls with
an expiration date of 2025-7-18,
for a premium of approximately $0.34.
If these options prove to be profitable prior to the earnings release, I would sell at least half of them.