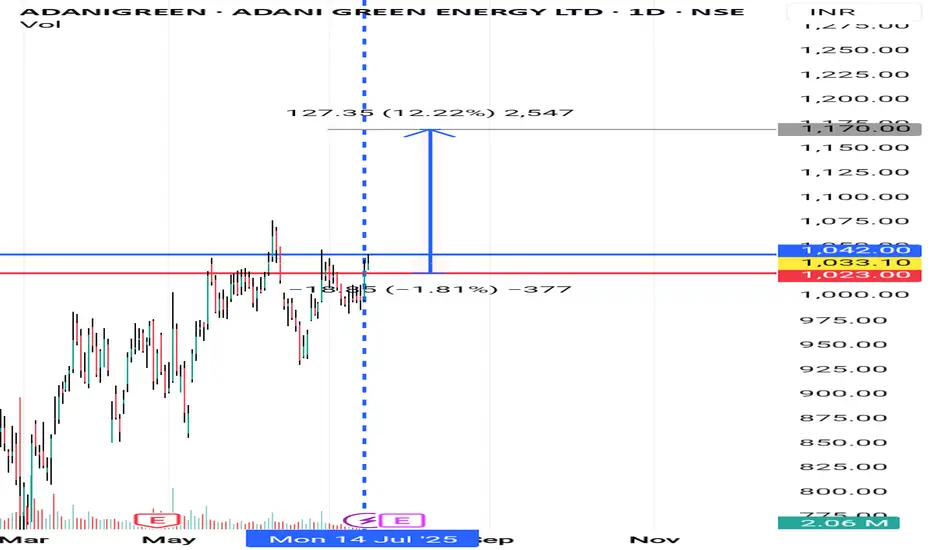
Adanigreen I'm not a SEBI REGISTERED ANYLISIS
just for learning purpose
above the blue line close in D chart candle i will buy and put strictly SL to below red line...once candle close below Red line in D chart...i will close the Trade...
Note: 1
Breakout candle should close time 6 or below 6 points I will buy same day or I will wait for the blue line price to re-trace)
Note:2
If previous volume is buyers(for ex- 10k) Breakout candle volume should be low in present day with buyers volume(below 10k for ex- 9k like this)
target check the chart
WAIT FOR ENTRY......then after
WAIT FOR TARGET...... or
WAIT FOR STOPLOSS
educational purpose only
oits simple ORB WITH VOLUME BREAKOUT STRATEGY...with small condition apply for selecting the stocks
owt not response for your profit and loss
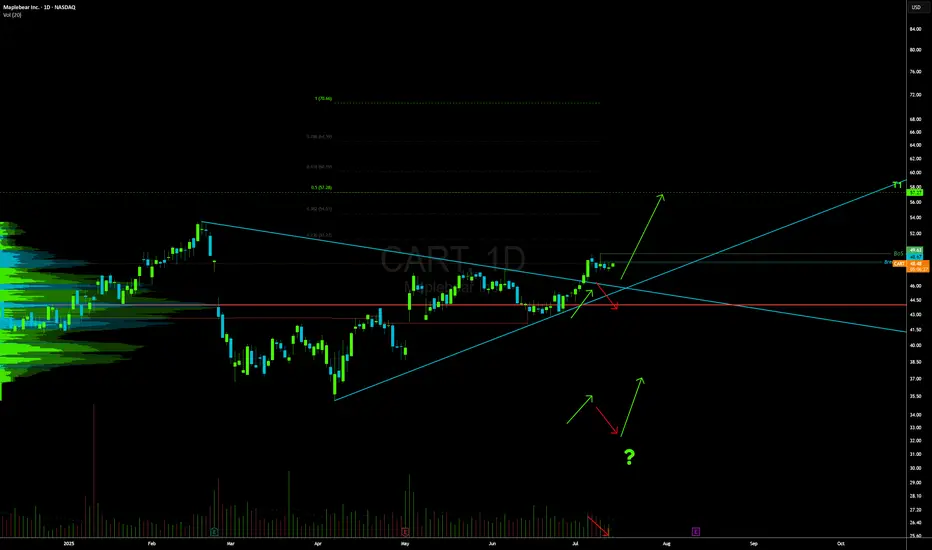
CART LONG
Strong Profits
The company makes solid money on what it sells. It keeps a high percentage of revenue as profit, with strong margins all around. It also generates good returns from the money it invests.
No Debt, Plenty of Cash
The company has almost no debt and a strong cash position. It has more than enough to cover short-term needs and stay financially stable.
Earnings Are Growing
Earnings more than doubled over the last year and are expected to grow again next year. Big investors like mutual funds and institutions are buying more of the stock, which is a good sign.
Business Has an Edge
The company has very high profit margins, which suggests it has pricing power or a business model that’s hard to compete with.
HIGH INSTITUTIONAL OWNERSHIP 66.15%
-Broke Out of a Wedge
The stock recently broke out of a wedge pattern, which often means it's ready to move higher.
-Pulling Back Gently
After the breakout, the stock is easing back on light trading volume INTO THE 8ema. That usually means sellers aren't too aggressive and a move higher could be coming.
Looking Toward the Mid-Fifties
Based on the current setup, the stock looks like it could climb to around 57 if momentum holds up.
-Momentum is Positive
The stock is trending above its key moving averages and has gained a lot over the past year. The trend is still strong.
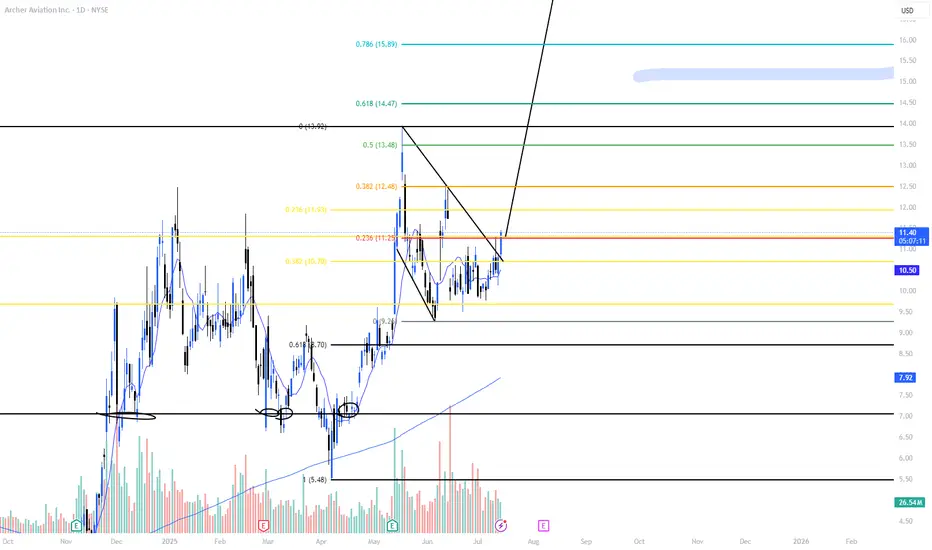
15 near term?NYSE:ACHR has been consolidating very well in this range, and today we saw a very strong candle with a lot of volume. This can be used as confirmation that it's breaking out of this channel to move higher. My first target is 12.48, then the ATH. After that, we should quickly reach the 14.5-15.8 range.
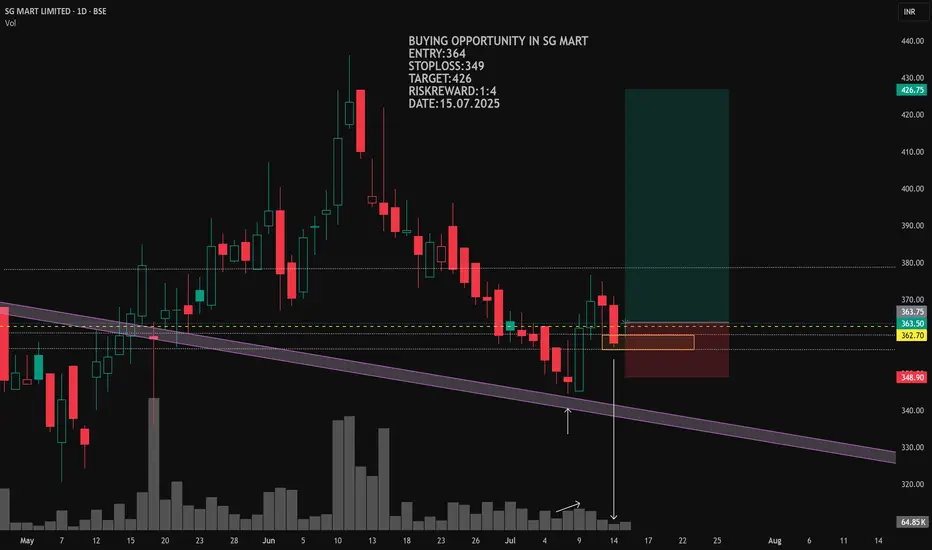
buying opportunity at sg mart stockbuying opportunity at sg mart stock
ENTRY:364
STOPLOSS:349
TARGET:426
RISKREWARD:1:4
DATE:15.07.2025
KALV FDA approval rallyKALV received FDA approval this week for a new drug, has $220mln in cash, and just bounced off the daily 21EMA (overlayed on this 4H chart).
Recently rejected off the monthly 100ema two times (overlayed on this 4H chart). Breakout beyond the monthly 100ema and first target is $20. Numerous price target increases, most notably, one at $27 and another increased from $32 to $40.


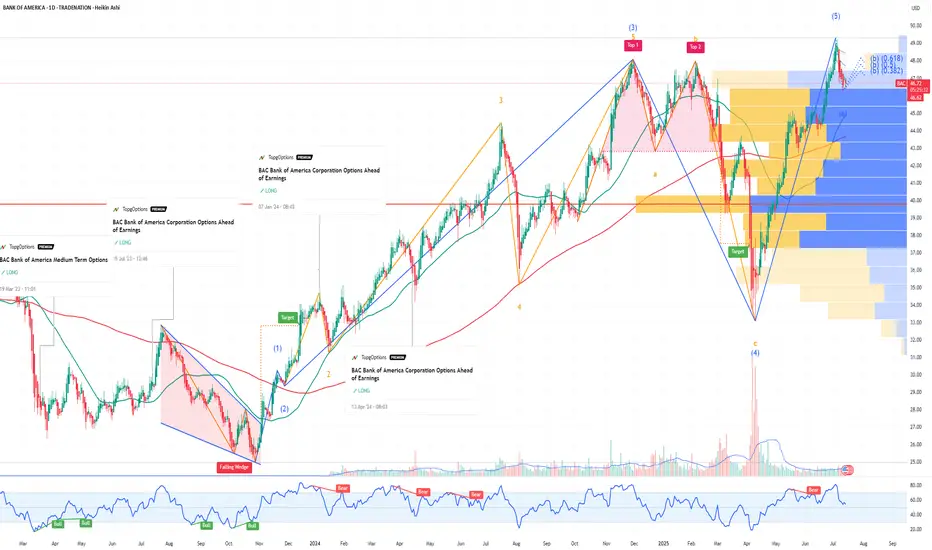
BAC Bank of America Corporation Options Ahead of EarningsIf you haven`t bought BAC before the rally:
Now analyzing the options chain and the chart patterns of BAC Bank of America Corporation prior to the earnings report this week,
I would consider purchasing the 48usd strike price Calls with
an expiration date of 2025-7-18,
for a premium of approximately $0.34.
If these options prove to be profitable prior to the earnings release, I would sell at least half of them.
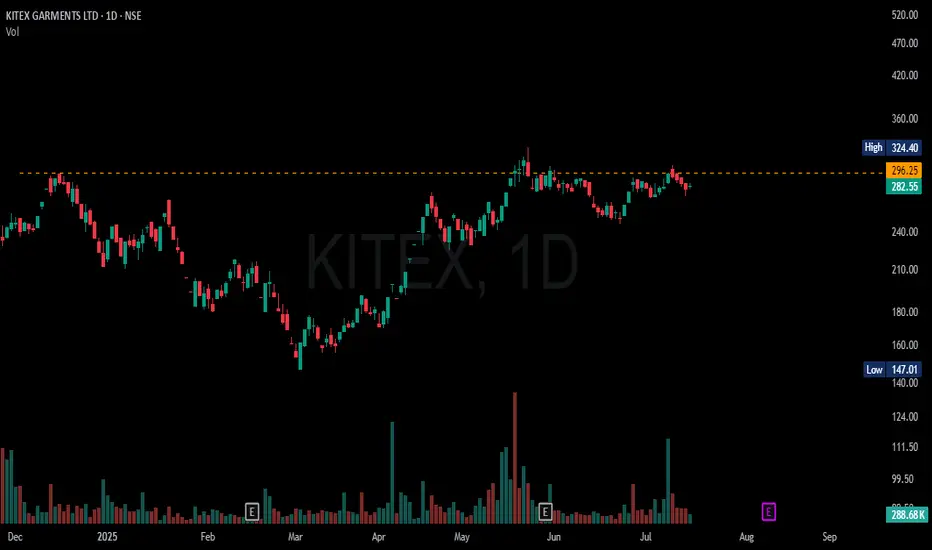
KITEX Ready to Move out of its ResistanceKITEX is moving in tight range after making new high and now volume has declined, Today`s tiny candle indicates it may break out the resistance soon.
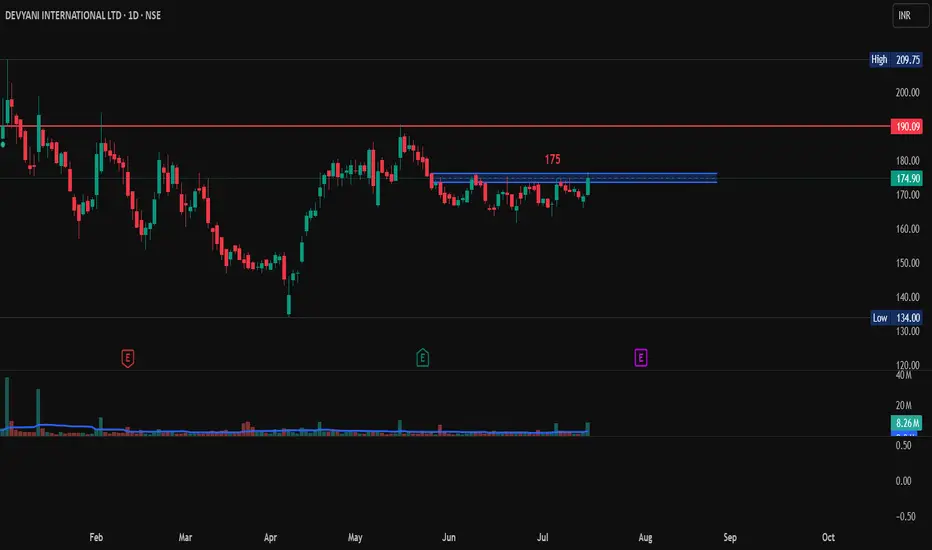
Devyani International Ltd., Long Trade, 1D Time FrameDevyani International limited so showing a good volume and is 3% up from its last day price. It has a resistance above 175. So if it breaks 175 with a good bullish candle then it may go long from here.
Entry: 175 If shows a good bullish candle stick pattern.
Target: 190 and above.
SL: 169.
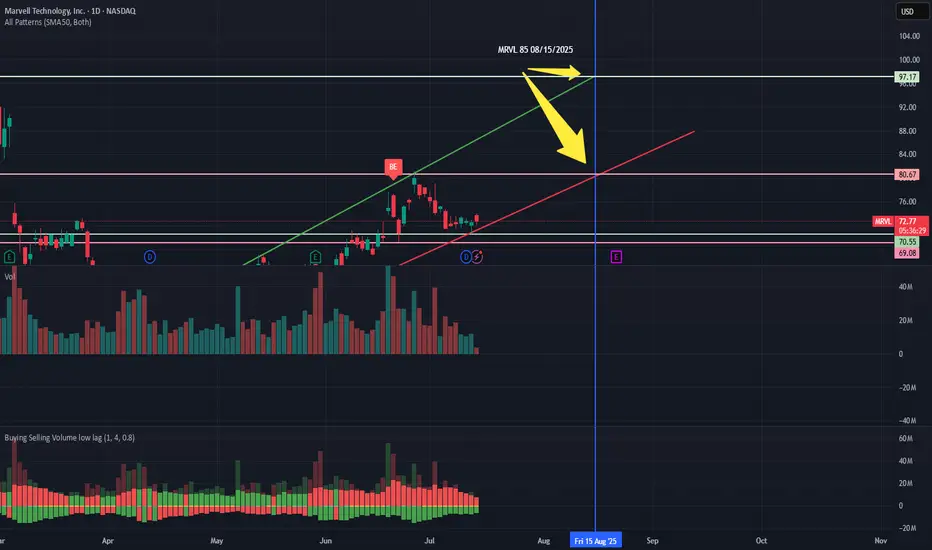
MRVL Trading Idea For Q2 EarningsNFA
I bought a few contracts for Call options for MRVL 08/15/2025 85 C last week.
Let's see how it plays out up to the earnings announcement and a few days beyond. :)
GLTA
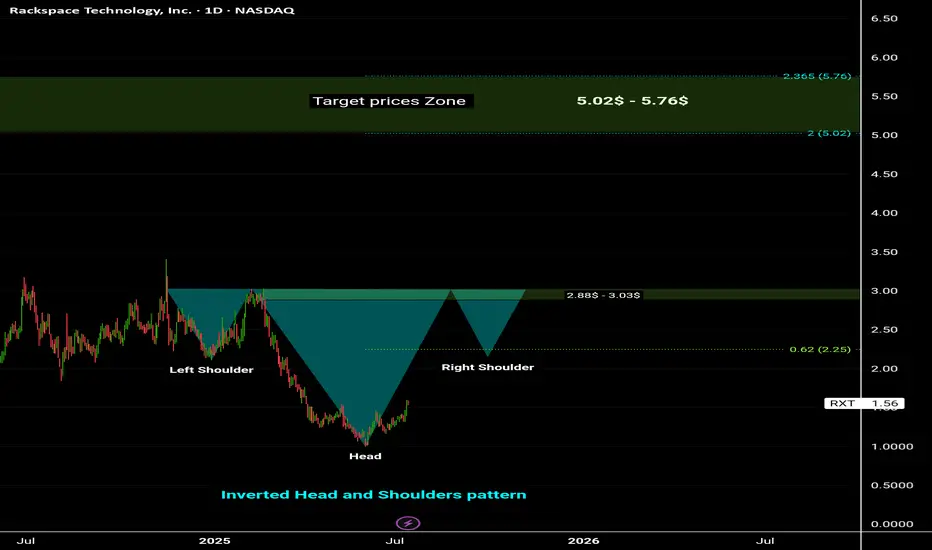
Rackspace Technology inc Stock in Triggering level 💯 , 1st Target prices zone between 2.88$ - 3.03$
Stock on Inverted Head and Shoulders pattern at the bottom, And Target prices zone between 5.02$ - 5.76$ ( Resistance level).
Highly recommended for Buy 👌
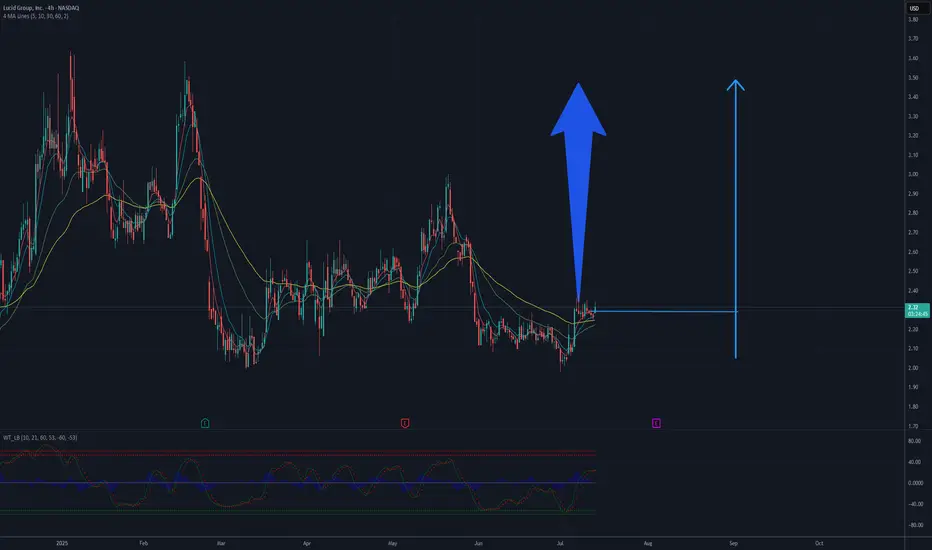
Time for Lucid Group Inc. (LCID) – Short-Term Bullish --3.50 USDLucid Group Inc. (LCID) on the 4-hour chart is showing a moderately bullish structure, suggesting potential for continued short-term upside. After a period of consolidation and base-building, the price has broken above key moving averages (MA5, MA10, and MA30), which are now turning upward and beginning to act as dynamic support. This shift indicates improving technical sentiment. The nearest resistance is around the $3.08 level — a zone defined by previous swing highs. A confirmed breakout above this level could pave the way toward the next target around $3.50, which represents both a psychological threshold and a former supply zone.
Supporting this bullish outlook, momentum indicators (likely WaveTrend or Stochastic RSI) are signaling continued upside pressure without yet showing strong overbought conditions. However, caution is warranted: if the price gets rejected at the $3.08 resistance, a pullback toward the $2.70–$2.75 support area is possible. Holding that support would be crucial for maintaining the current higher-low structure. Overall, the technical setup favors a move toward $3.50, but it requires follow-through from buyers at key resistance levels.
Potential TP : 3.50 USD
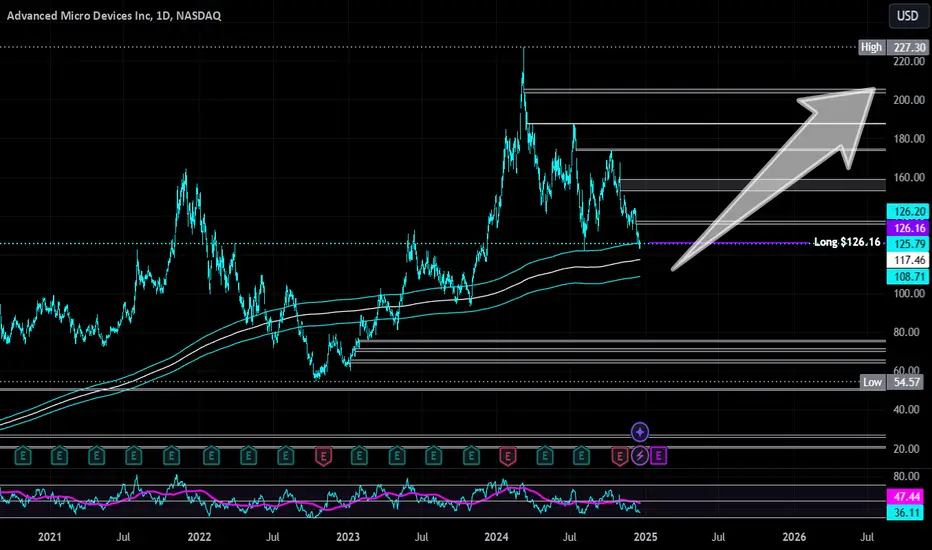
Advanced Micro Devices | AMD | Long at $126.00Advanced Micro Devices NASDAQ:AMD may be the sleeping giant in the semiconductor / AI space. While all eyes on NVidia NASDAQ:NVDA , earnings for NASDAQ:AMD grew by 800% over the past year... and are now forecast to grow 40% per year. Any other company would be soaring right now (like NVidia), but that company is getting all the attention. And, to me, this means opportunity for the future. The cashflow is likely to grow tremendously for
NASDAQ:AMD into 2027 and beyond, which may inevitably reward investors with dividends.
From a technical analysis perspective, NASDAQ:AMD just entered my historical simple moving average zone. This area (currently $108-$126) is where I will be gathering shares. Something tremendous would have to change regarding the fundamentals of this company (like a scandal) for the overall thesis to change. There may be some near-term price pains as NVidia gets all the focus, but to meet demand in the semiconductor and AI space, NASDAQ:AMD is poised to fulfill that roll in the future.
Target #1 = $158.00
Target #2 = $175.00
Target #3 = $188.00
Target #4 = $205.00
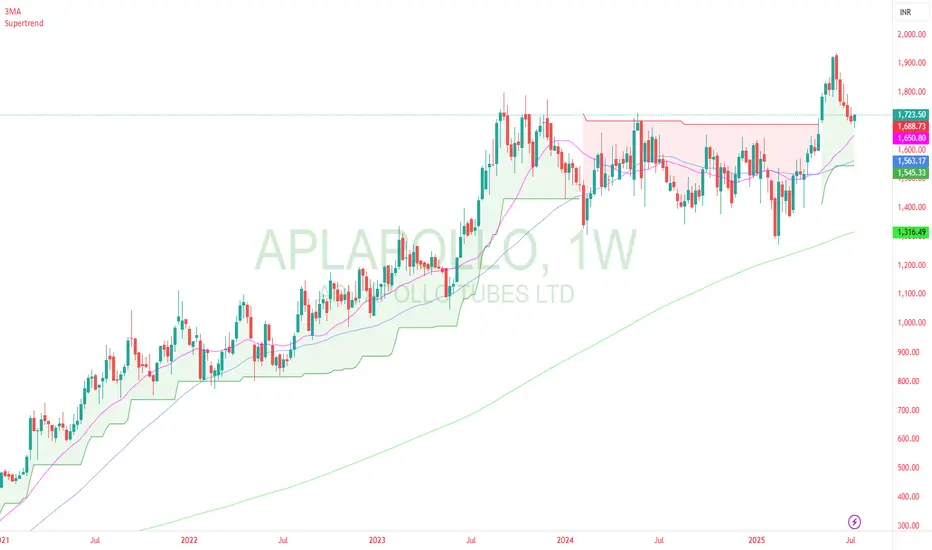
apl apollo - pullback trade apl apollo has given multimonth break out and stock gone upto 2000. Now stock has done puckback to previous resistance and stock is near ema 21 on weekly chart. This is best low risk high reward entry in good quality company/
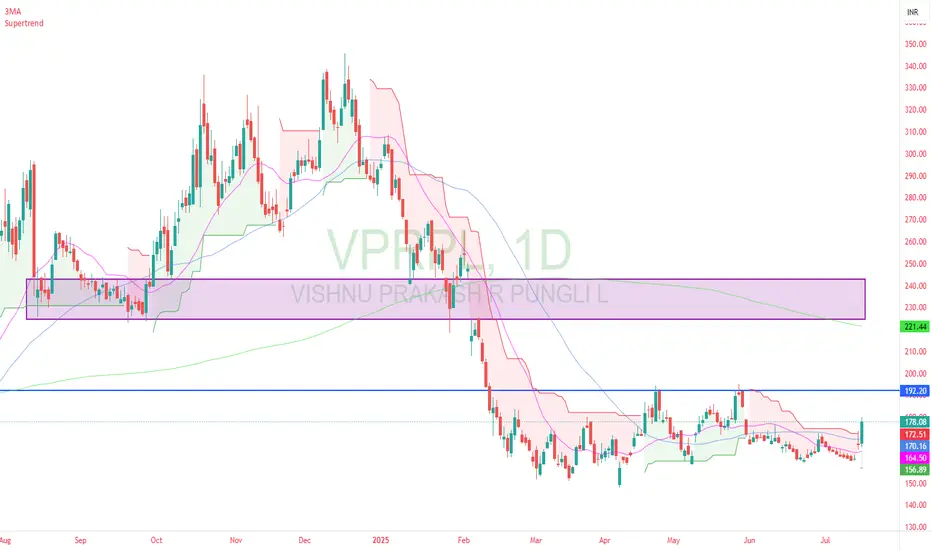
vprpl - with double bottom vprpl is downward going stock but recently stock has made double bottom and today stock become supertrend positive on daily chart.
Next resistance would be 191 and 220.
around 220 there is old gap and previous support also. so stock may go consolidation around that level of 220.
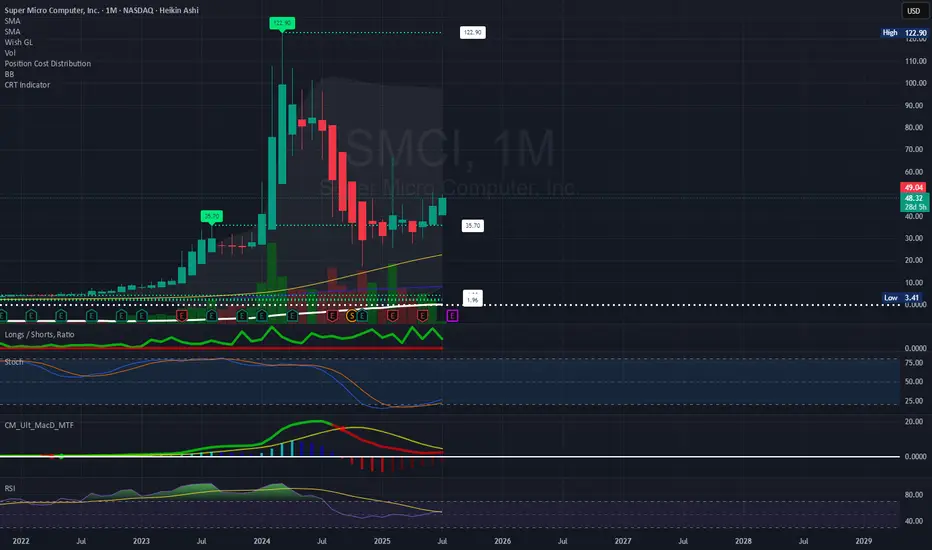
SMCI: The Monthly Chart says it ALL
Stochastic is way oversold.
MACD is converging.
RSI is converging back up.
Would not be surprised to see this soar back towards the CRT value of $65, then take on new challenges back towards it previous ATH of $122.90 in March, 2024.
Regards,
Terrapins

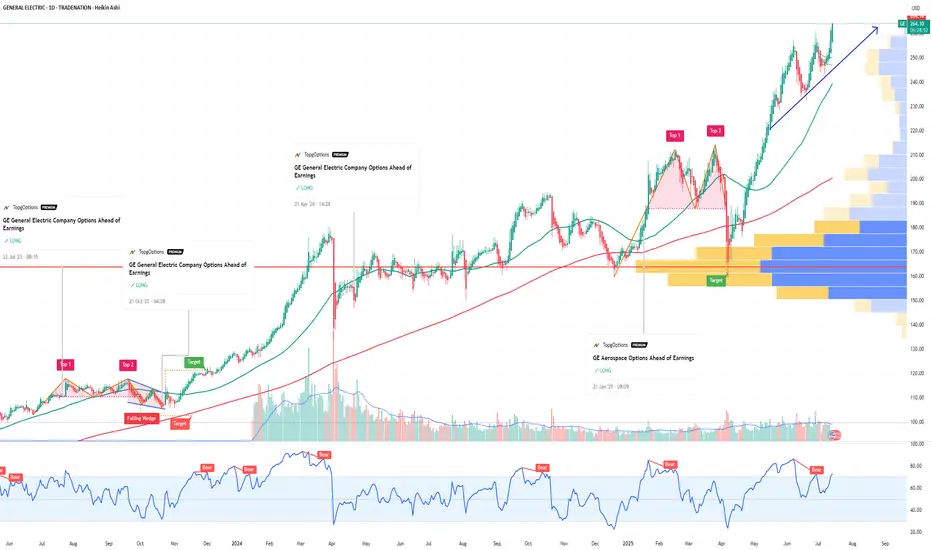
GE Aerospace Options Ahead of EarningsIf you haven`t bought GE before the rally:
Now analyzing the options chain and the chart patterns of GE Aerospace prior to the earnings report this week,
I would consider purchasing the 270usd strike price Calls with
an expiration date of 2025-8-15,
for a premium of approximately $8.60.
If these options prove to be profitable prior to the earnings release, I would sell at least half of them.
Disclosure: I am part of Trade Nation's Influencer program and receive a monthly fee for using their TradingView charts in my analysis.
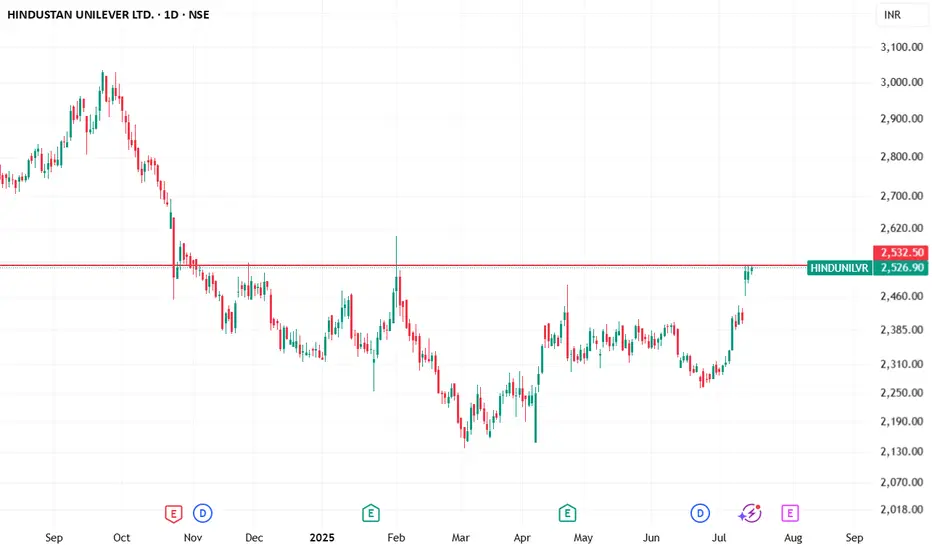
HINDUSTAN UNILEVER BUYING ABOVE 2532..Hindustan Unilever has changed character from bearish to bullish and now in a good range.
any move above 2532 will lead to a good upside move.
let's c how it works.
Pfizer May Be StallingPfizer has limped higher since April, but some traders may think the pharmaceutical giant is at risk of stalling.
The first pattern on today’s chart is the series of lower highs since January. PFE potentially just made another lower high at this falling trendline, which may suggest resistance is taking effect.
Second, the peak is occurring near the 200-day simple moving average. That could indicate its long-term trend is pointing lower.
Third is the 2023 low of $25.76. At the time, it was the lowest price in the preceding decade. After spending more than a year on either side of this level, PFE is now stalling in the same area. Has old support finally turned into new resistance?
Fourth, the candles of July 8 and July 10 showed prices trying and failing to cross the same long-term level. Such “shooting star” candlesticks may be short-term reversal patterns.
Finally, PFE is an active underlier in the options market. (It’s averaged more than 90,000 contracts per session in the last month, according to TradeStation data.) That might help traders take positions with calls and puts.
TradeStation has, for decades, advanced the trading industry, providing access to stocks, options and futures. If you're born to trade, we could be for you. See our Overview for more.
Past performance, whether actual or indicated by historical tests of strategies, is no guarantee of future performance or success. There is a possibility that you may sustain a loss equal to or greater than your entire investment regardless of which asset class you trade (equities, options or futures); therefore, you should not invest or risk money that you cannot afford to lose. Online trading is not suitable for all investors. View the document titled Characteristics and Risks of Standardized Options at www.TradeStation.com . Before trading any asset class, customers must read the relevant risk disclosure statements on www.TradeStation.com . System access and trade placement and execution may be delayed or fail due to market volatility and volume, quote delays, system and software errors, Internet traffic, outages and other factors.
Securities and futures trading is offered to self-directed customers by TradeStation Securities, Inc., a broker-dealer registered with the Securities and Exchange Commission and a futures commission merchant licensed with the Commodity Futures Trading Commission). TradeStation Securities is a member of the Financial Industry Regulatory Authority, the National Futures Association, and a number of exchanges.
Options trading is not suitable for all investors. Your TradeStation Securities’ account application to trade options will be considered and approved or disapproved based on all relevant factors, including your trading experience. See www.TradeStation.com . Visit www.TradeStation.com for full details on the costs and fees associated with options.
Margin trading involves risks, and it is important that you fully understand those risks before trading on margin. The Margin Disclosure Statement outlines many of those risks, including that you can lose more funds than you deposit in your margin account; your brokerage firm can force the sale of securities in your account; your brokerage firm can sell your securities without contacting you; and you are not entitled to an extension of time on a margin call. Review the Margin Disclosure Statement at www.TradeStation.com .
TradeStation Securities, Inc. and TradeStation Technologies, Inc. are each wholly owned subsidiaries of TradeStation Group, Inc., both operating, and providing products and services, under the TradeStation brand and trademark. When applying for, or purchasing, accounts, subscriptions, products and services, it is important that you know which company you will be dealing with. Visit www.TradeStation.com for further important information explaining what this means.

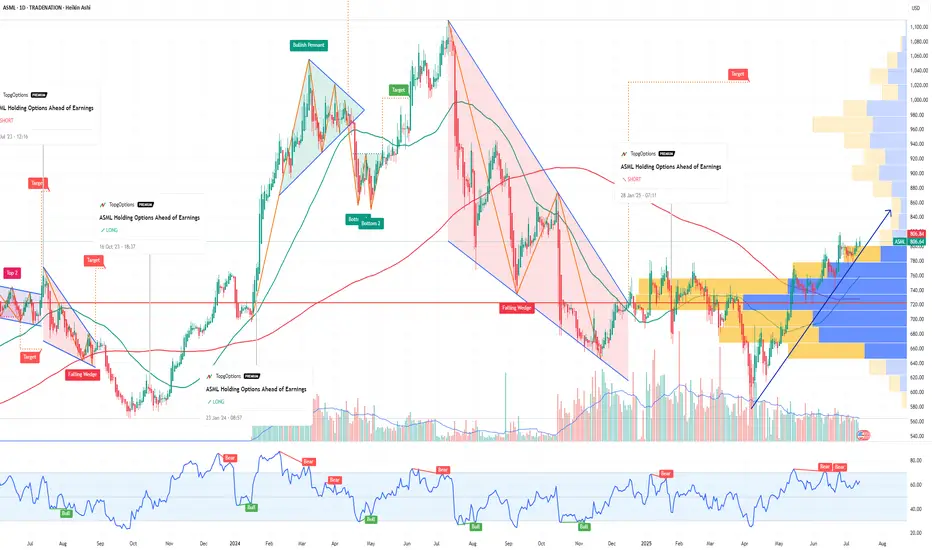
ASML Holding Options Ahead of EarningsIf you haven`t bought the dip on ASML:
Now analyzing the options chain and the chart patterns of ASML Holding prior to the earnings report this week,
I would consider purchasing the 800usd strike price Calls with
an expiration date of 2025-7-25,
for a premium of approximately $32.00.
If these options prove to be profitable prior to the earnings release, I would sell at least half of them.
Disclosure: I am part of Trade Nation's Influencer program and receive a monthly fee for using their TradingView charts in my analysis.
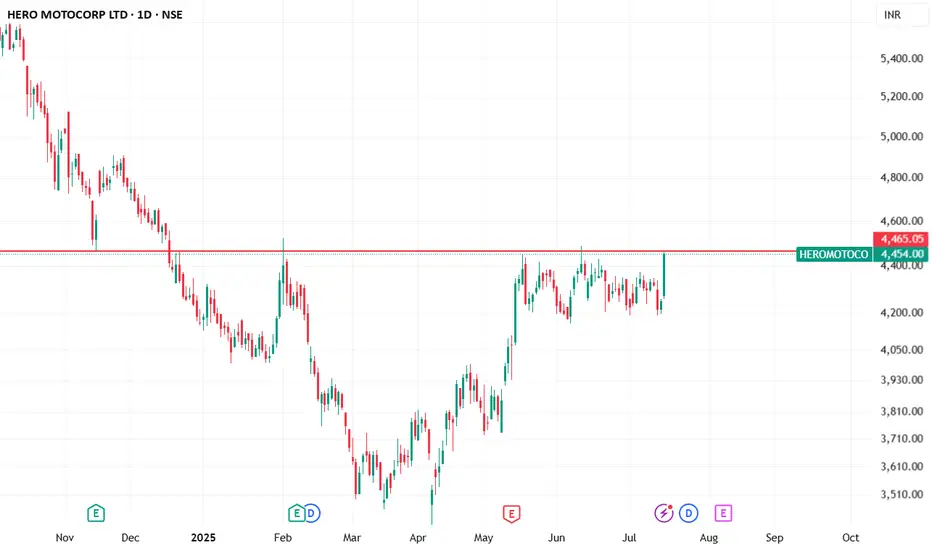
HEROMOTOCO BUYING ABOVE 4465..Hero moto Corp ltd,very bullish above 4465
stock has already changed its character from bearish to bullish
and now consolidating in a good range.
looking to buy above 4465, can give very quick move whenever it happens.