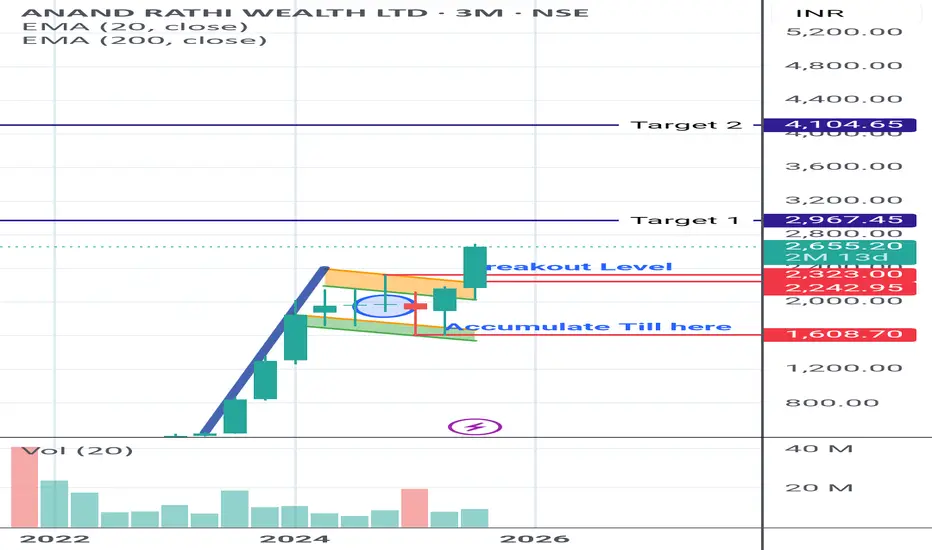
Anand Rathi in BULLISH FLAG What more to explain about the beauty of the Ch(art)
- P Senthil Kumar
Chart Lover
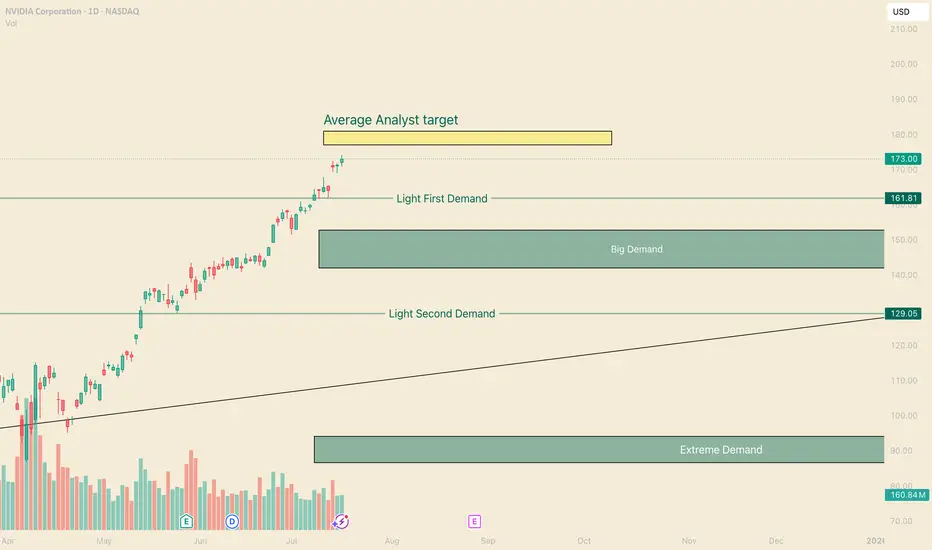
NVDA Nearing it's top, When to Buy in?Hi, I’m The Cafe Trader.
This week we’re continuing our breakdown of the MAG 7, and today we’re taking a look at NVIDIA (NVDA) — 2 out of 7 in the group have broken out to new all-time highs, and NVDA is one of them.
⸻
🧠 Analyst Targets
Analyst price targets for NVDA are wide-ranging — some as low as $80, others as high as $250.
The average target is around $180, and NVDA is currently approaching that level.
Buying into strength like this can be difficult, so I’ve prepared a few long-term price zones for those looking to add on dips.
⸻
📈 Long-Term Price Zones to Watch:
• Aggressive Entry Zone: ~$163
This is the top of a developing demand zone. You’ll see some buyer interest here, but that demand extends down toward $144.
• Primary Demand Area: $153–$144
This is where stronger buyers have shown up in the past. It’s a more balanced zone and could act as a key support in any retracement.
• Deep Value Zone: ~$129
If NVDA pulls back this far, this would be my favorite buy level. Anything at $130 or lower would represent what I consider a steal — strong value relative to long-term expectations.
⸻
📊 Follow for more MAG 7 price breakdowns.
Up next: a deeper dive into NVDA for shorter-term swing trades and technical setups.
📍@thecafetrader
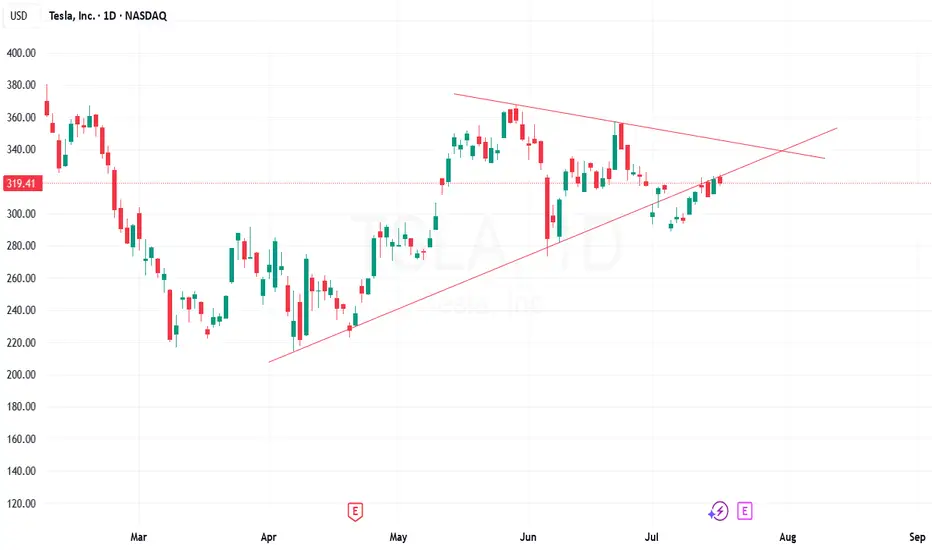
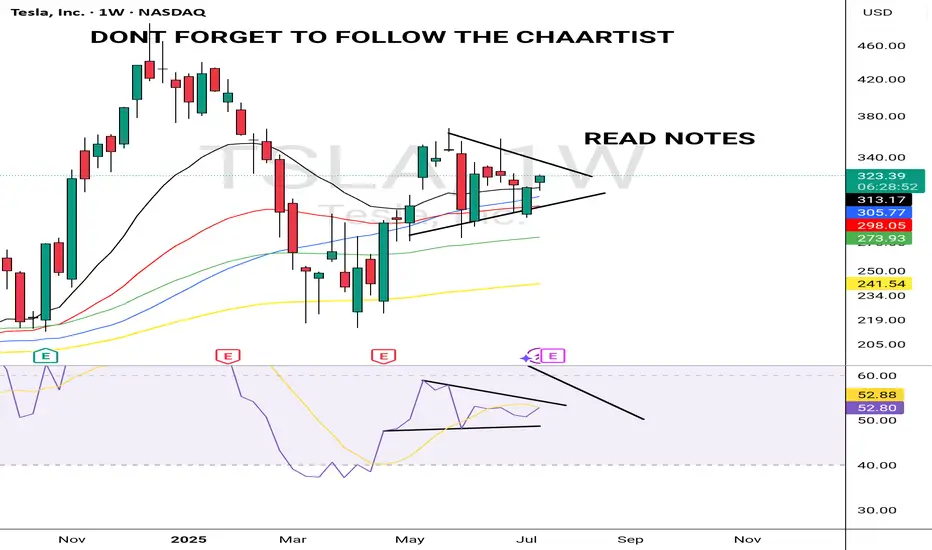
TSLA ULLISH JULY 18 2025Tsla is lloling extremely bullish technically. If it stops me out ,il exit but my my targets from here would be $390.
Always put a SL & decide a target before your entry
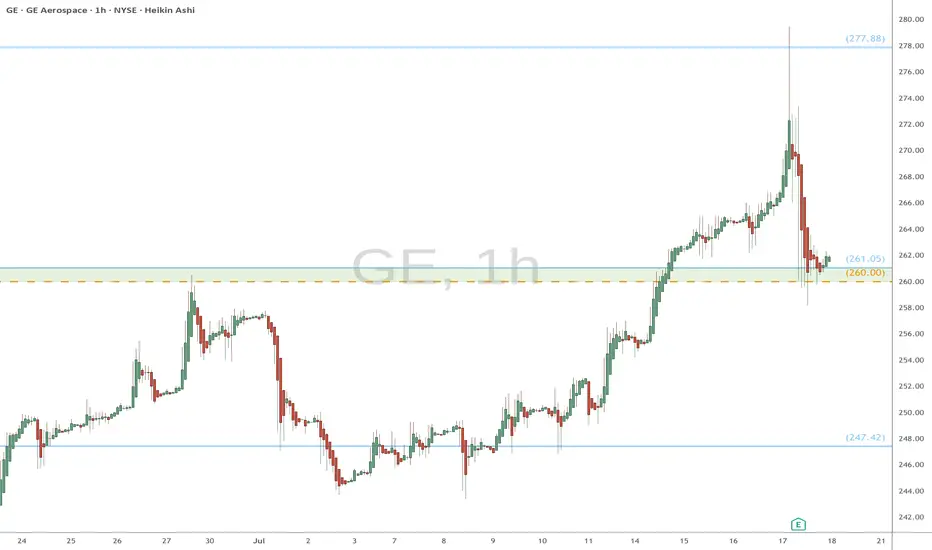
GE watch $260-261: Key support to maintain strong UptrendGE has been in a strong uptrend for a couple of years now.
Earnings report dropped it to support zone at $260.00-261.05
This zone is now clearly visible to everyon, so Do-or-Die here.
Long entry here with tight stop loss just below zone.
======================================================
.
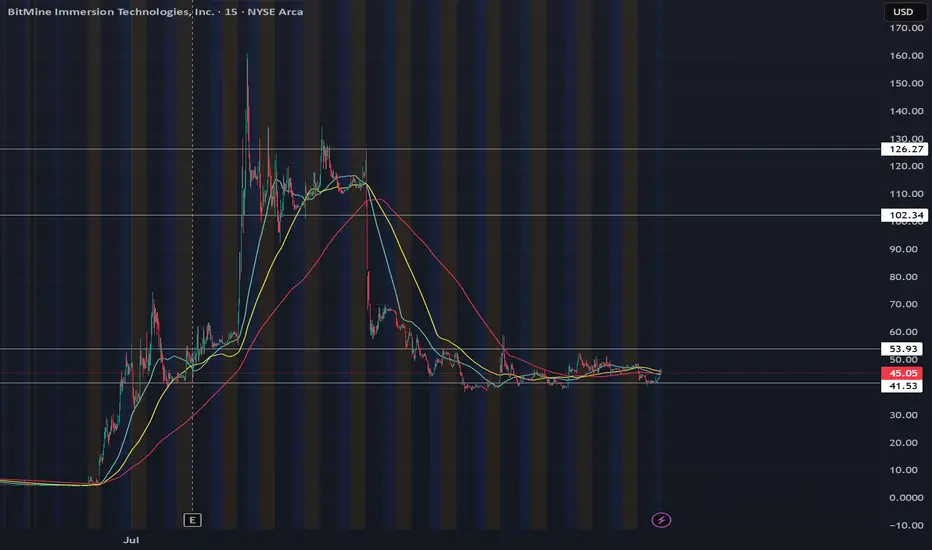
BACK TO 100Bought shares today at close new legislation is going to send this sky high. BMNR just may actually be the MSTR of ETH with the players they have. SBET BTBT COIN all will do great, but BMNR currently holds the lead for largest ETH treasury. Maybe more chop to average shares but this will be going SOON. As long as the daily RSI is above 50, we should be holding local support until breakout of this is accumulation zone.
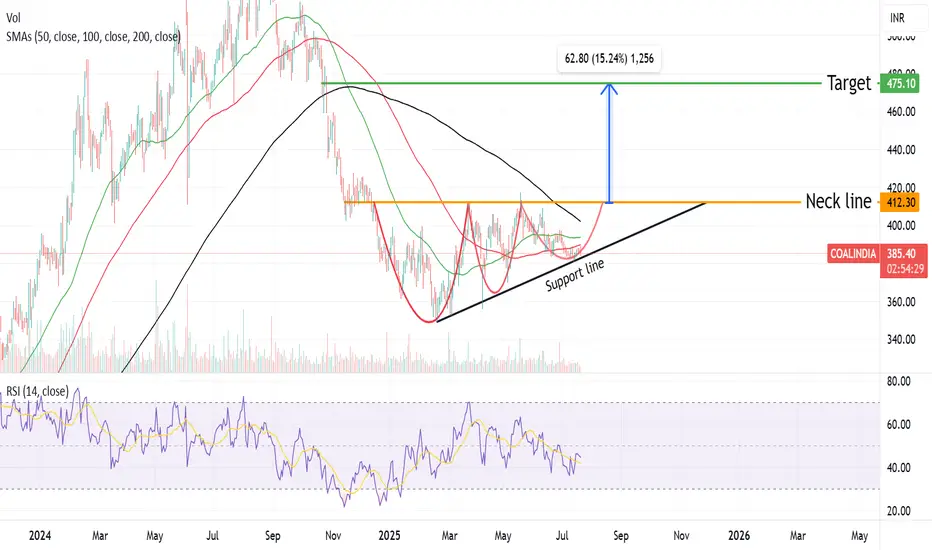
Coal India CUP & HANDLE Pattern formation going on Coal India currently forming a CUP & Handle pattern ,Breakout of this pattern will be above 410 level .Target price will be arround 470 level .One can start accumulation in Coal India .Stoploss will be arround 360 level
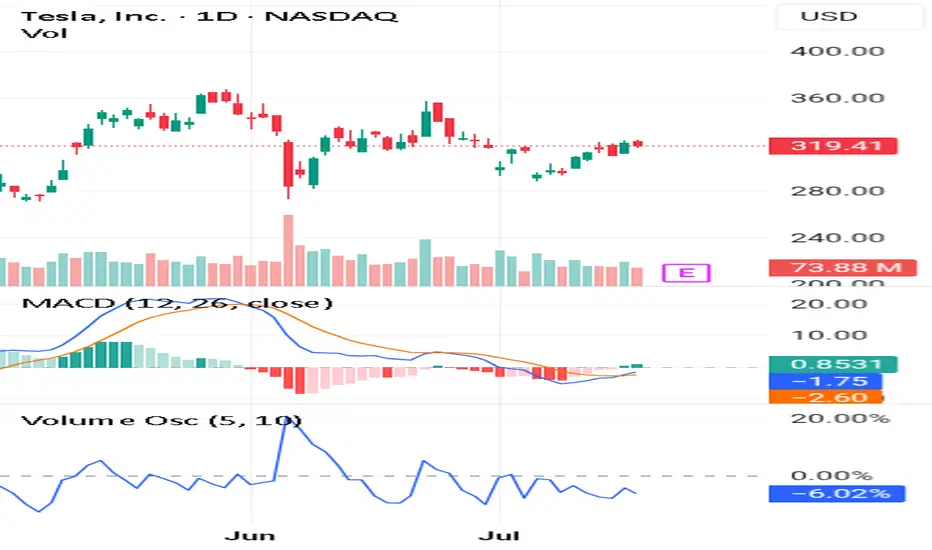
(Learn More)Use These 3 Steps To Spot Long-Lasting Trends👉Trade before the earnings report
👉Make sure the volume oscillator is below zero
👉Make sure the MACD lines give you a Bullish signal
If you look at this chart you can see all the steps alignment.
This is very important because you want to catch a long term trend.
Also it has to follow the 3step rocket booster strategy.
In order for you to learn more about this strategy 🚀 Rocket Boost This Content.
Disclaimer ⚠️ Trading is risky please learn how to use Risk Management And Profit Taking Strategies. Also feel free to use a simulation trading account before you use real money.
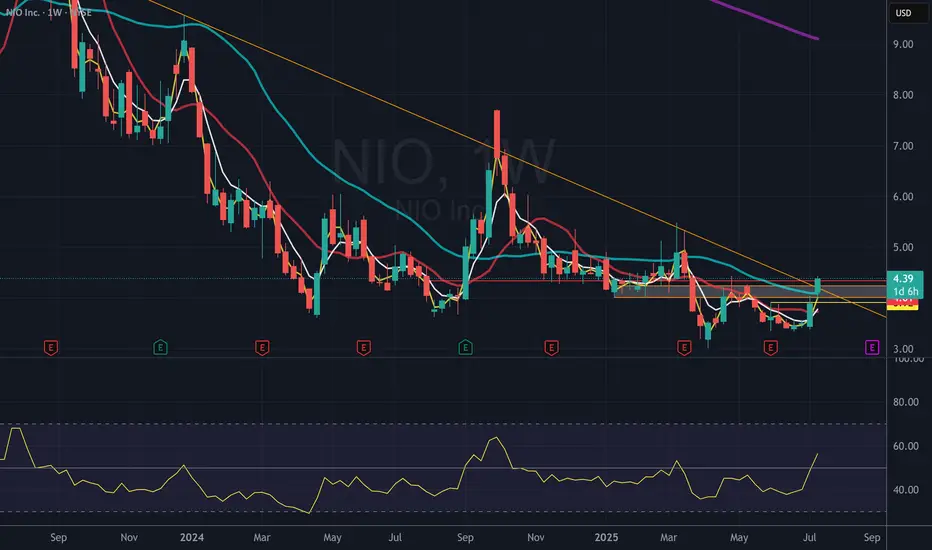
NIO smashing overhead resistanceWill start position with weekly close above 4.35.
Initial stop below 3.75 as choppiness expected
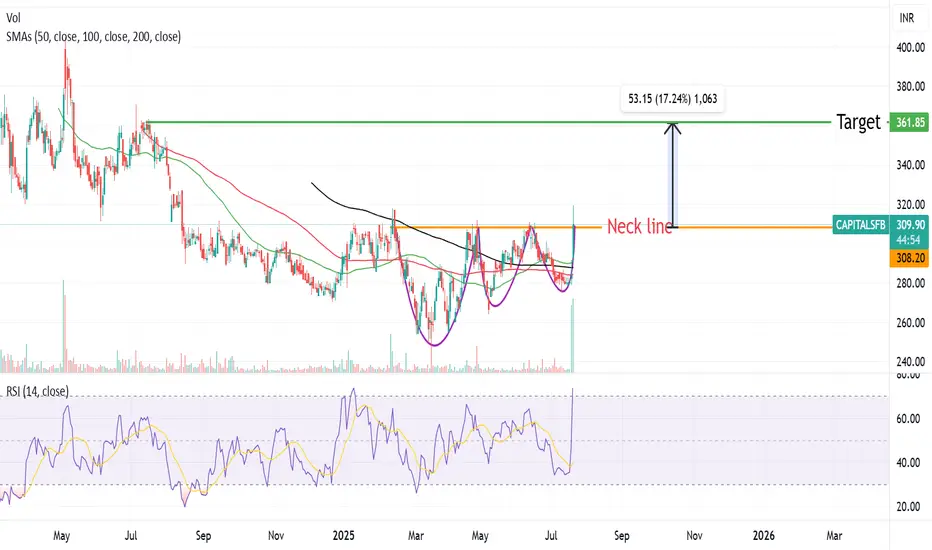
Capital SFB formed a Complex CUP & Handle Pattern Capital SFB formed a Complex CUP & Handle Pattern ,Breakout of this Pattern will be above 310 level one can accumulate the stock with a stoploss of 280 for a Target price of 360 Rs.
MNMD bulls continue very impressive upwardss marchBulls close at high of day, continuing a very strong two week bull move to confirm the weekly uptrend and continue to march towards key Monthly resistance at 10.44. We won't be surprised for daily consolidation when it comes but for now the hourly uptrend is our guide and the daily chart is riding a very fast moving EMA5.
Resistances Weekly 200ma, 10.44
Supports 8.43 (short term), 6.40 on daily

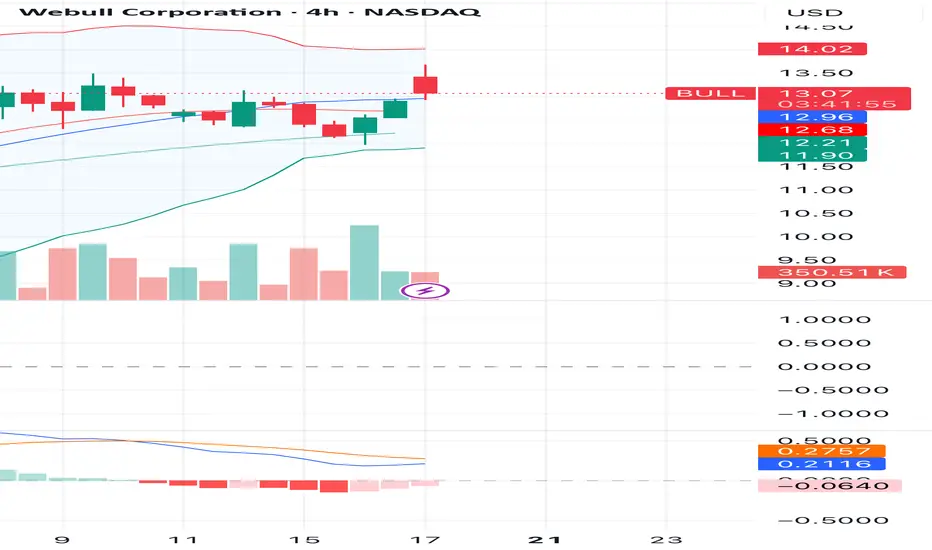
Webull Corporation Showing Bullish Momentum – Breakout in ProgreThe 4H chart for Webull Corporation shows a strong bullish breakout candle above key moving averages, signaling potential for continued upside momentum. The price has closed above the middle Bollinger Band and is testing the upper band with increasing volume — a bullish sign supported by a recent uptick in MACD histogram.
🔹 Entry Point: $13.03
🔹 First Target (TP1): $14.01 (recent resistance)
🔹 Second Target (TP2): $15.50 (projected breakout range)
🔹 Stop Loss: $12.68 (below support and MA)
This setup indicates a possible short-term rally, especially if volume continues to rise. Monitor closely for follow-through and watch for potential pullbacks to the 12.90–13.00 area as a re-entry zone.
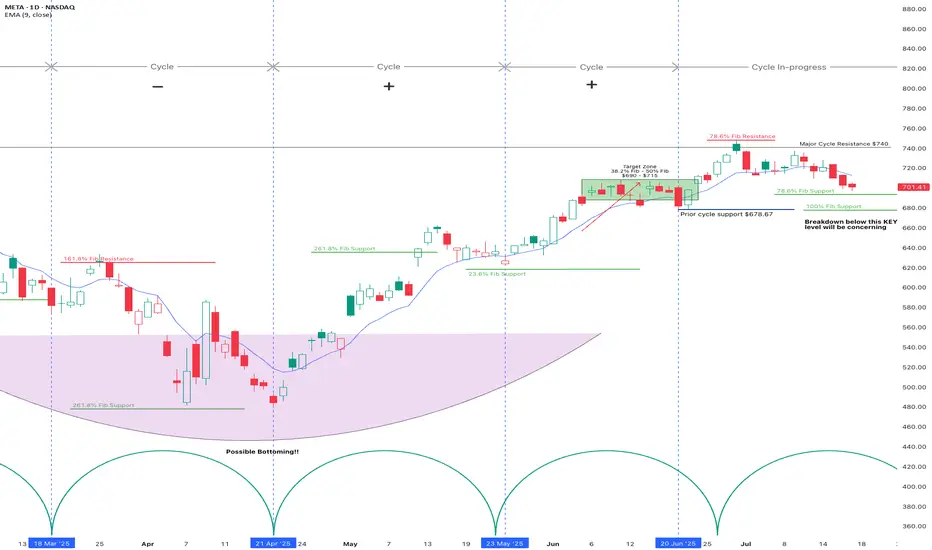
Is Meta breaking down?It's too early to tell. But investors need to keep an eye out for key support levels at $680 - $700
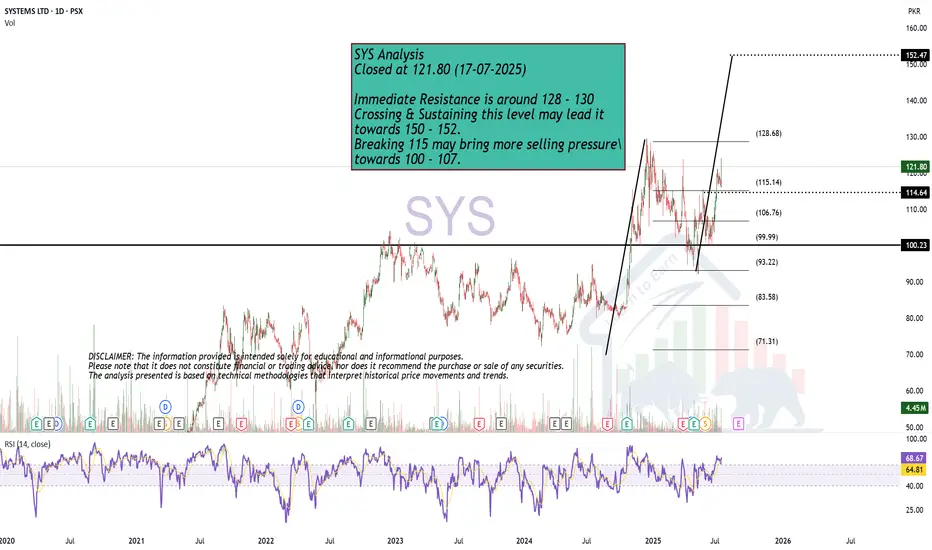
ABCD PatternSYS Analysis
Closed at 121.80 (17-07-2025)
Immediate Resistance is around 128 - 130
Crossing & Sustaining this level may lead it
towards 150 - 152.
Breaking 115 may bring more selling pressure\
towards 100 - 107.
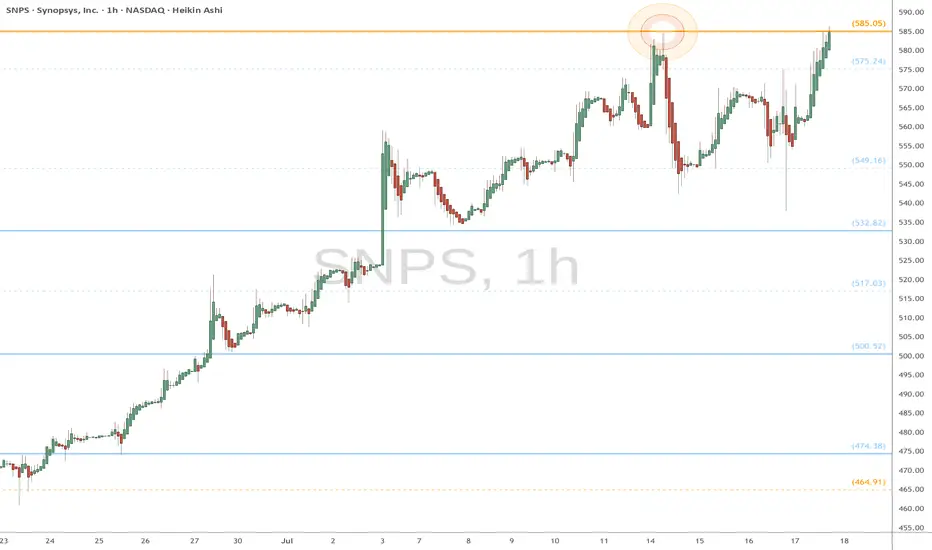
SNPS eyes on $585.05: Golden Genesis break should RUN strongSNPS back to a Golden Genesis that caused last dip.
Current stance and market winds favor break and run.
$585.05 will be key for entries and tight stop losses.
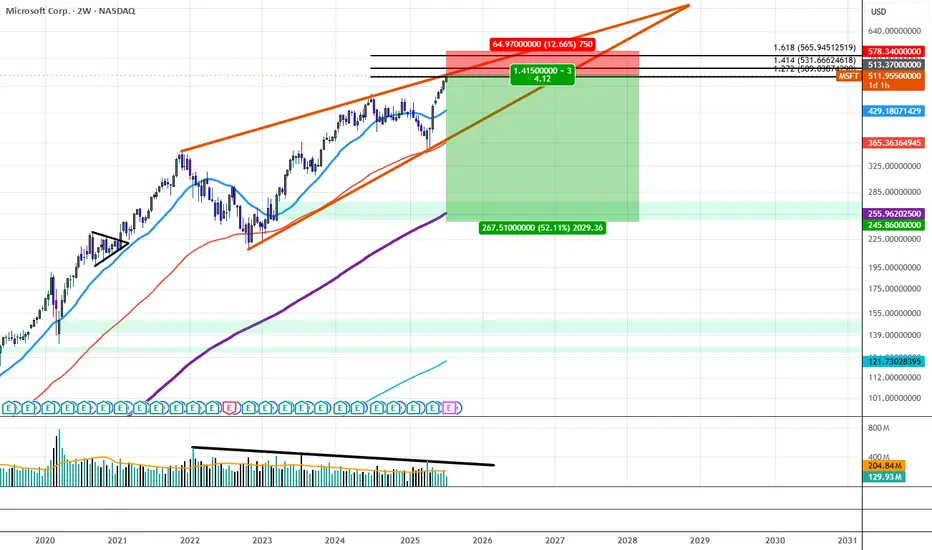
Microsoft Sees Declining Trading Volume Despite All Time HighsSince December of 2021, MSFT traded within a Rising Wedge structure that has gradually resulted in lower and lower highs in volume, at the same time IV on the Options Chain has begun to price down the strikes above $515 while Shorter Term Downside IV has begun to price up all the way out to $240.00. If this trend continues we will likely see the $515 area act as strong resistance as liquid interest above it begins to dry out.
This could be the beginning of a move to break down the wedge and trade down to the lower strikes first targeting the $365 price level and resolving around $240 near the 200 Period SMA.
The AMD Long Heist – Ready to Rob the Bulls?!🚨 AMD Stock Vault Heist: Bullish Breakout Plan with Thief Trading Style! 📈💰
🌟 Greetings, Wealth Raiders & Market Mavericks! 🌟
Hello, Ciao, Salaam, Bonjour, and Hola to all you savvy traders! Ready to crack the AMD Stock Vault (Advanced Micro Devices Inc.) with our 🔥 Thief Trading Style 🔥? This high-energy strategy blends technical precision with fundamental firepower to execute the ultimate market heist. Let’s dive into the plan, lock in profits, and escape the high-risk resistance zone like pros! 🏆💸
📝 The Heist Plan: AMD Bullish Breakout Strategy
Our chart lays out a long-entry blueprint designed to capitalize on AMD’s bullish momentum. The goal? Swipe the profits and exit before the bears take control at the resistance zone. This is a high-reward, high-risk setup, so stay sharp! ⚠️
📈 Entry: Crack the Vault!
Timing: Strike when the vault is open! Place buy limit orders on pullbacks within a 15 or 30-minute timeframe targeting the most recent swing low or high.
Tactic: Use a Dollar Cost Averaging (DCA) or layering strategy to stack multiple entries for optimal positioning.
Pro Tip: Look for bullish confirmation (e.g., candlestick patterns or volume spikes) to ensure you’re entering with momentum. 🚀
🛑 Stop Loss: Secure the Getaway!
Place your stop loss below the nearest swing low on the 3-hour timeframe (around $148.00 for day/swing trades).
Adjust based on your risk tolerance, lot size, and number of layered entries.
Why? This protects your capital from sudden reversals while giving the trade room to breathe. 🛡️
🎯 Target: Cash Out Big!
Aim for $179.00, a key resistance zone where bears may counterattack.
Watch for signs of overbought conditions or consolidation near this level—be ready to take profits and treat yourself! 💪🎉
💡 Why AMD? The Fundamental Fuel ⛽
AMD’s bullish surge is powered by:
Tech Sector Momentum: Strong demand for semiconductors and AI-driven chips.
COT Report Insights: Institutional buying pressure (check latest Friday COT data, UTC+1). 📅
Macro Tailwinds: Favorable economic conditions and positive sentiment in tech indices.
Geopolitical Stability: No major disruptions impacting tech supply chains.
Intermarket Edge: Monitor NASDAQ 100 and semiconductor ETFs for correlated moves. 📊
For a deeper dive, review:
Macroeconomic trends
Sentiment analysis
Index-specific correlations
Future price projections (overall outlook score: Bullish). 🌎
⚠️ Trading Alert: Navigate News & Volatility 📰
News releases can shake up the market like a rogue alarm system! To stay safe:
Avoid new trades during major news events (e.g., earnings or Fed announcements).
Use trailing stop-loss orders to lock in profits and protect open positions.
Stay agile—monitor real-time updates to adjust your strategy. 🚨
📌 Risk Disclaimer
This analysis is for educational purposes only and not personalized investment advice. Always conduct your own research, assess your risk tolerance, and align your trades with your financial goals. Markets move fast—stay informed and adaptable! 📚
💥 Boost the Heist! 💥
Love this Thief Trading Style? Smash the Boost Button to supercharge our robbery squad! 💪 Every like and share fuels our mission to conquer the markets with ease. Join the team, steal the profits, and let’s make money rain! 🌧️💰
Stay tuned for the next heist plan, you legendary traders! 🤑🐱👤🚀

Review and plan for 18th July 2025Nifty future and banknifty future analysis and intraday plan.
Analysis of quarterly results.
This video is for information/education purpose only. you are 100% responsible for any actions you take by reading/viewing this post.
please consult your financial advisor before taking any action.
----Vinaykumar hiremath, CMT

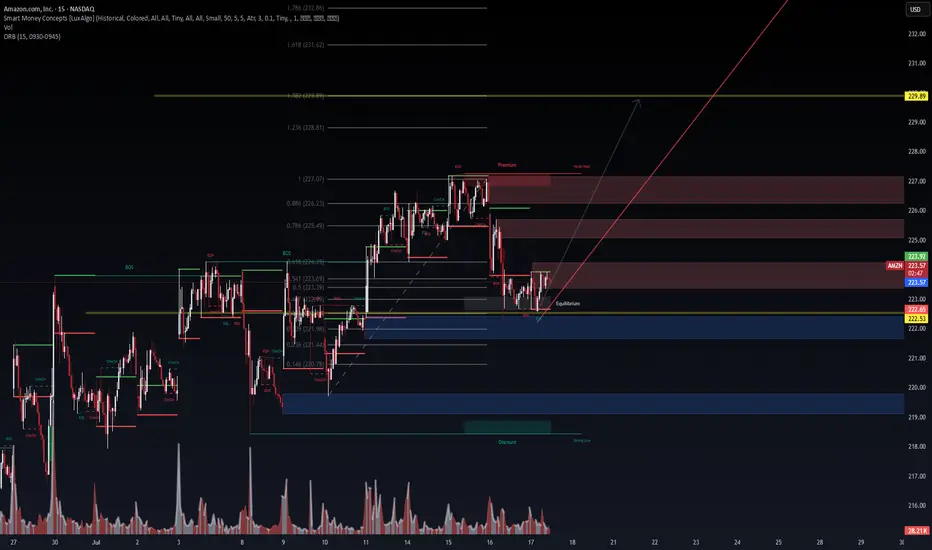
AMZN 15m – Institutional Demand Reclaim in Progress | VolanX Pro📈 AMZN 15m – Institutional Demand Reclaim in Progress | VolanX Protocol Alert
Amazon (AMZN) is staging a potential bullish reversal from a deep discount zone following a strong rejection near the 0.146–0.236 Fibonacci confluence at ~$220.78–221.44. We are now consolidating near the equilibrium zone (223) with signs of early accumulation.
📊 Technical Thesis:
Break of Structure (BOS) at 223.92 sets short-term bullish intent.
Reclaiming the ORB high and equilibrium.
Price rejected from deep demand (blue zone) and now printing EQH + BOS microstructures.
Premium liquidity sits above 227–229, with a magnet at FIB extension 1.618–1.786 = 231.62–232.86.
Volume profile shows declining sell pressure post-demand sweep.
📌 Key Levels:
Support: 222.53 | 221.44 | 220.78 (deep value zone)
Resistance: 226.23 (0.886 FIB) → 229.89 (FIB target zone)
Smart Money Premium: 226.5–229.8
🧠 VolanX Protocol Bias:
This is a long-biased setup, favoring institutional reaccumulation. If AMZN maintains above 223 with volume absorption, we anticipate a liquidity sweep through the premium zone, targeting 229.89.
🎯 Probabilistic Targeting:
60% → Retest 226.23 (EQH magnet zone)
30% → Breakout and reach 229.89 (measured move)
10% → Breakdown below 222.53 invalidates the setup
⚠️ Risk Note (VolanX Standard):
This post reflects strategic technical modeling, not financial advice. Trade your own system. View this as a signal integrity alignment, not a directive.
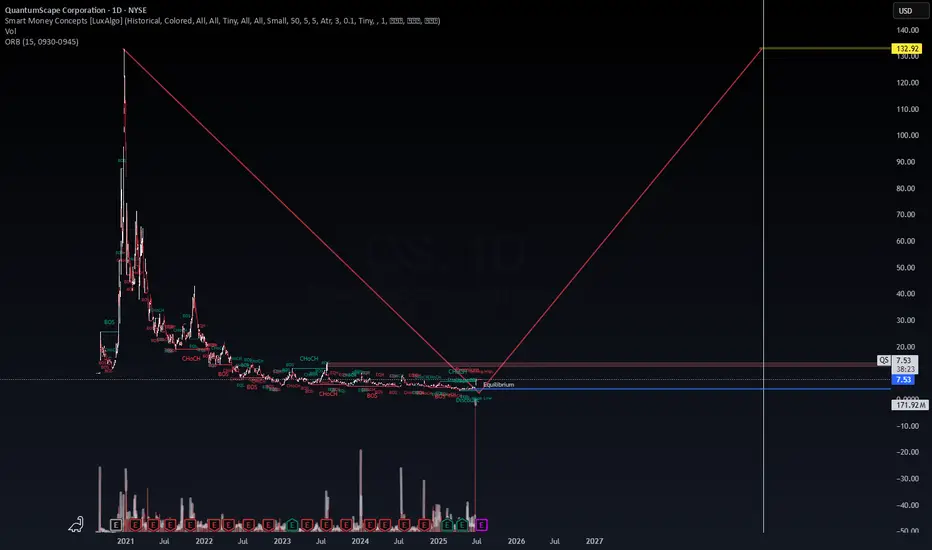
QuantumScape ($QS) | Long-Term Bet on Solid-State Battery RevoluQuantumScape has officially re-entered our radar after today's +32.72% move—driven by their “Cobra” separator scaling breakthrough. Volume surged to 171M+ confirming a major displacement event.
From a Smart Money Concepts (SMC) lens, the market structure shows repeated Change of Character (ChoCH) and Break of Structure (BOS) patterns, indicating institutional accumulation underway since late 2023.
Our internal Decision Support System (DSS) highlights this zone between $5.60–$7.50 as the “Equilibrium Rebuild Range.” The future projection targets $132.92, aligned with historical inefficiencies and Fibonacci cluster zones.
🔋 Catalysts to watch:
Cobra separator now in baseline production
Volkswagen licensing & Murata JV scaling
July 23, 2025: Q2 earnings & 2026 commercialization roadmap
💼 We are personally invested in QS and plan to scale out near the projected yellow level. Trade is actively monitored. Risk-managed with invalidation below key demand zones.
⚠️ This is not financial advice. For educational and strategic research purposes only.
—
WaverVanir_International_LLC | Quantified Capital Deployment
#QS #QuantumScape #SolidState #BatteryTech #LongTermInvesting #WaverVanir #SMC #EVRevolution #OptionsFlow
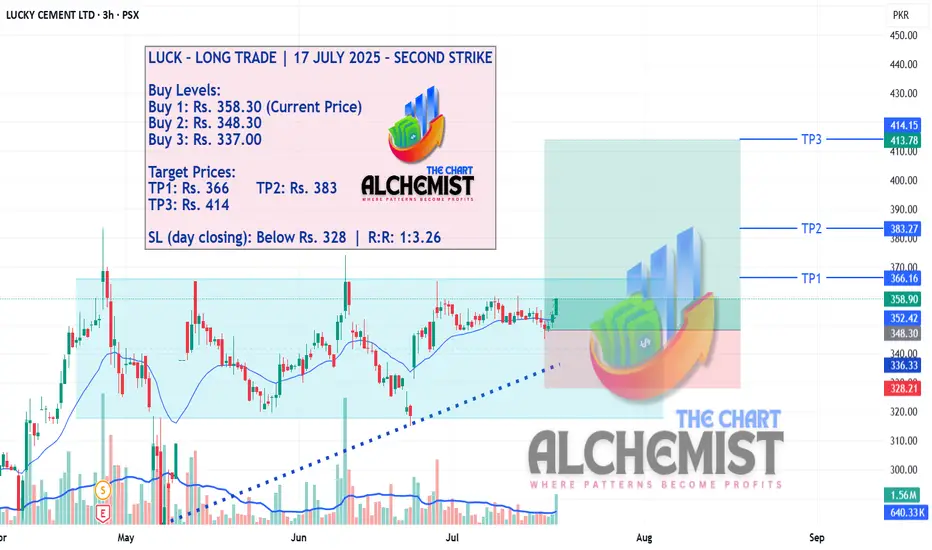
LUCK – LONG TRADE | 17 JULY 2025 – SECOND STRIKELUCK – LONG TRADE | 17 JULY 2025 – SECOND STRIKE
LUCK has been in a consolidation phase within a trading range (marked by a light blue channel) since April 2025. The latest price action suggests strength and positioning for a breakout, offering a favorable entry with promising upside potential.
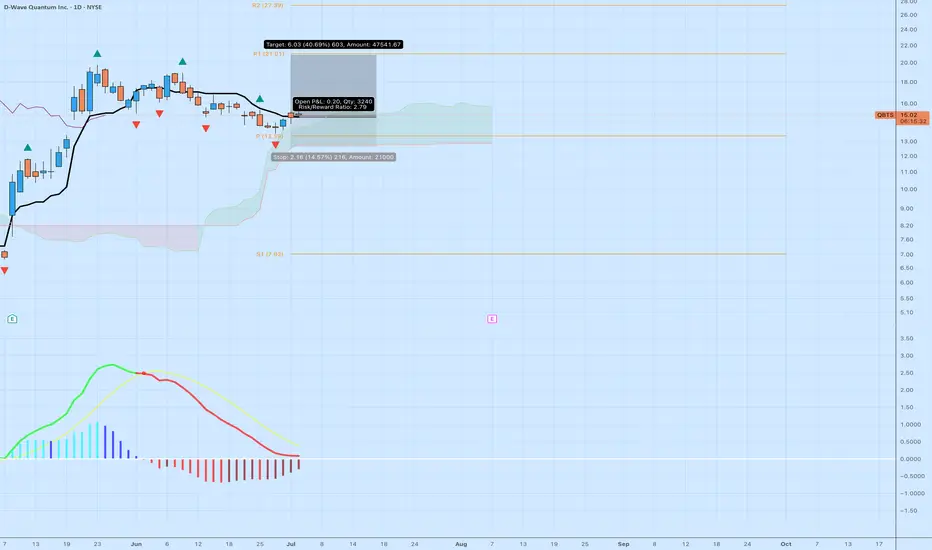
QBTS: Bottoming Structure with 40% Upside PotentialNYSE:QBTS just posted its cleanest bounce attempt in weeks.
📈 Technical Breakdown
Ichimoku Cloud: Price reclaiming base support near the flat Kumo floor — showing signs of early trend reversal.
MACD: Bearish momentum is slowing; histogram is contracting, and the signal lines are curling. A crossover is in sight.
Entry Zone: Sitting on the pivot at $13.39 with clean structure.
Target: $21.01 (+40.69%)
Stop: $12.82 (-14.57%)
R/R: 2.79 — favorable skew
Price has room to run toward R1 with thin resistance overhead. This is a speculative breakout candidate, but the structure is tight and risk is defined.
🌐 Macro Lens
D-Wave sits at the intersection of quantum computing and AI. If tech sentiment rotates bullish, this could be a sleeper.
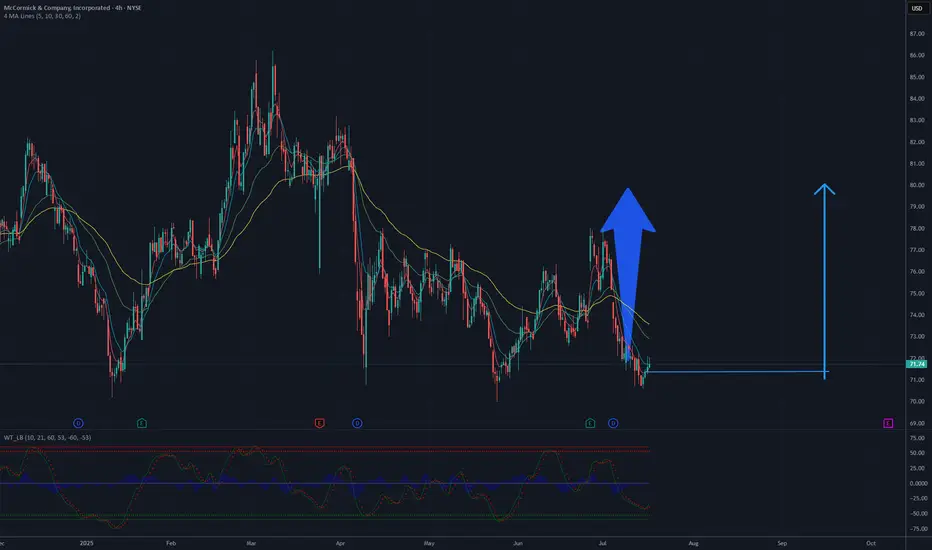
Ready for 80 USD? Time to grow for MKCThe chart analysis for this stock suggests a potential rise to 80 USD based on current technical patterns. The 4-hour chart shows a recent downtrend following a significant peak, with the price currently hovering around 71-72 USD. A key support level is evident near 70 USD, which could serve as a foundation for a potential rebound. The moving averages, including the 50-day and 200-day, indicate a prior bullish trend, and the current consolidation phase might precede another upward move.
Breaking through the resistance at 75-76 USD, a previous high, could signal the start of a new upward trend. With increased buying volume and bullish candlestick patterns, the price could target 80 USD, a notable psychological and technical resistance level. The RSI, currently in a neutral zone, could support this scenario if it begins to rise, indicating growing momentum. However, caution is advised, as a break below 70 USD support could negate this outlook and lead to further declines.
Potential TP: 80 USD
Expected to go in Bearish Mode - Keep watchDaily candle clearly says, retracement from the triangle breakout line completed. It showing as reversal.